. 2022 Jun 7;13(1):3267.
doi: 10.1038/s41467-022-30893-5.

Single-cell RNA-sequencing of peripheral blood mononuclear cells reveals widespread, context-specific gene expression regulation upon pathogenic exposure

Affiliations

Single-cell RNA-sequencing of peripheral blood mononuclear cells reveals widespread, context-specific gene expression regulation upon pathogenic exposure

Roy Oelen et al. Nat Commun. .

Abstract

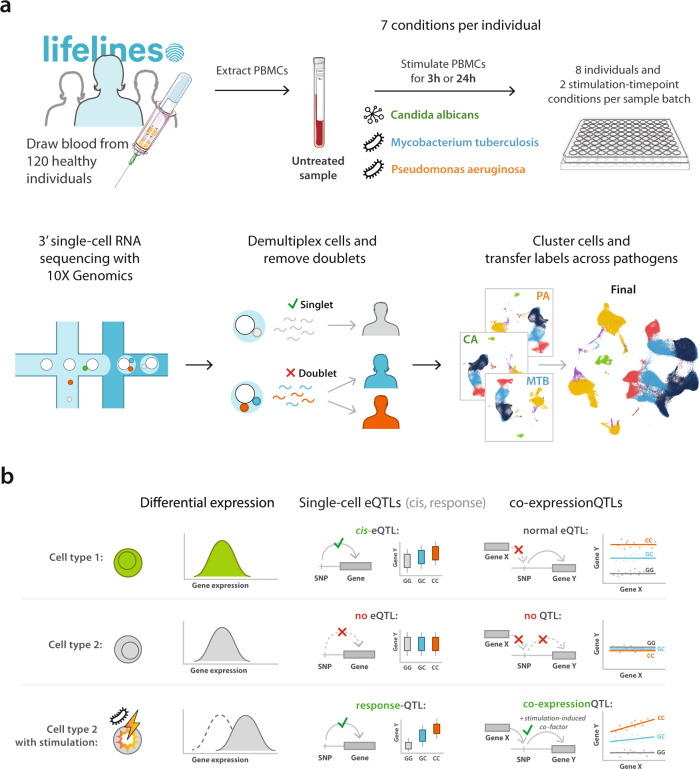
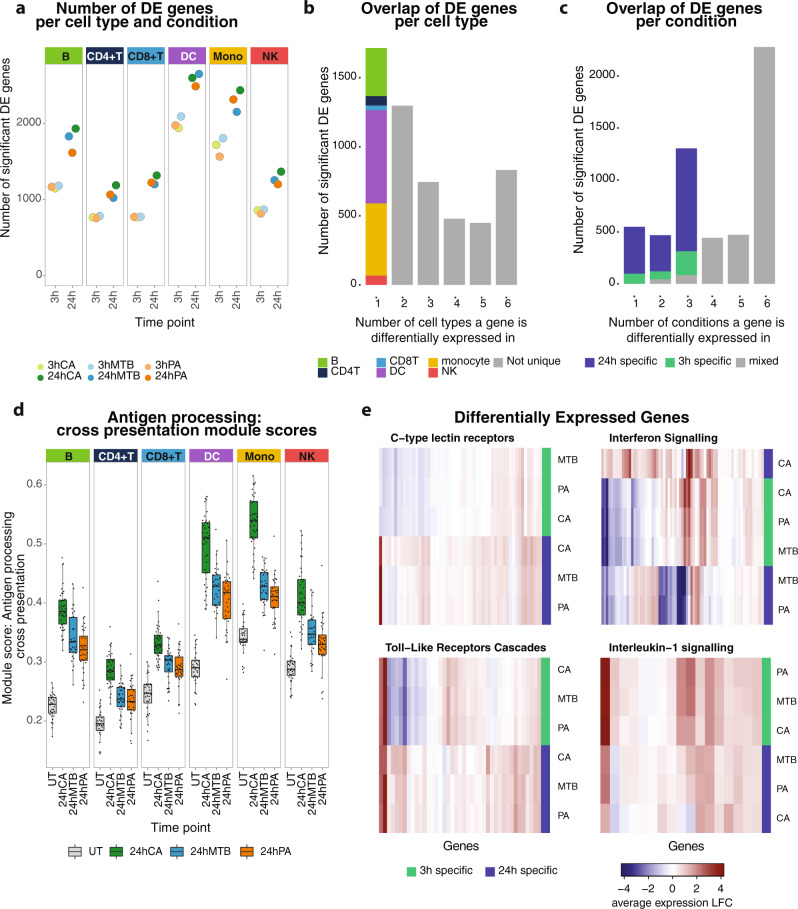
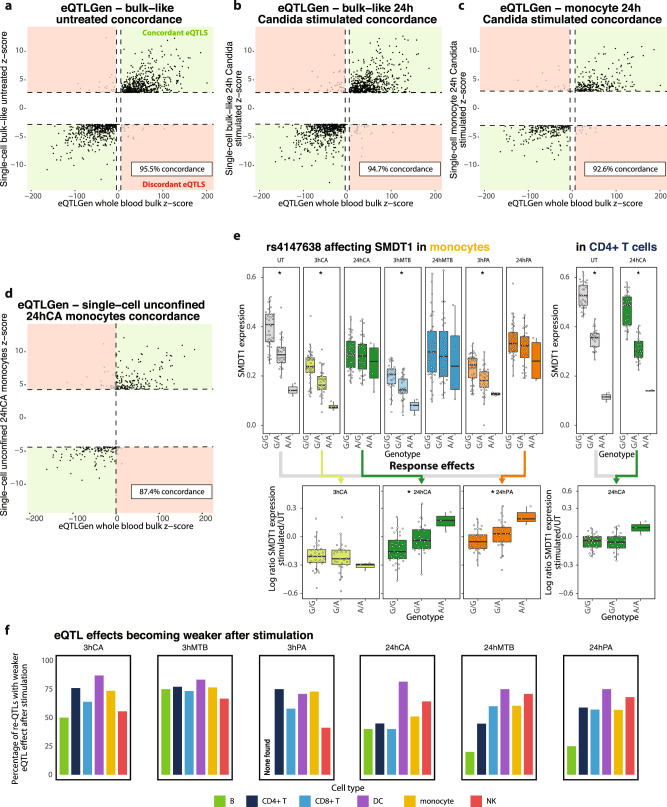
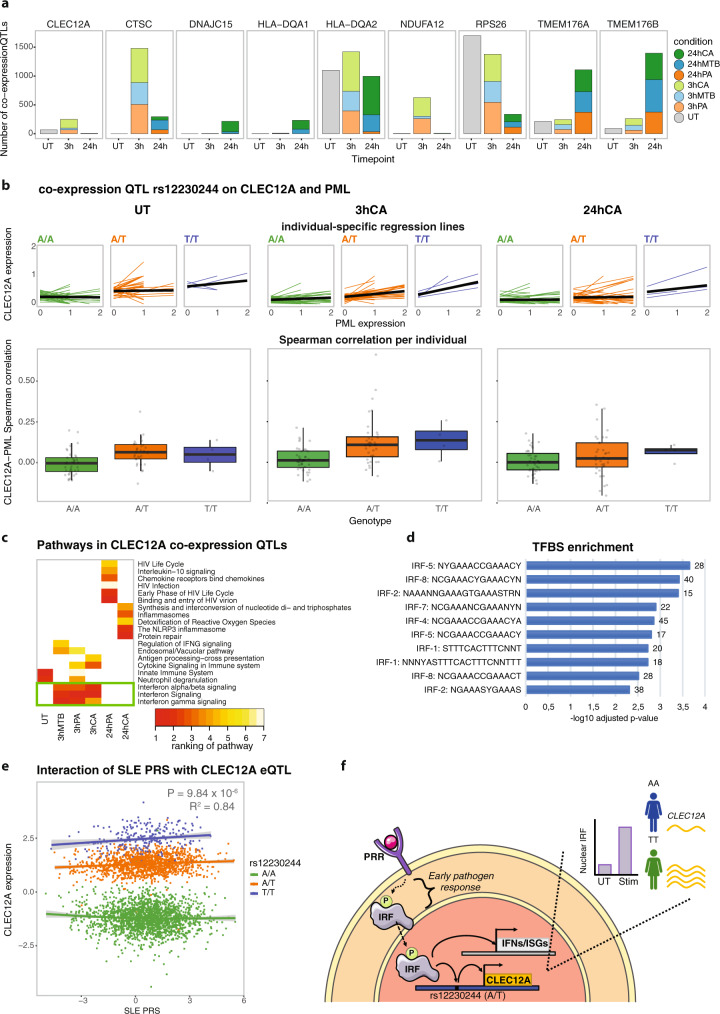
The host's gene expression and gene regulatory response to pathogen exposure can be influenced by a combination of the host's genetic background, the type of and exposure time to pathogens. Here we provide a detailed dissection of this using single-cell RNA-sequencing of 1.3M peripheral blood mononuclear cells from 120 individuals, longitudinally exposed to three different pathogens. These analyses indicate that cell-type-specificity is a more prominent factor than pathogen-specificity regarding contexts that affect how genetics influences gene expression (i.e., eQTL) and co-expression (i.e., co-expression QTL). In monocytes, the strongest responder to pathogen stimulations, 71.4% of the genetic variants whose effect on gene expression is influenced by pathogen exposure (i.e., response QTL) also affect the co-expression between genes. This indicates widespread, context-specific changes in gene expression level and its regulation that are driven by genetics. Pathway analysis on the CLEC12A gene that exemplifies cell-type-, exposure-time- and genetic-background-dependent co-expression interactions, shows enrichment of the interferon (IFN) pathway specifically at 3-h post-exposure in monocytes. Similar genetic background-dependent association between IFN activity and CLEC12A co-expression patterns is confirmed in systemic lupus erythematosus by in silico analysis, which implies that CLEC12A might be an IFN-regulated gene. Altogether, this study highlights the importance of context for gaining a better understanding of the mechanisms of gene regulation in health and disease.


Conflict of interest statement

C.J.Y. is a Scientific Advisory Board member for and hold equity in Related Sciences and ImmunAI, a consultant for and hold equity in Maze Therapeutics, and a consultant for TReX Bio. C.J.Y. has received research support from Chan Zuckerberg Initiative, Chan Zuckerberg Biohub, and Genentech. The remaining authors declare no competing interests.

Figures

Fig. 1
Fig. 1. Study overview.
a Blood was drawn from 120 individuals from the Northern Netherlands participating in the population-based cohort Lifelines. PBMCs were isolated within 2 h of blood collection and cryopreserved in liquid nitrogen until further use. For each scRNA-seq experiment, PBMCs from 16 individuals were thawed. Per individual, these PBMCs were left untreated (UT) or were stimulated with C. aAlbicans (CA), M. tTuberculosis (MTB), or P. aAeruginosa (PA) for 3 h or 24 h in a 96-well plate. In total, this resulted in 7 stimulation‒timepoint combinations per 120 individuals = 840 different conditions processed. Multiplexed 3’-end scRNA-seq was performed using the v2 and v3 chemistries of the 10x Genomics platform. Per experiment, two sample batches of a 10x chip were loaded, each containing a mixture of eight individuals and a combination of two different stimulation‒timepoint combinations. After sequencing, samples were demultiplexed and doublets were identified. Cell-type classification was performed on the QCed dataset by clustering the cells per pathogen, mixed with cells of the unstimulated condition. The cell-type labels were subsequently transferred back to the dataset containing all cells. b This study was conducted to identify cell-type-specific or pathogen-stimulation-dependent: (1) differentially expressed genes, (2) eQTLs and response-QTLs, and (3) co-expression QTLs.
Fig. 2
Fig. 2. Differentially expressed genes and pathways upon pathogen stimulation.
a Number of DE genes per cell type upon 3 h (light colors) or 24 h (dark colors) stimulation with C. aAlbicans (CA, green), M. tTuberculosis (MTB, blue), or P. aAeruginosa (PA, orange). b Bar plot showing the overlap of DE genes across cell types. The first bar, depicting the cell-type-specific DE genes, is colored based on the cell type in which the DE gene is found. c Bar plot showing the overlap of DE genes across pathogen‒timepoint combinations (3 h vs 24 h stimulation with CA, PA or MTB). Bars are colored based on the length of stimulation. d Boxplots (showing median, 25th and 75th percentile, and 1.5× the interquartile range) representing the module score of the antigen-processing cross-presentation pathway across all individuals per cell type and per 24 h pathogen-stimulated condition. Each dot shows the average module score per individual (V3 chemistry is shown, the Source Data file includes the individual data points). e Heatmaps showing the immune-related DE genes in monocytes (V3 chemistry is shown), split by their involvement in either one of the four selected immune pathways associated with pathogen recognition and its downstream signaling. C-type lectin and toll-like receptors show more general activation upon pathogen stimulation, whereas interleukin-1 and interferon signaling show a more specific expression pattern with timepoint (3 h stimulation) or stimulation (CA), respectively. DE summary statistics can be found in Supplementary Data 5. The number of individuals and cells included in each analysis can be found in the Source Data file.
Fig. 3
Fig. 3. eQTLs and re-QTLs upon pathogen stimulation.
Concordance between the eQTLs identified in 31,684 bulk whole-blood samples of the eQTLGen consortium and: a those identified in our eQTLGen lead-eSNP discovery of bulk-like unstimulated PBMC scRNA-seq data, (b) those identified in our eQTLGen lead-eSNP discovery of bulk-like 24 h C. albicans (CA)-stimulated PBMC scRNA-seq data, (c) those identified in our eQTLGen lead-eSNP discovery of monocyte 24 h CA-stimulated PBMC scRNA-seq data, and (d) those identified in our genome-wide eQTL discovery of monocyte 24 h CA-stimulated PBMC scRNA-seq data. e Boxplots showing the effect of the rs4147638 genotype on SMDT1 expression in the untreated (UT) condition and each of the six stimulation‒timepoint combinations in the monocytes (left) or for the UT and 24 h CA condition in the CD4+ T cells (right). Boxplots show median, first and third quartiles, and 1.5× the interquartile range, and each dot represents the average expression of all cells per cell type and individual. Stars indicate a significant effect (FDR < 0.001). The log ratio of SMDT1 expression in the UT cells vs a specific stimulation-timepoint combination is shown in the bottom. Colored arrows indicate which specific stimulation‒timepoint combination was selected for the corresponding re-QTL boxplot. f The proportion of re-QTLs of which the eQTL effect became weaker after stimulation, split per cell type and stimulation‒timepoint combination. eQTL summary statistics for eQTLGen-confined analysis, genome-wide analysis and response-QTL analysis can be found in Supplementary Data 7, Supplementary Data 8, and Supplementary Data 9, respectively. The number of individuals and cells included in each analysis can be found in the Source Data file.
Fig. 4
Fig. 4. Interferon regulatory factor affects CLEC12A co-expression QTLs upon 3 h pathogen stimulation in monocytes.
a Number of co-expression QTLs identified in each of the stimulation‒timepoint combinations for those co-expression QTLs with over 100 co-expression QTLs in at least one condition. The 3 h and 24 h timepoint are colored by pathogen stimulation (green: C. albicans (CA), blue: M. tuberculosis (MTB), orange: P. aeruginosa (PA). Co-expression QTL summary statistics can be found in Supplementary Data 11. b The lines in the top plots show co-expression between CLEC12A and PML (most significant co-expression QTL across the 3 h stimulation conditions) for individual cells in the untreated (left), 3 h CA (middle) and 24 h CA (right) condition. In these plots, individual-specific regression lines are shown, split by genotype. The average genotype-specific regression lines are shown in black. The bottom boxplots depict Spearman’s rank correlation between CLEC12A and PML expression, stratified by SNP rs12230244 genotype in the monocytes per individual, in the untreated (left), 3 h CA (middle) and 24 h CA (right) stimulated cells (the V2 chemistry data is plotted). Each data point shows a single individual. Boxplots show median, first and third quartiles, and 1.5× the interquartile range. c Heatmap of the top-5 enriched pathways within the co-expressed CLEC12A co-eQTL genes per stimulation‒timepoint combination. Per combination, pathways are ranked based on significance. White indicates that the pathway was not found to be enriched in that specific stimulation‒timepoint combination. The green box highlights pathways that are associated with all 3 h stimulation conditions. d Top 10 enriched putative transcription factor binding sites within the CLEC12A co-expression QTL genes that: (1) showed a more positive strength of the co-expression relationship in individuals with the TT as opposed to the AA genotype and (2) were identified in the 3 h stimulated (outer join) monocytes using the TRANSFAC database. Enrichment of putative transcription factor binding sites was defined using a g:SCS multiple testing correction method, applying a significance threshold of 0.05. e Co-expression QTL analysis for CLEC12A-SNP rs12230244 against the SLE polygenic risk score (PRS) (calculated using those SLE GWAS SNPs with a P-value threshold of <5 × 10−8) using whole-blood bulk expression data from 3553 individuals (BIOS consortium). A one-tailed F-test (coefficient = 0.04, standard error = 0.01, f-value = 19.60, p-value = 9.84 × 10−6, R2 = 0.84) was used to determine whether the distribution of the squared residuals with the SLE PRS as interaction term was significantly smaller than without. f Proposed mechanism of action of CLEC12A co-expression QTLs. When pathogen-associated molecular patterns bind to a pattern recognition receptor (PRR), a signaling cascade is initiated that eventually results in phosphorylation of interferon regulatory factors (IRFs). Phosphorylated IRF then translocates to the nucleus, where it binds to specific DNA motifs such as IFN-stimulated response elements. This can then activate transcription of IFNs and IFN-stimulated genes (ISGs). Additionally, IRF is expected to bind to a region containing SNP rs12230244 (or any another SNP in high LD), thereby regulating CLEC12A expression. In this case, depending on the SNP genotype, the IRF binding and activation of CLEC12A expression is expected to be stronger (TT genotype) or weaker (AA genotype). Many of the identified CLEC12A co-expression QTL genes are involved in the IFN pathway (see panel b). This has to be the result of a common upstream factor (i.e., IRF) of CLEC12A transcription that can also activate IFNs and ISGs, but cannot be the result of a downstream regulator because this would have led to trans-eQTL effects for the same SNP rs12230244 (which we do not observe). The number of individuals and cells included in each analysis can be found in the Source Data file.

References

    1. Visscher PM, et al. 10 years of GWAS discovery: biology, function, and translation. Am. J. Hum. Genet. 2017;101:5–22. doi: 10.1016/j.ajhg.2017.06.005. - DOI - PMC - PubMed
    1. Westra H-J, et al. Systematic identification of trans eQTLs as putative drivers of known disease associations. Nat. Genet. 2013;45:1238–1243. doi: 10.1038/ng.2756. - DOI - PMC - PubMed
    1. Yao DW, O’Connor LJ, Price AL, Gusev A. Quantifying genetic effects on disease mediated by assayed gene expression levels. Nat. Genet. 2020;52:626–633. doi: 10.1038/s41588-020-0625-2. - DOI - PMC - PubMed
    1. Fairfax BP, et al. Innate immune activity conditions the effect of regulatory variants upon monocyte gene expression. Science. 2014;343:1246949. doi: 10.1126/science.1246949. - DOI - PMC - PubMed
    1. Romanoski CE, et al. Systems genetics analysis of gene-by-environment interactions in human cells. Am. J. Hum. Genet. 2010;86:399–410. doi: 10.1016/j.ajhg.2010.02.002. - DOI - PMC - PubMed

Publication types