. 2022 Jun 7;13(1):3275.
doi: 10.1038/s41467-022-30630-y.

Cardiac fibroblasts regulate the development of heart failure via Htra3-TGF-β-IGFBP7 axis

Affiliations

Cardiac fibroblasts regulate the development of heart failure via Htra3-TGF-β-IGFBP7 axis

Toshiyuki Ko et al. Nat Commun. .

Abstract

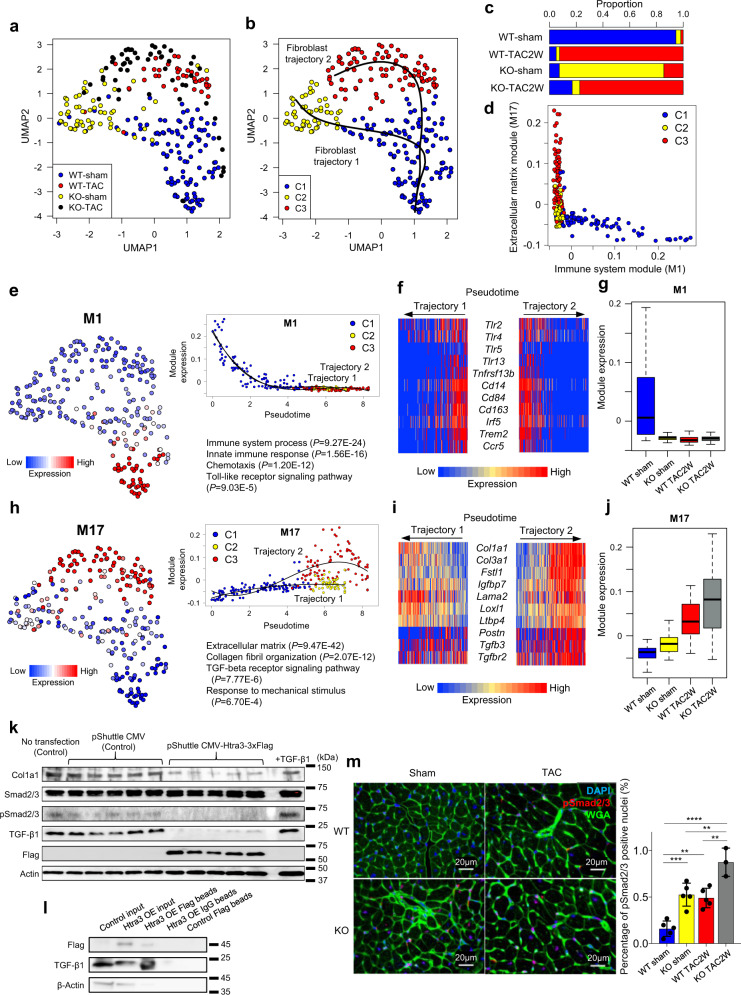
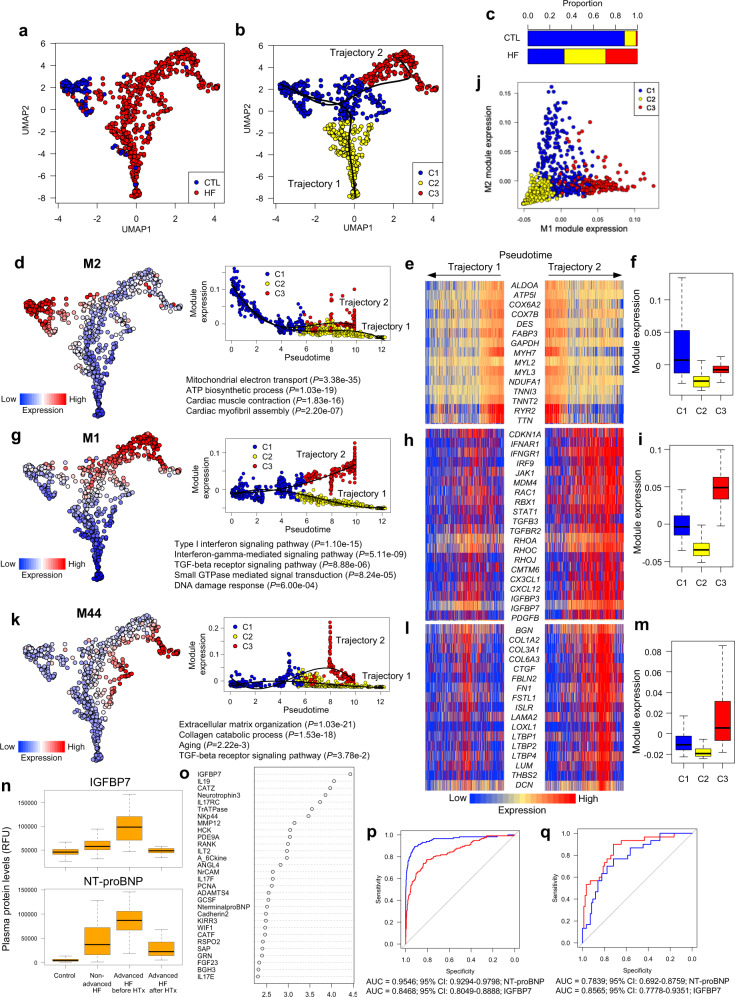
Tissue fibrosis and organ dysfunction are hallmarks of age-related diseases including heart failure, but it remains elusive whether there is a common pathway to induce both events. Through single-cell RNA-seq, spatial transcriptomics, and genetic perturbation, we elucidate that high-temperature requirement A serine peptidase 3 (Htra3) is a critical regulator of cardiac fibrosis and heart failure by maintaining the identity of quiescent cardiac fibroblasts through degrading transforming growth factor-β (TGF-β). Pressure overload downregulates expression of Htra3 in cardiac fibroblasts and activated TGF-β signaling, which induces not only cardiac fibrosis but also heart failure through DNA damage accumulation and secretory phenotype induction in failing cardiomyocytes. Overexpression of Htra3 in the heart inhibits TGF-β signaling and ameliorates cardiac dysfunction after pressure overload. Htra3-regulated induction of spatio-temporal cardiac fibrosis and cardiomyocyte secretory phenotype are observed specifically in infarct regions after myocardial infarction. Integrative analyses of single-cardiomyocyte transcriptome and plasma proteome in human reveal that IGFBP7, which is a cytokine downstream of TGF-β and secreted from failing cardiomyocytes, is the most predictable marker of advanced heart failure. These findings highlight the roles of cardiac fibroblasts in regulating cardiomyocyte homeostasis and cardiac fibrosis through the Htra3-TGF-β-IGFBP7 pathway, which would be a therapeutic target for heart failure.


Conflict of interest statement

The authors declare no competing interests.

Figures

Fig. 1
Fig. 1. Single-cell network analysis identifies cardiac fibroblast Htra3.
a Isolation of non-cardiomyocytes and fibroblasts for scRNA-seq using fluorescence-activated cell sorting (FACS). Sorted live non-cardiomyocytes (non-CMs) were used for scRNA-seq using the 10X Genomics platform. Sorted fibroblasts with an antibody against PDGFR-α were used for scRNA-seq using the full-length Smart-seq2. b, c Ligand-receptor interaction map in the heart. Genes of ligands and receptors were projected on a two-dimensional map based on their correlation structure. Cell types were annotated by cell-type-specific expression profiles of genes assigned to each module. Edges indicate correlation (b) or interaction (c). d Pathway analysis of genes illustrated on the interaction map in the heart. p-values are determined by Fisher’s Exact test. e Heatmap showing the number of interactions between cell types in the heart. VSMC, vascular smooth muscle cells. f Gene ontology (GO) analysis of upregulated genes after pressure overload in cardiac fibroblasts. Representative genes are also shown. p-values are determined by Fisher’s Exact test. g Co-expression network of cardiac fibroblasts. h Bar graph showing the top 10 genes most correlated with the cardiac fibroblast module. i Uniform Manifold Approximation and Projection (UMAP) plot of single-cell transcriptomes of non-cardiomyocytes (n = 1783) from the murine heart (n = 2). Cell-type annotation (left) and Htra3 expression (right) are on the UMAP plot. j RNA in situ hybridization of Htra3 and immunostaining of Pdgfr-α using the paired mirror cardiac sections. Arrows indicate the colocalization of the Htra3 and Pdgfr-α in the same cells. k RNA in situ hybridization of HTRA3 in the human heart. Arrows indicate HTRA3 expression.
Fig. 2
Fig. 2. Htra3 KO mice shows cardiac and cardiomyocyte hypertrophy and are vulnerable to mechanical stress.
a Representative cardiac morphology of WT and Htra3 KO mice at 2 weeks after TAC or sham surgery. b Echocardiographic assessment of the heart of WT and Htra3 KO mice after TAC or sham surgery. n = 11 (WT Sham), n = 15 (WT TAC), n = 10 (Htra3 KO Sham), n = 15 (Htra3 KO TAC). Data are shown as mean and SD. *P < 0.05, **P < 0.01, ***P < 0.005, ****P < 0.001; significance was determined by two-way analysis of variance (ANOVA) with Bonferroni’s multiple comparison test. Source data are provided as a Source Data file. c, Assessment of cardiomyocyte section area. WGA and DAPI are used to stain the plasma membrane and nucleus, respectively. Results of quantitative analysis are also shown. Averaged data from about 40–100 cells per heart (n = 3 each). Data are shown as mean and SD. **P < 0.01, ***P < 0.005, ****P < 0.001; significance was determined by one-way ANOVA with Tukey’s or Dunnett’s post hoc test. Source data are provided as a Source Data file. d Histochemical detection of collagen fibers by Sirius Red/Fast Green dye staining in WT and Htra3 KO mice after TAC or sham surgery. Results of quantitative analysis of fibrosis area are also shown (n = 3 each). Data are shown as mean and SD. *P < 0.05, **P < 0.01, ***P < 0.005, ****P < 0.001; significance was determined by two-way ANOVA with Tukey’s or Dunnett’s post hoc test. Source data are provided as a Source Data file. e Violin plot showing Htra3 RNA expression in cardiac fibroblasts at 2 weeks after TAC (n = 40) and sham surgery (n = 109) in WT mice. Data represent box plots and individual data points. Box plots show the median (center line), first and third quartiles (box edges), while the whiskers going from each quartile to the minimum or maximum. f Violin plot showing the HTRA3 expression levels (n = 143 cells from control subjects (CTL), n = 151 cells for patients with heart failure (HF)). g mRNA expression levels of Htra3 and Tgfb1 in cultured cardiac fibroblasts after the 0~30% mechanical extension were assessed by real-time qPCR (n = 5, 6, 6, 6 at each group, respectively). Data are shown as mean and SD. *P < 0.05, **P < 0.01; Significance was determined by one-way analysis of variance (ANOVA) with Bonferroni’s multiple comparison test. Source data are provided as a Source Data file.
Fig. 3
Fig. 3. Single-cell RNA-seq of cardiac fibroblasts reveals that Htra3 maintains their quiescent state by TGF-β inhibition.
a UMAP plot of single-cell transcriptomes of cardiac fibroblasts isolated from WT and Htra3 KO mice at 2 weeks after TAC or sham surgery using an antibody against PDGFR-α (n = 109 cells for WT sham, n = 40 for WT TAC, n = 55 for KO sham, n = 53 for KO TAC). b Trajectory analysis on the UMAP plot in a. Clusters classified by graph-based clustering are shown by colors. Trajectories identified by the Slingshot algorithm are also shown. c Bar graph showing the distribution of the clusters in b. d Scatter plot showing the module eigengene (ME) expression of M1 and M17 for each cell. e M1 expression on the UMAP plot (left) and its dynamics along pseudotime (upper right). Enriched GO terms and enrichment P-values are also shown (lower right). p-values are determined by Fisher’s Exact test. f Heatmap showing the expression levels of selected M1 genes during the trajectories. g Boxplot of the M1 expression. Data represent box plots and individual data points. Box plots show the median (center line), first and third quartiles (box edges), while the whiskers going from each quartile to the minimum or maximum. n = 109 for WT-sham, n = 55 for KO-sham, n = 40 for WT-TAC, n = 53 for KO-TAC. h M17 expression on the UMAP plot (left) and its dynamics along pseudotime (upper right). Enriched GO terms are also shown (lower right). p-values are determined by Fisher’s Exact test. i Heatmap showing the expression levels of selected M17 genes during the trajectories. j Boxplot of the M17 expression. Data represent box plots and individual data points. Box plots show the median (center line), first and third quartiles (box edges), while the whiskers going from each quartile to the minimum or maximum. n = 109 for WT-sham, n = 55 for KO-sham, n = 40 for WT-TAC, n = 53 for KO-TAC. k Western blot analysis using cardiac fibroblasts. TGF-β1 treatment was used as a positive control for pSmad2/3. l Immunoprecipitation followed by western blot analysis showing the binding of Htra3 to mature TGF-β1. m Immunostaining of pSmad2/3 on heart sections. pSmad2/3(Red), Wheat germ agglutinin (WGA, Green) and 4′,6-diamidino-2-phenylindole (DAPI, Blue) are used to stain the plasma membrane and nucleus, respectively. Results of quantitative analysis are also shown (n = 5, 5, 5, 3 biologically independent mice, from left to right). Data are shown as mean and SD. **P < 0.01, ***P < 0.005, ****P < 0.001; Significance was determined by one-way ANOVA with Tukey’s or Dunnett’s post hoc test. Source data are provided as a Source Data file.
Fig. 4
Fig. 4. Single-cell RNA-seq of cardiomyocytes shows that Htra3 prevents the induction of senescent failing cardiomyocytes.
a UMAP plot of single-cell transcriptomes of cardiomyocytes isolated from WT and Htra3 KO mice 2 weeks after TAC or sham surgery (n = 175 cells for WT sham, n = 87 for WT TAC, n = 117 for KO sham, n = 75 for KO TAC). b Trajectory analysis on the UMAP plot in a. Clusters classified by graph-based clustering are shown by colors. Trajectories identified by the Slingshot algorithm are also shown. c Bar graph showing the distribution of the clusters in b. d M1 expression on the UMAP plot (left) and its dynamics along pseudotime (upper right). Enriched GO terms and enrichment P-values are also shown (lower right). p-values are determined by Fisher’s Exact test. e Heatmap showing the expression levels of selected M1 genes during the trajectories. f Boxplot of the M1 expression. Data represent box plots and individual data points. Box plots show the median (center line), first and third quartiles (box edges), while the whiskers going from each quartile to the minimum or maximum. n = 175 for WT-sham, n = 117 for KO-sham, n = 87 for WT-TAC, n = 75 for KO-TAC. g M2 expression on the UMAP plot (left) and its dynamics along pseudotime (upper right). Enriched GO terms are also shown (lower right). p-values are determined by Fisher’s Exact test. h Heatmap showing the expression levels of selected M2 genes during the trajectories. i Boxplot of the M2 expression. Data represent box plots and individual data points. Box plots show the median (center line), first and third quartiles (box edges), while the whiskers going from each quartile to the minimum or maximum. n = 175 for WT-sham, n = 117 for KO-sham, n = 87 for WT-TAC, n = 75 for KO-TAC. j Immunostaining of γH2A.X (Yellow) and p21 (Red) on heart sections from WT and Htra3 KO mice after TAC or sham surgery (4 weeks). WGA (Green) and DAPI (Blue) are used to stain the plasma membrane and nucleus, respectively. Arrows indicate the gH2A.X/p21-positive nuclei. k Boxplot showing expression of DNA damage-related genes (Cdkn1a and Trp53) in single-cardiomyocytes. Data represent box plots and individual data points. Box plots show the median (center line), first and third quartiles (box edges), while the whiskers going from each quartile to the minimum or maximum. n = 175 for WT-sham, n = 117 for KO-sham, n = 87 for WT-TAC, n = 75 for KO-TAC. l Heatmap showing the expression levels of selected M2 secretory factor genes during the trajectories. m M9 expression on the UMAP plot (left) and its dynamics along pseudotime (upper right). Enriched GO terms are also shown (lower right). p-values are determined by Fisher’s Exact test. n Heatmap showing the expression levels of selected M9 genes during the trajectories. o Boxplot of the M9 expression. Data represent box plots and individual data points. Box plots show the median (center line), first and third quartiles (box edges), while the whiskers going from each quartile to the minimum or maximum. n = 175 for WT-sham, n = 117 for KO-sham, n = 87 for WT-TAC, n = 75 for KO-TAC.
Fig. 5
Fig. 5. TGF-β-induced Nox4 activation induces senescent failing cardiomyocytes and heart failure.
a Experimental design for testing the effect of shNox4 AAV9 vectors and validation of AAV9 transduction with the AAV9-eGFP vector. WGA (Red) and DAPI (Blue) are used to stain the plasma membrane and nucleus, respectively. Arrows indicate the GFP transduced cells. b Echocardiographic assessment of the heart from TAC-induced Htra3 KO mice after injection of control or shNox4 AAV9 vectors (n = 4 each). Data are shown as mean and SD. *P < 0.05, **P < 0.01, ****P < 0.001; significance was determined by two-way ANOVA with Bonferroni’s multiple comparison test. Source data are provided as a Source Data file. c Immunostaining of γH2A.X on the heart sections from TAC-induced Htra3 KO mice after injection of control or shNox4 AAV9 vectors. WGA (Green) and DAPI (Blue) are used to stain the plasma membrane and nucleus, respectively. Arrows indicate the γH2A.X-positive nuclei. d Western blot analysis of γH2A.X using isolated cardiomyocytes from TAC-induced Htra3 KO mice after injection of control or shNox4 AAV9 vectors. e Western blot analysis using isolated cardiomyocytes from TAC-induced Htra3 KO mice after injection of control or shNox4 AAV9 vectors. f Experimental design for testing the effect of AAV9-Htra3 vectors. g Western blot analysis using isolated cardiomyocytes from TAC-induced mice after injection of AAV9-Control or AAV9-Htra3 vectors. h Echocardiographic assessment of the heart from TAC-induced mice after injection of AAV9-Control or AAV9-Htra3 vectors (n = 7 each). Data are shown as mean and SD. *P < 0.05, **P < 0.01, ****P < 0.001; significance was determined by two-way ANOVA with Bonferroni’s multiple comparison test. Source data are provided as a Source Data file. i Representative echocardiographic images of WT mice injected with either AAV9-Control or AAV9-Htra3. j Histochemical detection of collagen fibers by Sirius Red/Fast Green dye staining of the heart from TAC-induced mice after injection of AAV9-Control or AAV9-Htra3 vectors.
Fig. 6
Fig. 6. Spatial transcriptomic analysis reveals Htra3 repression-mediated spatial induction of senescent failing cardiomyocytes.
a Spatial expression profiles of Htra3 across heart tissue sections of mice after sham or MI operation. The dashed circle represents the infarct region. b Histochemical detection of collagen fibers by Sirius Red/Fast Green dye staining in WT and Htra3 KO mice at 4 weeks after myocardial infarction (MI) operation. c Echocardiographic assessment of the heart of wild-type (WT) and Htra3 KO mice after MI operation. n = 12 (WT), n = 6 (KO). Data are shown as mean and SD. *P < 0.05, **P < 0.01, ***P < 0.005; significance was determined by two-way analysis of variance (ANOVA) with Bonferroni’s multiple comparison test. d Hematoxylin and eosin stained tissue sections of the infarcted hearts and their corresponding spatial distribution of clusters characterized by specific expression profiles (left). The dashed circles represent the infarct regions. The colors of spatial points were corresponded to the bar graphs showing the distribution of clusters in each section (right). The number of analyzed spots are also shown. e Differential gene expression analysis showing up- and down-regulated genes across all five clusters. An adjusted p-value < 0.05 and log2FC > 0.25 is indicated in red, while others are indicated in black. Source data are provided as a Source Data file. f Dot plot representing the distribution of cell-types predicted based on the scRNA-seq of cells isolated from mice after sham or MI operation. Dot size represents the average of predict score of each spot in each cluster. g Single-cell trajectory analysis of cardiomyocytes isolated from the infarct zone. h The expression dynamics of genes characteristic for senescent failing cardiomyocytes along pseudotime. i The spatial expression patterns of genes characteristic for senescent failing cardiomyocytes. The dashed circles represent the infarct regions.
Fig. 7
Fig. 7. Single-cardiomyocyte RNA-seq and plasma proteome analysis of patients with heart failure.
a UMAP plot of single-cell transcriptomes of cardiomyocytes isolated from control subjects (CTL) or patients with heart failure (HF) (n = 85 cells for CTL, n = 678 for HF). b Trajectory analysis on the UMAP plot in a. Clusters classified by graph-based clustering are shown by colors. Trajectories identified by the Slingshot algorithm are also shown. c Bar graph showing the distribution of the clusters in b. d M2 expression on the UMAP plot (left) and its dynamics along pseudotime (upper right). Enriched GO terms are also shown (lower right). e Heatmap showing the expression levels of selected M2 genes during the trajectories. f Boxplot of the M2 expression. Data represent box plots and individual data points. Box plots show the median (center line), first and third quartiles (box edges), while the whiskers going from each quartile to the minimum or maximum. n = 300 for C1, n = 267 for C2, n = 196 for C3. g M1 expression on the UMAP plot (left) and its dynamics during trajectories (upper right). Enriched GO terms and enrichment P-values are also shown (lower right). h Heatmap showing the expression levels of selected M1 genes during the trajectories. i Boxplot of the M1 expression. Data represent box plots and individual data points. Box plots show the median (center line), first and third quartiles (box edges), while the whiskers going from each quartile to the minimum or maximum. n = 300 for C1, n = 267 for C2, n = 196 for C3. j Scatter plot showing the ME expression of M1 and M2 for each cell. k M44 expression on the UMAP plot (left) and its dynamics along pseudotime (upper right). Enriched GO terms are also shown (lower right). l Heatmap showing the expression levels of selected M44 genes during the trajectories. m Boxplot of the M44 expression. Data represent box plots and individual data points. Box plots show the median (center line), first and third quartiles (box edges), while the whiskers going from each quartile to the minimum or maximum. n = 300 for C1, n = 267 for C2, n = 196 for C3. n Boxplot of plasma protein levels of IGFBP7 (upper) and NT-proBNP (lower). RFU, relative fluorescence unit. HF, heart failure. HTx, heart transplantation. Data represent box plots and individual data points. Box plots show the median (center line), first and third quartiles (box edges), while the whiskers going from each quartile to the minimum or maximum. n = 768 for Control, n = 85 for non-advanced HF, n = 30 for advanced HF before HTx, n = 30 for advanced HF after HTx. o Mean decrease in accuracy (in order of decreasing accuracy from top to bottom) of proteins involved in classification between manifest and advanced heart failure as assigned by the random forest classifier. p Receiver-operating characteristic (ROC) curves based on plasma protein levels of NT-proBNP and IGFBP7 for predicting the incidence of heart failure. Area under the curve is also shown for each marker. NT-proBNP had significantly better ability to diagnose heart failure (P-value = 1.109e-07). Areas under the ROC curve were calculated using logistic regression. q ROC curves based on plasma protein levels of NT-proBNP and IGFBP7 for discriminating patients with advanced heart failure. Area under the curve is also shown for each marker. Although not statistically significant, IGFBP7 had a higher power to determine the severity of heart failure (P-value = 0.1063). Areas under the ROC curve were calculated using logistic regression.

References

    1. Henderson NC, Rieder F, Wynn TA. Fibrosis: From mechanisms to medicines. Nature. 2020;587:555–566. doi: 10.1038/s41586-020-2938-9. - DOI - PMC - PubMed
    1. Gorgoulis V, et al. Cellular senescence: Defining a path forward. Cell. 2019;179:813–827. doi: 10.1016/j.cell.2019.10.005. - DOI - PubMed
    1. López-Otín C, Kroemer G. Hallmarks of health. Cell. 2021;184:33–63. - PubMed
    1. Wang L, et al. Single-cell reconstruction of the adult human heart during heart failure and recovery reveals the cellular landscape underlying cardiac function. Nat. Cell Biol. 2020;22:108–119. doi: 10.1038/s41556-019-0446-7. - DOI - PubMed
    1. Triposkiadis F, Xanthopoulos A, Butler J. Cardiovascular aging and heart failure: JACCC review topic of the week. J. Am. Coll. Cardiol. 2019;74:804–813. doi: 10.1016/j.jacc.2019.06.053. - DOI - PubMed

Publication types

MeSH terms

Substances