. 2022 Jun 7;12(1):9399.
doi: 10.1038/s41598-022-13625-z.

An approach to cellular tropism of SARS-CoV-2 through protein-protein interaction and enrichment analysis

Affiliations

An approach to cellular tropism of SARS-CoV-2 through protein-protein interaction and enrichment analysis

Daniel Ortega-Bernal et al. Sci Rep. .

Abstract

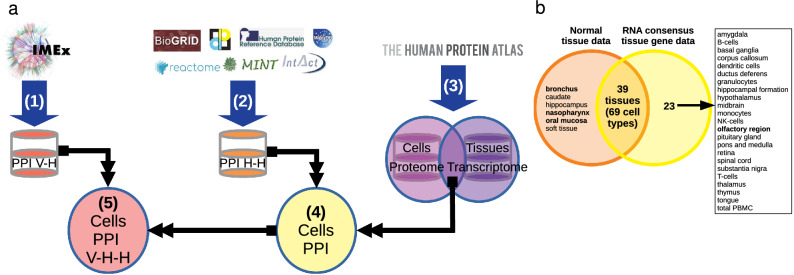
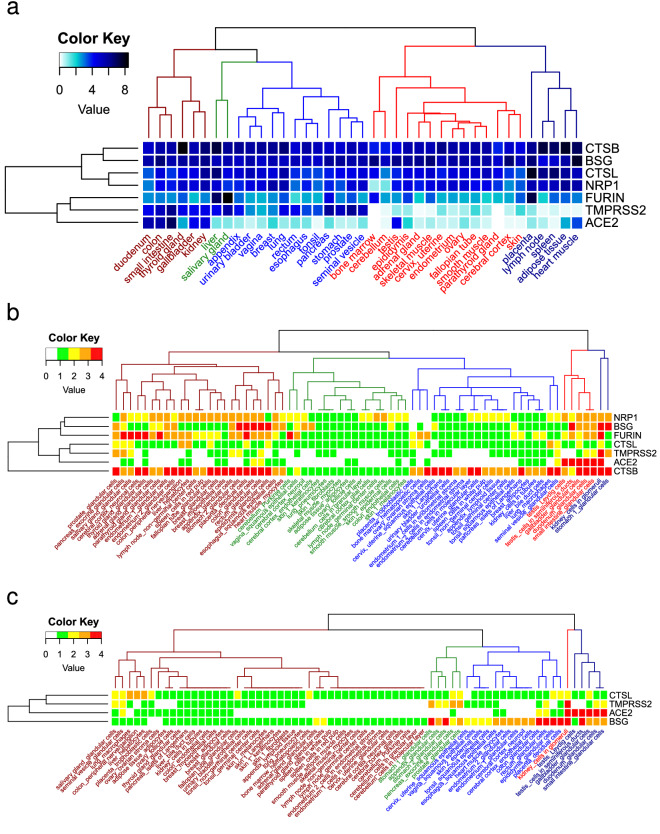
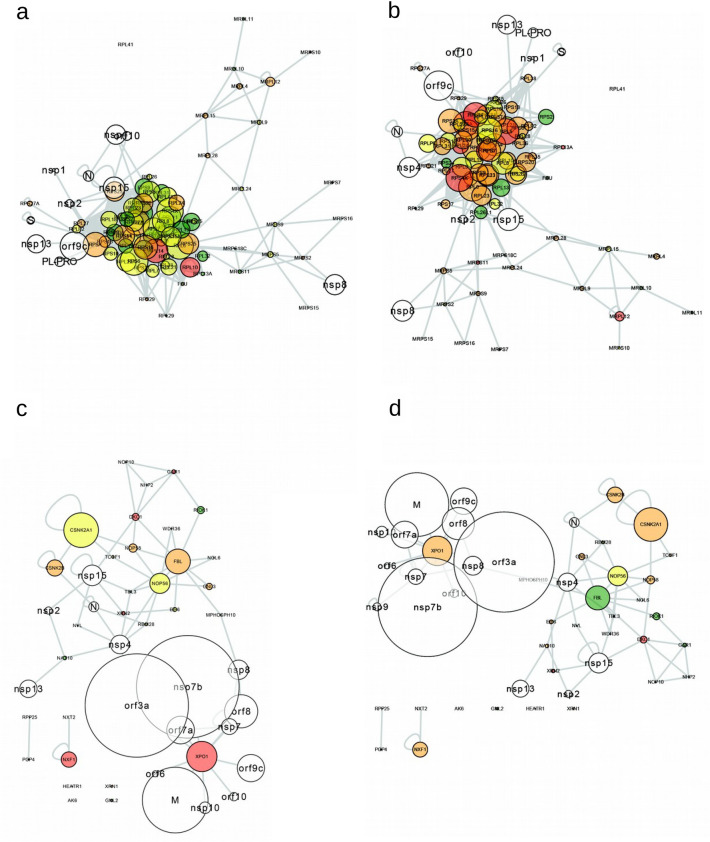
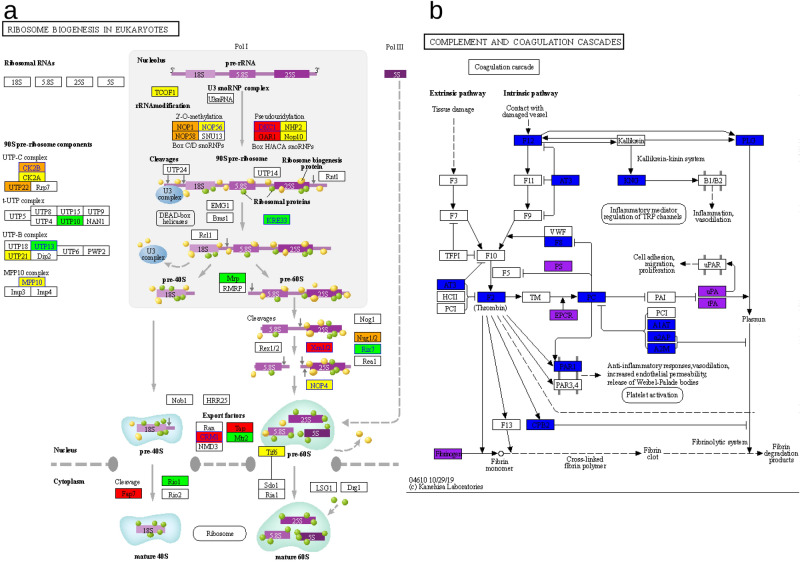
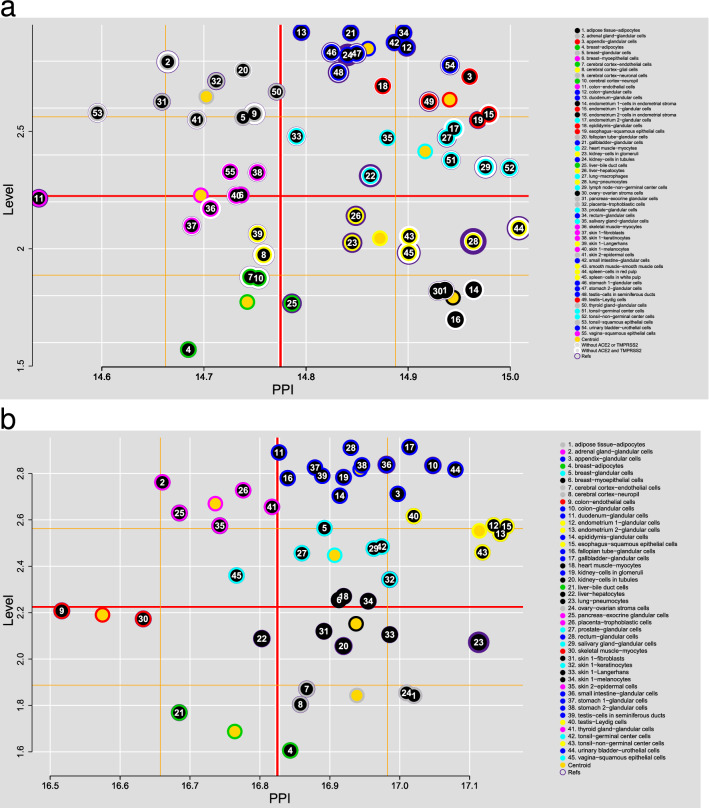
COVID-19, caused by SARS-CoV-2, is a primarily pulmonary disease that can affect several organs, directly or indirectly. To date, there are many questions about the different pathological mechanisms. Here, we generate an approach to identify the cellular-level tropism of SARS-CoV-2 using human proteomics, virus-host interactions, and enrichment analysis. Through a network-based approach, the molecular context was visualized and analyzed. This procedure was also performed for SARS-CoV-1. We obtained proteomes and interactomes from 145 different cells corresponding to 57 different tissues. We discarded the cells without the proteins known for interacting with the virus, such as ACE2 or TMPRSS2. Of the remaining cells, a gradient of susceptibility to infection was observed. In addition, we identified proteins associated with the coagulation cascade that can be directly or indirectly affected by viral proteins. As a whole we identified 55 cells that could be potentially controlled by the virus, with different susceptibilities, mainly being pneumocytes, heart, kidney, liver, or small intestine cells. These results help to explain the molecular context and provide elements for possible treatments in the current situation. This strategy may be useful for other viruses, especially those with limited reported PPI, such as a new virus.


Conflict of interest statement

The authors declare no competing interests.

Figures

Figure 1
Figure 1
Research strategy. 1: (a) Obtaining the PPI of the SARS-CoV-2—Human (V-H) from IMEx; 2: Integration of human-specific PPIs from 7 primary databases (H–H); 3: Obtaining proteomes and transcriptomes, selecting those results that are reported at both levels; 4: Generation of human PPI (H–H) for each cell; 5: Obtaining the PPI of the viral infection (V-H–H) of each cell. Images were taken from https://www.imexconsortium.org/, https://dip.doe-mbi.ucla.edu/dip/Main.cgi, https://www.ebi.ac.uk/intact/, https://mint.bio.uniroma2.it/, https://thebiogrid.org/, https://www.hprd.org/, http://matrixdb.univ-lyon1.fr/, https://reactome.org/ and . (b) Tissues and cells that shared a set of the seven cell entry proteins/genes. For six cell types there are no reports at the tissue level (transcriptome) and for 23 tissues no cells are reported (proteome).
Figure 2
Figure 2
Cell and tissue heatmap based on potential input genes/proteins. (a) SARS-CoV-2, 39 tissues and seven messengers. Consistent with what is reported in the figure above, ACE2 and TMPRSS2 have the lowest expression, followed by FURIN. Of the 39 tissues, bone marrow, cerebellum and parathyroid gland have the lowest expression of ACE2 and TMPRSS2. The white to blue colored scales represent the Expression value provided by ProteinAtlas. (b) SARS-CoV-2, 69 cell types and seven proteins. In the red and dark blue branches and later in the dark red branch, the cell types with the highest protein presence are concentrated. Green and blue branches group those cell types with lower presence, as well as those without ACE2 or TMPRSS2 (also in the dark red branch), mainly. (c) SARS-CoV-1, 69 cell types and 4 proteins. The dark red branch is where the cells with the lowest presence of protein or mRNA are grouped; in the central part, the 14 removed cells are observed. The color represents the Expression value, white (not reported at either the transcript or protein level), green (only present at the transcript level), yellow (low amount of protein reported), orange (intermediate amount of protein reported), and red (high amount of protein reported).
Figure 3
Figure 3
V-H networks and their respective wordclouds. (a,c) lung (pneumocytes); (b) and (d) lung (macrophages), in SARS-CoV-2; (e,f) networks in SARS-CoV-1, same order as the previous ones. The wordclouds show the main proteins present in (a,b). The size of the circles indicates the connectivity and the color to the Expression value, 1: green (only present at the transcript level), 2: yellow (low amount of protein reported), 3: orange (intermediate amount of protein reported), 4: red (high amount of protein reported) and in white the viral proteins.
Figure 4
Figure 4
Enrichment of results, KEGG heatmap. (a) Signaling pathways in SARS-CoV-2; (b) signaling pathways in SARS-CoV-1. The blue color identifies a higher p-value and the red color a lower value (using a logarithmic transformation). A gradient of involvement of the signaling pathways, and therefore of the cells, is identified in both heatmaps from left to right (less altered to more altered, respectively).
Figure 5
Figure 5
Specific networks. (a,b) ribosome pathway networks: (c,d) networks of the ribosome synthesis pathway. Lung (macrophages and pneumocytes), respectively. The color code and size nodes are the same as in Fig. 3. In the ribosome pathway there are 11 viral proteins (N, nsp4, PL-PRO, nsp2, nsp8, nsp13, orf9c, S, nsp1, orf10, and nsp15) that interact with proteins of this pathway. In Ribosome biogenesis in eukaryotes pathway there are 16 viral proteins (nsp7b, N, orf7a, nsp4, nsp2, nsp8, nsp13, nsp7, orf8, nsp10, orf9c, M, orf6, orf10, nsp15, and orf3a) that interact with proteins in this pathway; among them the 3 proteins with a high connectivity of SARS-CoV-2: M, nsp7b, and orf3a. These data are for the 2 cells shown. Similar results for kidney (cells in tubules) and small intestine (glandular cells) are present in Supplementary Fig. S7.
Figure 6
Figure 6
Signaling pathways KEGG. (a) Signaling pathway for the synthesis of ribosomes in lung (pneumocytes), 10 proteins with direct interaction with name and line blue. 30 of 101 proteins are reported. The colors code associated to expression value was used. (b) Coagulation cascade and the 19 proteins (39 including those of the complement system) that can interact directly (purple), 6 proteins, or indirectly (blue), 13 proteins, with SARS-CoV-2 proteins in blood. Only the coagulation cascade is shown.
Figure 7
Figure 7
K-Means of the cells and their potential of infection. (a) SARS-CoV-2; at the top of quadrant 4, the cells most reported in the literature as infected in autopsies are identified (width purple ring), followed by quadrant 1. (b) SARS-CoV-1; pneumocytes are found in the same region as in (a) (upper side of quadrant 4, black group). Quadrant 1: high expression value (Level) and high PPI (upper right side); quadrant 2: high expression value and low PPI (upper left side); quadrant 3: low expression value and low PPI (bottom left); and quadrant 4: low expression value and high PPI (lower right side). As expected, glandular cells are mainly concentrated in the upper quadrants, gray, blue, red, and cyan cluster in (a) and lilac, blue, cyan, and yellow in (b). For Ref., see Supplementary Table S1, S2 and Supplementary Information.

Similar articles

Cited by

References

    1. Gordon DE, et al. A SARS-CoV-2-human protein-protein interaction map reveals drug targets and potential drug-repurposing. BioRxiv. 2020 doi: 10.1101/2020.03.22.002386. - DOI - PMC - PubMed
    1. Li J, et al. Virus-host interactome and proteomic survey reveal potential virulence factors influencing SARS-CoV-2 pathogenesis. Med (N Y) 2021;2:99–112.e7. - PMC - PubMed
    1. Stukalov A, et al. Multilevel proteomics reveals host perturbations by SARS-CoV-2 and SARS-CoV. Nature. 2021;594:246–252. doi: 10.1038/s41586-021-03493-4. - DOI - PubMed
    1. Khorsand B, Savadi A, Naghibzadeh M. SARS-CoV-2-human protein-protein interaction network. Inform. Med. Unlocked. 2020;20:100413. doi: 10.1016/j.imu.2020.100413. - DOI - PMC - PubMed
    1. Messina F, et al. COVID-19: Viral-host interactome analyzed by network based-approach model to study pathogenesis of SARS-CoV-2 infection. J. Transl. Med. 2020;18:233. doi: 10.1186/s12967-020-02405-w. - DOI - PMC - PubMed

Substances