

zmm28 transgenic maize increases both N uptake- and N utilization-efficiencies
- PMID: 35672405
- PMCID: PMC9174173
- DOI: 10.1038/s42003-022-03501-x
zmm28 transgenic maize increases both N uptake- and N utilization-efficiencies
Abstract
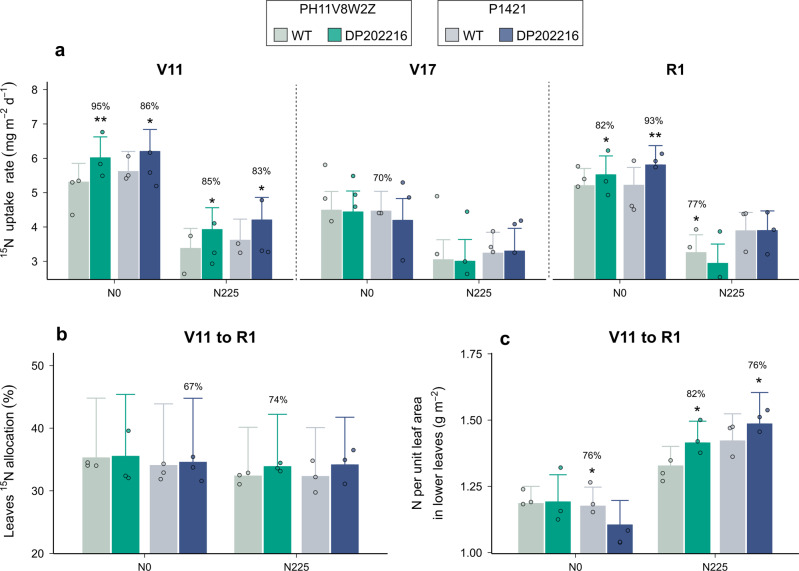
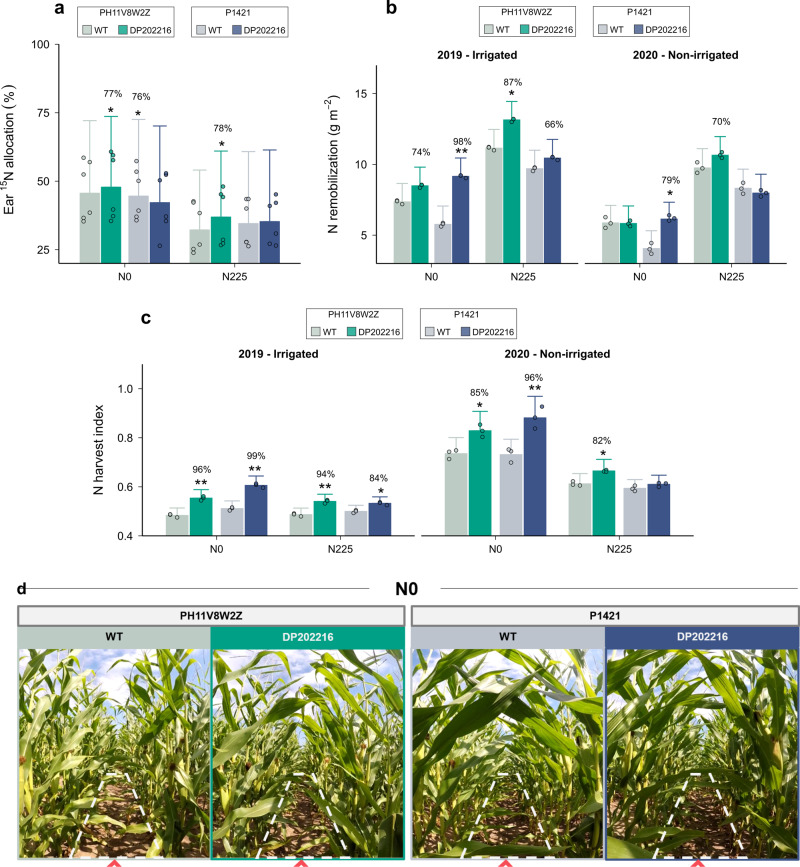
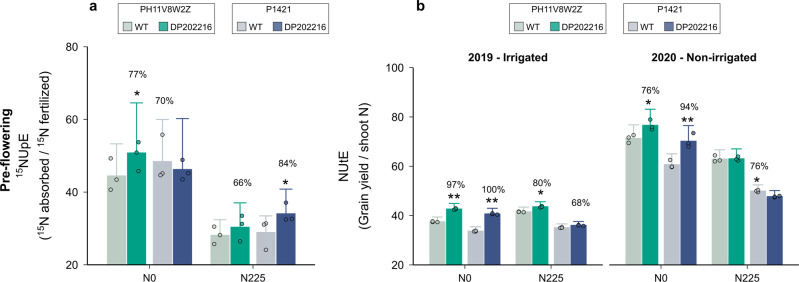
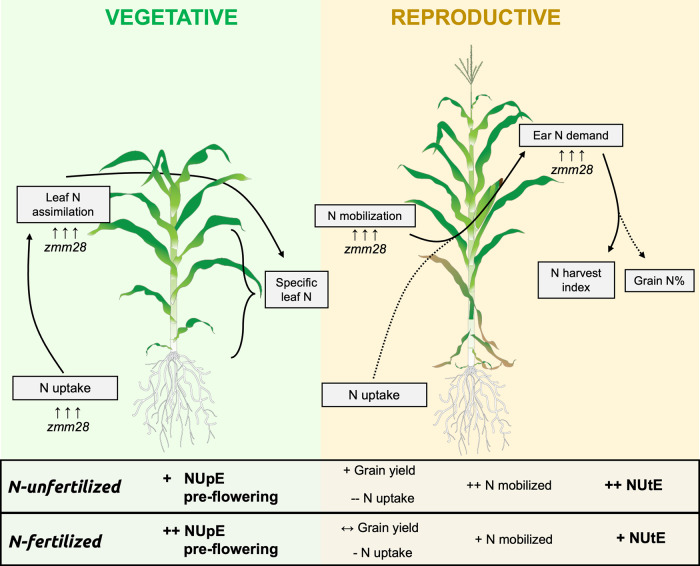
Biotechnology has emerged as a valuable tool in the development of maize (Zea mays L.) hybrids with enhanced nitrogen (N) use efficiency. Recent work has described the positive effects of an increased and extended expression of the zmm28 transcription factor (Event DP202216) on maize yield productivity. In this study, we expand on the previous findings studying maize N uptake and utilization in DP202216 transgenic hybrids compared to wild-type (WT) controls. Isotope 15N labeling demonstrates that DP202216 hybrids have an improved N uptake during late-vegetative stages (inducing N storage in lower leaves of the canopy) and, thus, N uptake efficiency (N uptake to applied N ratio) relative to WT. Through both greater N harvest index and reproductive N remobilization, transgenic plants were able to achieve better N utilization efficiency (yield to N uptake ratio). Our findings suggest the DP202216 trait could open new avenues for improving N uptake and utilization efficiencies in maize.
© 2022. The Author(s).
Conflict of interest statement
The authors (Bing, Habben, Masek, Schussler, Weers) are present or former scientists employed at Corteva Agriscience which supported this work. Some patent applications covering this work may have been filed that include one or more of the listed authors. Materials reported in this paper may be subject to third party ownership and/or to government regulations. Availability of materials reported in this paper to academic investigators for non-commercial research purposes under an applicable material transfer agreement will be subject to the requisite permission from any third-party owners of all or parts of the materials and to governmental regulation considerations. Obtaining the applicable permission from such third-party owners will be the responsibility of the requestor. Transgenic materials reported in this paper would only be made available if in full accordance with all applicable governmental regulations. Most of the research materials described herein have been destroyed and no longer exist per our material retention policies.
Figures
Similar articles
-
DP202216 maize hybrids shift upper limit of C and N partitioning to grain.Front Plant Sci. 2025 Mar 12;16:1459126. doi: 10.3389/fpls.2025.1459126. eCollection 2025. Front Plant Sci. 2025. PMID: 40144755 Free PMC article.
-
Evaluation of the History of Safe Use of the Maize ZMM28 Protein.J Agric Food Chem. 2019 Jul 3;67(26):7466-7474. doi: 10.1021/acs.jafc.9b00391. Epub 2019 Jun 25. J Agric Food Chem. 2019. PMID: 31184886
-
Hypothesis-based food, feed, and environmental safety assessment of GM crops: A case study using maize event DP-202216-6.GM Crops Food. 2021 Jan 2;12(1):282-291. doi: 10.1080/21645698.2020.1869492. GM Crops Food. 2021. PMID: 33472515 Free PMC article. Review.
-
Composition of forage and grain from genetically modified DP202216 maize is equivalent to non-modified conventional maize (Zea mays L.).GM Crops Food. 2019;10(2):77-89. doi: 10.1080/21645698.2019.1609849. Epub 2019 May 16. GM Crops Food. 2019. PMID: 31094289 Free PMC article.
-
An approach to the genetics of nitrogen use efficiency in maize.J Exp Bot. 2004 Feb;55(396):295-306. doi: 10.1093/jxb/erh006. J Exp Bot. 2004. PMID: 14739258 Review.
Cited by
-
The recent genetic modification techniques for improve soil conservation, nutrient uptake and utilization.GM Crops Food. 2024 Dec 31;15(1):233-247. doi: 10.1080/21645698.2024.2377408. Epub 2024 Jul 15. GM Crops Food. 2024. PMID: 39008437 Free PMC article. Review.
-
Seven plant capacities to adapt to abiotic stress.J Exp Bot. 2023 Aug 17;74(15):4308-4323. doi: 10.1093/jxb/erad179. J Exp Bot. 2023. PMID: 37220077 Free PMC article. Review.
-
DP202216 maize hybrids shift upper limit of C and N partitioning to grain.Front Plant Sci. 2025 Mar 12;16:1459126. doi: 10.3389/fpls.2025.1459126. eCollection 2025. Front Plant Sci. 2025. PMID: 40144755 Free PMC article.
References
-
- Nelson, G. C. et al. Food Security, Farming, and Climate Change to 2050: Scenarios, Results, Policy Options. (International Food Policy Research Institute, 2010).
-
- Vermeulen SJ, Campbell BM, Ingram JSI. Climate change and food systems. Annu. Rev. Environ. Resour. 2012;37:195–222. doi: 10.1146/annurev-environ-020411-130608. - DOI
-
- Stewart WM, Roberts TL. Food security and the role of fertilizer in supporting it. Procedia Eng. 2012;46:76–82. doi: 10.1016/j.proeng.2012.09.448. - DOI
-
- FAO. Food and Agriculture Organization of the United Nations. FAOSTAT Statistical Database. www.fao.org/faostat (2021).
-
- USDA Economic Research Service. Fertilizer Use and Price. Economic Research Service, Department of Agriculture. https://data.nal.usda.gov/dataset/fertilizer-use-and-price (2021).
Publication types
MeSH terms
Substances
LinkOut - more resources
Full Text Sources
