. 2022 Jun 7;13(1):3145.
doi: 10.1038/s41467-022-30960-x.

Dynamic nucleosome landscape elicits a noncanonical GATA2 pioneer model

Affiliations

Dynamic nucleosome landscape elicits a noncanonical GATA2 pioneer model

Tianbao Li et al. Nat Commun. .

Abstract

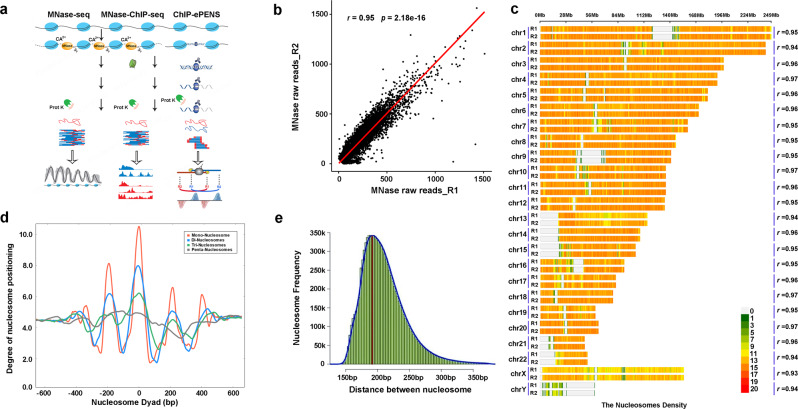
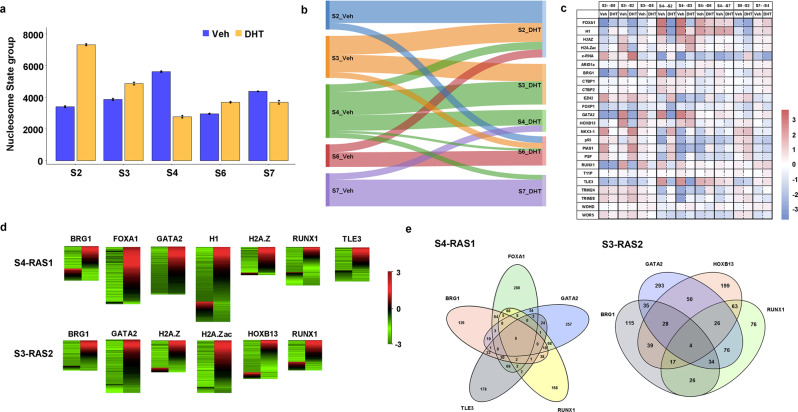
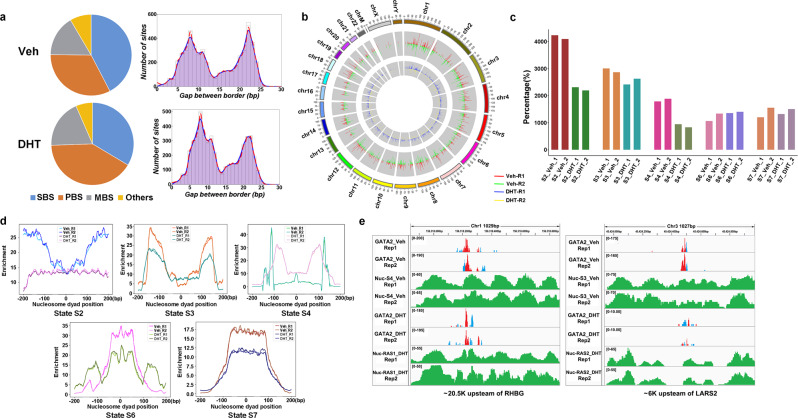
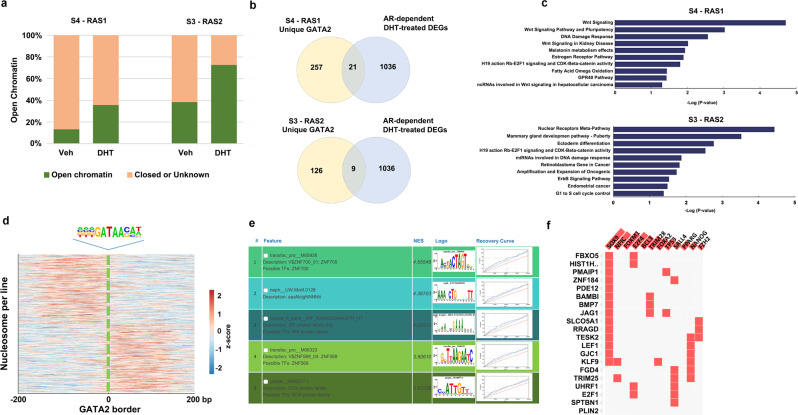
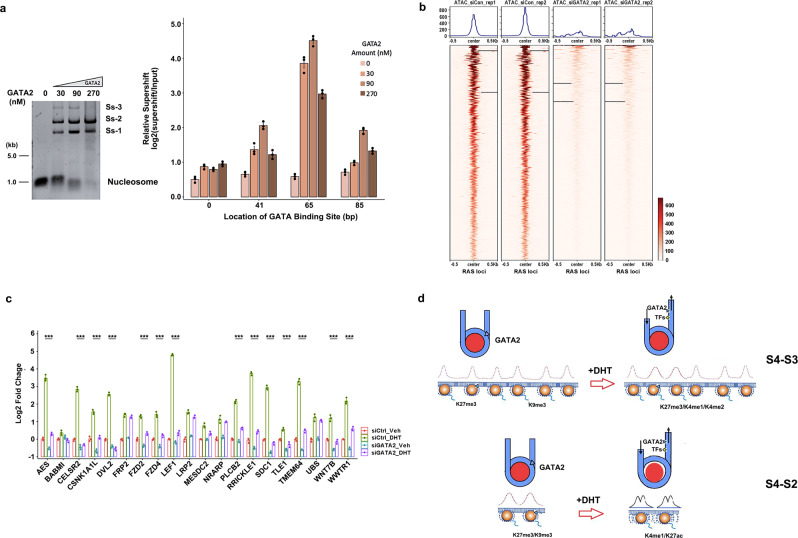
Knowledge gaps remain on how nucleosome organization and dynamic reorganization are governed by specific pioneer factors in a genome-wide manner. In this study, we generate over three billons of multi-omics sequencing data to exploit dynamic nucleosome landscape governed by pioneer factors (PFs), FOXA1 and GATA2. We quantitatively define nine functional nucleosome states each with specific characteristic nucleosome footprints in LNCaP prostate cancer cells. Interestingly, we observe dynamic switches among nucleosome states upon androgen stimulation, accompanied by distinct differential (gained or lost) binding of FOXA1, GATA2, H1 as well as many other coregulators. Intriguingly, we reveal a noncanonical pioneer model of GATA2 that it initially functions as a PF binding at the edge of a nucleosome in an inaccessible crowding array. Upon androgen stimulation, GATA2 re-configures an inaccessible to accessible nucleosome state and subsequently acts as a master transcription factor either directly or recruits signaling specific transcription factors to enhance WNT signaling in an androgen receptor (AR)-independent manner. Our data elicit a pioneer and master dual role of GATA2 in mediating nucleosome dynamics and enhancing downstream signaling pathways. Our work offers structural and mechanistic insight into the dynamics of pioneer factors governing nucleosome reorganization.


Conflict of interest statement

The authors declare no competing interests.

Figures

Fig. 1
Fig. 1. Identification of nucleosome positioning and spacing with MNase-seq.
a A scheme for generating multi-omics sequencing data including MNase-seq, MNase-ChIP-seq, and ChIP-exo for detecting nucleosome footprints. b A Pearson correlation of raw read counts within a bin size of 200 bp between two MNase-seq biological replicates in LNCaP cells showing a high coefficient value at 0.95 and two-tailed p value of 2.18e-16, illustrated by a representative chromosome 10. c Nucleosome density distribution between two replicates within a range of 5 Kb in each of 23 chromosomes. d Accumulation of nucleosome dyad according to the Mono, Di-, Tri-, and Penta-nucleosomes. Each nucleosome dyad was set as 0 bp and MNasse-seq reads in 600 bp upstream and downstream of each nucleosome dyad were used for plotting the accumulation. e The frequency distribution of the distance between adjacent nucleosomes dyad under 400 bp and an overall nucleosome spacing with a peak of 187 bp.
Fig. 2
Fig. 2. Quantitatively defining functional nucleosome states.
a A distribution of Nucleosome (blue), H3K4me1 (pink), H3K4me2 (gray), H3K4me3 (orange), H3K27ac (green), H3K36me3 (light gray), H3K79me2 (purple), H3K9me3 (yellow), H3K27me3 (cyan) in three genomic regions, Promoter (−1 Kb ~1 Kb of transcriptional start site), Proximal (−5 Kb ~1 Kb), Distal (−50 Kb ~ −5 Kb) and each line showed an average for biological replicates. b MNase-seq read signal distribution heatmap of histone marks in different genomic regions showing the characteristic spacing and regularity between nucleosomes. c A plot of enrichment curve showing histone mark and genomic region specifically nucleosome spacing pattern. d The density of histone mark-enriched nucleosomes, i.e., No. of nucleosomes per 1000 bp, in three regions and the shadowed bars mean a lower detection of a specific mark in this region. Each bar represents the mean value with the standard deviation as error bars. e Quantitative definition of functional nucleosome states. f The visualization for functional nucleosome states, S1–4.
Fig. 3
Fig. 3. Dynamic nucleosome states switching from Veh to DHT-treated conditions.
a A histogram showing the number of nucleosomes in S2, S3, S4, S6, and S7 in Veh and DHT-treated LNCaP cells, respectively. b Nucleosome states switch in the same genomic region comparing Veh and DHT-treated conditions. c Differential binding of FOXA1, GATA2, H1, other TFs, and coregulators in a specific nucleosome state in Veh and DHT-treated conditions. d Differential gene expression for those genes associated with S4-RAS1 (relatively accessible states 1) and S3-RAS2 (relatively accessible states 2) switching accompanying differential binding of the enriched factors. e Overlapping genes of the enriched TFs associated with switched states of S3 and S4 to RASs.
Fig. 4
Fig. 4. GATA2-associated functional nucleosome states in Veh and DHT-treated conditions.
a Identification of GATA2 borders and a distribution of gaps between borders showing a bimodal pattern for each of two biological replicates. b GATA2 border distribution within different chromosomes in the conditions of Veh and DHT treatment. c The number of GATA2 borders located on nucleosomes and distributed on different nucleosome states for each of two replicates. d An enrichment plot of GATA2 borders in different nucleosome states for each of two replicates. e Two screenshots showing the changes of GATA2 borders along with nucleosome states switching.
Fig. 5
Fig. 5. GATA2 governing nucleosome states switching from Veh to DHT-treated conditions.
a Open chromatin was detected by ATAC-seq for GATA2 binding sites associated with nucleosome states switching in Veh and DHT-treated conditions respectively. b Overlapping between GATA2-associated nucleosome state switching genes and AR-regulated differentially expressed genes in DHT-treated condition. Differentially expressed genes were detected with p value <0.05 and | log2(Fold Change)| > 1. c KEGG pathway analyses showing the top pathways in S4-RAS1 and S3-RAS2 respectively. d The location of the GATA2 motif between ChIP-exo borders relative to the density map of MNase-seq reads for positioned nucleosomes. e The prediction of regulatory features and modules by i-cisTarget illustrating several top enriched TF motifs in unique GATA2-associated nucleosome state switching genes. f SOX9 is the most enriched co-binding TF on WNT signaling genes identified by a publicly available database that collected all ChIP-seq of TFs from ENCODE and ChEA.
Fig. 6
Fig. 6. Performing functional examinations on GATA2-mediated nucleosome states switching and GATA2-regulated Wnt/β-catenin signaling genes.
a Nucleosomes containing 16 different sequences were bound to increase amounts of GATA2 protein and separated by native PAGE. Nucleosomes with 30, 90, and 270 nM of GATA2 and the major supershift bands (Ss-1, Ss-2, Ss-3) were indicated and quantified by qPCR relative to the input nucleosomes. Experiments were repeated independently three times with similar results. Each bar represents the mean value with the standard deviation as error bars. b ATAC-seq reads density maps around GATA2-associated RAS loci within 0.5 Kb up/down-stream in siCtrl LNCaP cell line and siGATA2 subline. c RT-qPCR measurement on a set of 20 Wnt/β-catenin signaling genes in siGATA2 before and after DHT treatment. The center for the error bars represents the mean value and the error bars represent the standard deviation with three experiments with a “***” showing p < 0.001 (two-tailed Student’s t-test) between Veh and DHT groups for each gene loci. d A working model showing GATA2 initially binds at the edge of a nucleosome at a crowding array (S4) and reconfigures it to an accessible primed state (S3/S2) upon androgen (DHT) stimulation, subsequently directly regulates or recruits other TFs to coregulate Wnt/β-catenin signaling genes. Source data are provided as a Source Data file.

Similar articles

Cited by

References

    1. Jiang C, Pugh BF. Nucleosome positioning and gene regulation: advances through genomics. Nat. Rev. Genet. 2009;10:161–172. doi: 10.1038/nrg2522. - DOI - PMC - PubMed
    1. Zhou K, Gaullier G, Luger K. Nucleosome structure and dynamics are coming of age. Nat. Struct. Mol. Biol. 2019;26:3–13. doi: 10.1038/s41594-018-0166-x. - DOI - PMC - PubMed
    1. Struhl K, Segal E. Determinants of nucleosome positioning. Nat. Struct. Mol. Biol. 2013;20:267–273. doi: 10.1038/nsmb.2506. - DOI - PMC - PubMed
    1. Schones DE, et al. Dynamic regulation of nucleosome positioning in the human genome. Cell. 2008;132:887–898. doi: 10.1016/j.cell.2008.02.022. - DOI - PMC - PubMed
    1. Lieleg C, Krietenstein N, Walker M, Korber P. Nucleosome positioning in yeasts: methods, maps, and mechanisms. Chromosoma. 2015;124:131–151. doi: 10.1007/s00412-014-0501-x. - DOI - PubMed

Publication types