. 2022 Jun 7;9(1):275.
doi: 10.1038/s41597-022-01366-7.

The International Bathymetric Chart of the Southern Ocean Version 2

Affiliations

The International Bathymetric Chart of the Southern Ocean Version 2

Boris Dorschel et al. Sci Data. .

Abstract

The Southern Ocean surrounding Antarctica is a region that is key to a range of climatic and oceanographic processes with worldwide effects, and is characterised by high biological productivity and biodiversity. Since 2013, the International Bathymetric Chart of the Southern Ocean (IBCSO) has represented the most comprehensive compilation of bathymetry for the Southern Ocean south of 60°S. Recently, the IBCSO Project has combined its efforts with the Nippon Foundation - GEBCO Seabed 2030 Project supporting the goal of mapping the world's oceans by 2030. New datasets initiated a second version of IBCSO (IBCSO v2). This version extends to 50°S (covering approximately 2.4 times the area of seafloor of the previous version) including the gateways of the Antarctic Circumpolar Current and the Antarctic circumpolar frontal systems. Due to increased (multibeam) data coverage, IBCSO v2 significantly improves the overall representation of the Southern Ocean seafloor and resolves many submarine landforms in more detail. This makes IBCSO v2 the most authoritative seafloor map of the area south of 50°S.


Conflict of interest statement

The authors declare no competing interests.

Figures

Fig. 1
Fig. 1
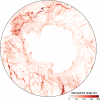
(a) Shaded relief of IBCSO v2 with ice surface topography. (b) Regional Identifier (RID) grid showing unique datasets (multicolours), topographic data (white), interpolated transition zone (black) and predicted bathymetry (dark grey). (c) Locations of example areas shown in Fig. 7.
Fig. 2
Fig. 2
Schematic overview of the SEAHORSE processing workflow comprising the Stages A–D. Ice surface elevation and sub-ice bathymetry from BedMachine, gap-filling with SRTM15+.
Fig. 3
Fig. 3
(a) Map showing the data type identifier (TID) of source data used for IBCSO v2. Various data types representing isolated soundings (TID: 10, 12, 13, 14) are grouped together and displayed as “singlebeam”. Data type “other” includes all TID greater than 14 (e.g. 71: unknown source) whereas “multibeam” only represents actual multibeam datasets (TID: 11). White dashed line represents the northernmost IBCSO v1 extent (60°S latitude). (b) Comparison of percent seafloor coverages by different data types for IBCSO v1 and v2 south of 60°S as well as current status of IBCSO v2 (south of 50°S).
Fig. 4
Fig. 4
Map showing the interquartile range for the final depth values of the grid. Estimation based on grids created from the 25% quartile and the 75% quartile of data as reported by GMT blockmedian.
Fig. 5
Fig. 5
Overall data coverage of IBCSO v2 indicated by coverage per tile (100 km × 100 km). (a) Data coverage of only high-quality multibeam datasets (weights ≥15, multibeam data, see Tables 1 and 2) with tiles featuring only low-quality data (weights <15) masked out in grey. (b) Data coverage based on all datasets.
Fig. 6
Fig. 6
Cell by cell difference between IBCSO v2 depths (x-axis) and reference grid depth differences (on y-axis). (a) IBCSO v1 as reference grid; (b) SRTM 15+ as reference grid. Blue lines indicate moving average with step size 100, orange lines indicate moving averages with step size 500. Grids were masked to contain only ocean cells and extents were adjusted in order to ascertain identical extents when comparing IBCSO v2 and the reference grid.
Fig. 7
Fig. 7
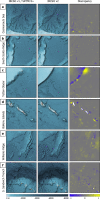
Comparison between IBCSO v1 and IBCSO v2 for: (a) Cosmonauts Sea, (b) South Scotia Ridge, (c) seaward of Totten Glacier and (d) Balleny Islands. Plots indicate (from left to right) IBCSO v1 chart, IBCSO v2 chart and calculated discrepancy between IBCSO v1 and IBCSO v2. Comparison between SRTM15+ and IBCSO v2 for: (e) Williams Ridge (Kerguelen Plateau) and (f) South Sandwich Trench and Islands. Plots indicate (from left to right) SRTM15+ chart, IBCSO v2 chart and calculated discrepancy between SRTM15+ and IBCSO v2. Grids for comparison are masked to contain only ocean cells. Columns IBCSO v1 and IBCSO v2 show the seabed as depth-scaled colour layer shaded by multiplication with a slope-inclination layer and a synthetic light source (hillshade) with 10× vertical exaggeration.

References

    1. Cunningham, S. A., Alderson, S. G., King, B. A. & Brandon, M. A. Transport and variability of the Antarctic Circumpolar Current in Drake Passage. J. Geophys. Res. 108, 10.1029/2001JC001147 (2003).
    1. Landschützer P, et al. The reinvigoration of the Southern Ocean carbon sink. Science. 2015;349:1221–1224. doi: 10.1126/science.aab2620. - DOI - PubMed
    1. Frölicher TL, et al. Dominance of the Southern Ocean in Anthropogenic Carbon and Heat Uptake in CMIP5 Models. Journal of Climate. 2015;28:862–886. doi: 10.1175/JCLI-D-14-00117.1. - DOI
    1. Silvano A, et al. Recent recovery of Antarctic Bottom Water formation in the Ross Sea driven by climate anomalies. Nature Geoscience. 2020;13:780–786. doi: 10.1038/s41561-020-00655-3. - DOI
    1. Menezes VV, Macdonald AM, Schatzman C. Accelerated freshening of Antarctic Bottom Water over the last decade in the Southern Indian Ocean. Science Advances. 2017;3:e1601426. doi: 10.1126/sciadv.1601426. - DOI - PMC - PubMed

Publication types