. 2022 Jun 7;13(1):3156.
doi: 10.1038/s41467-022-30975-4.

Dietary restriction and the transcription factor clock delay eye aging to extend lifespan in Drosophila Melanogaster

Affiliations

Dietary restriction and the transcription factor clock delay eye aging to extend lifespan in Drosophila Melanogaster

Brian A Hodge et al. Nat Commun. .

Abstract

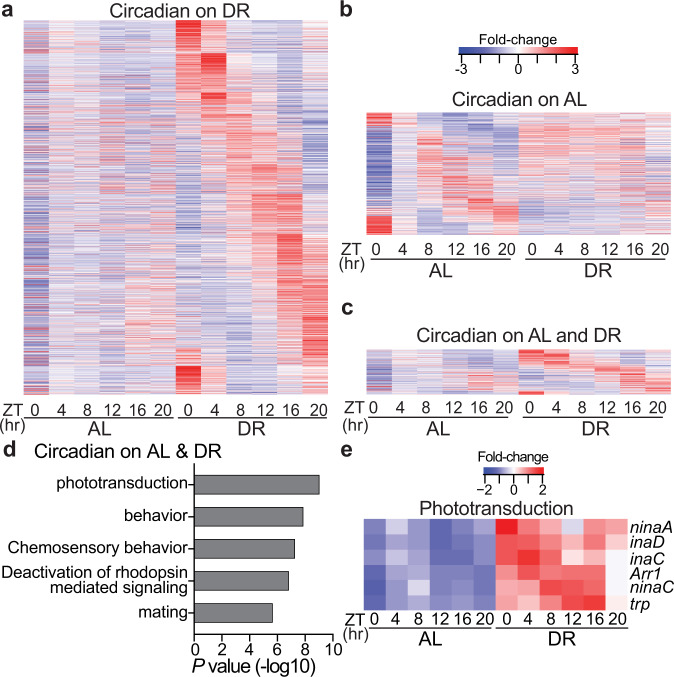
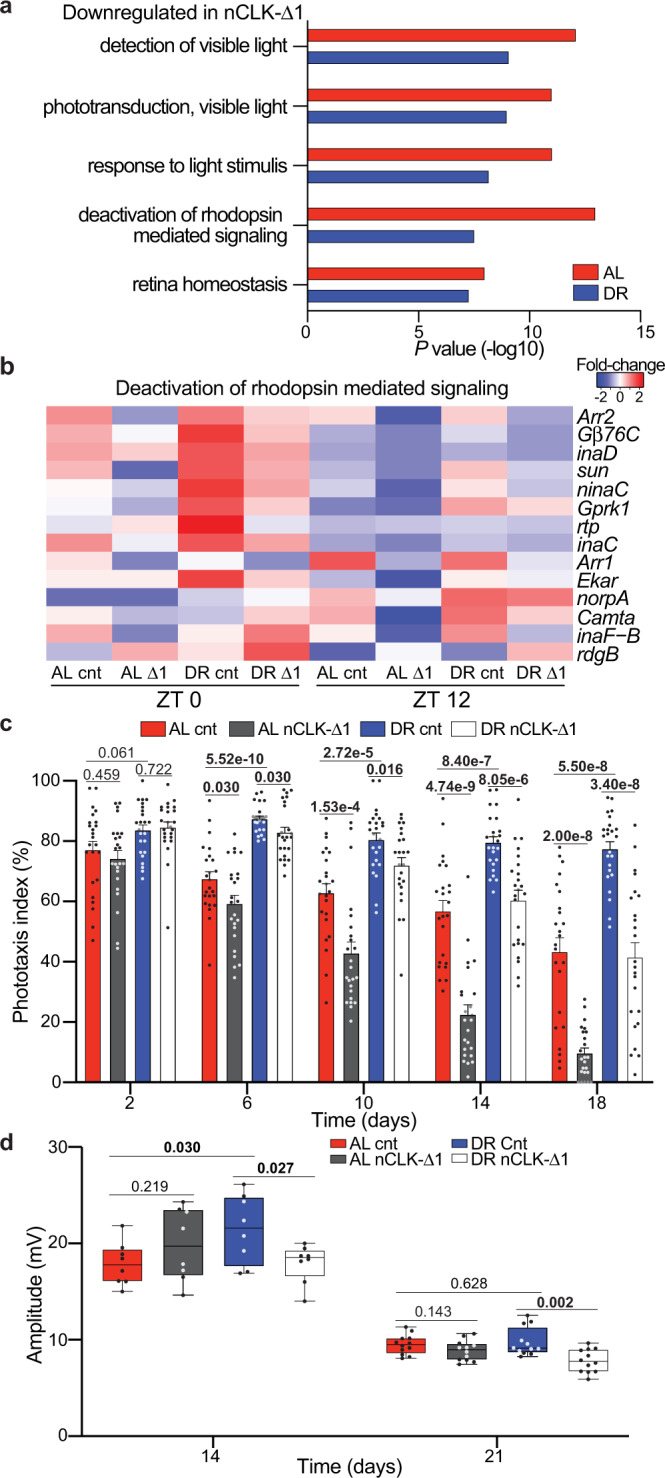
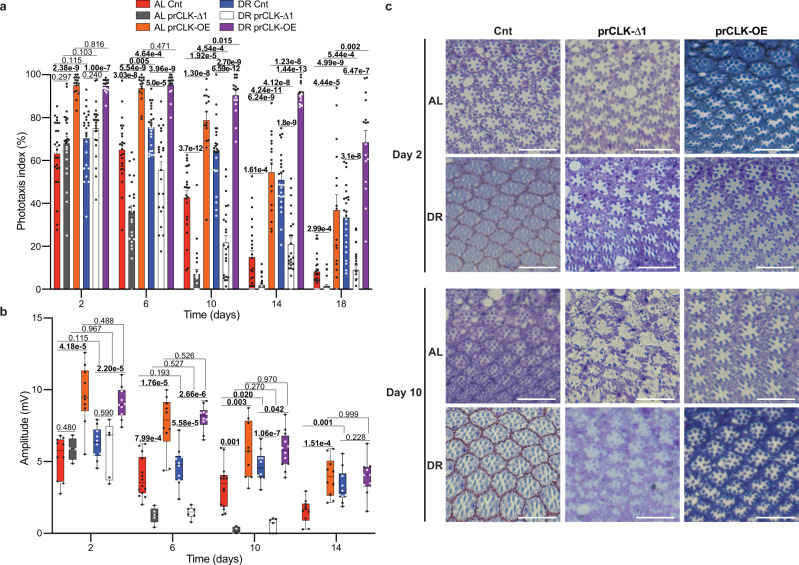
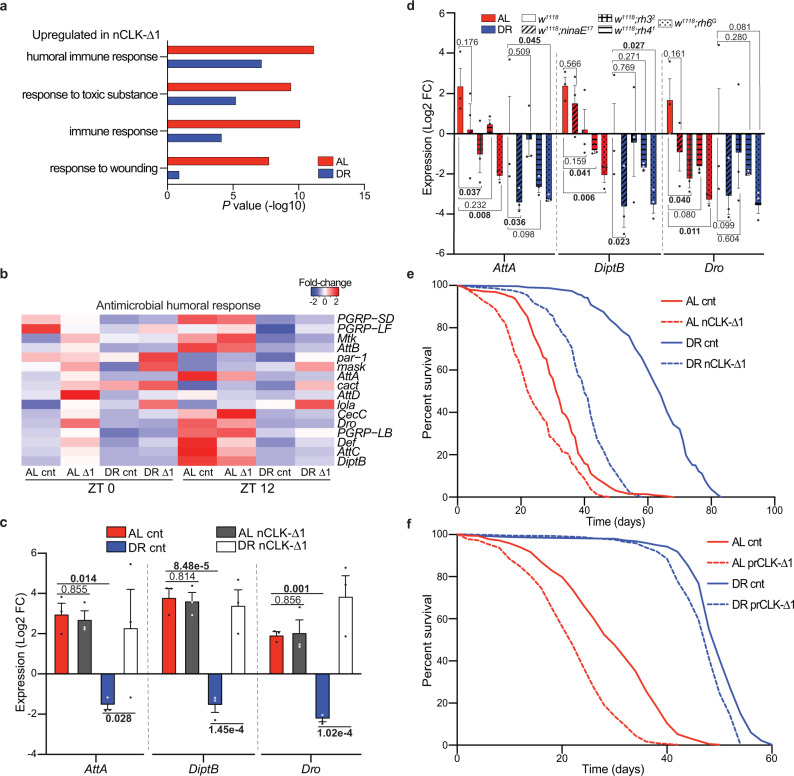
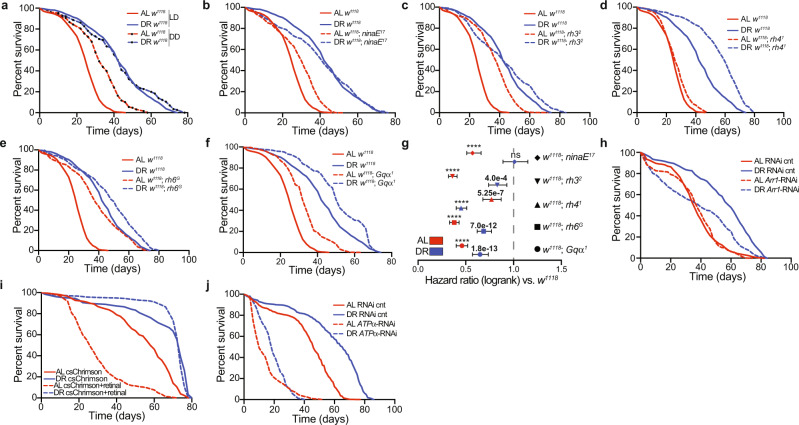
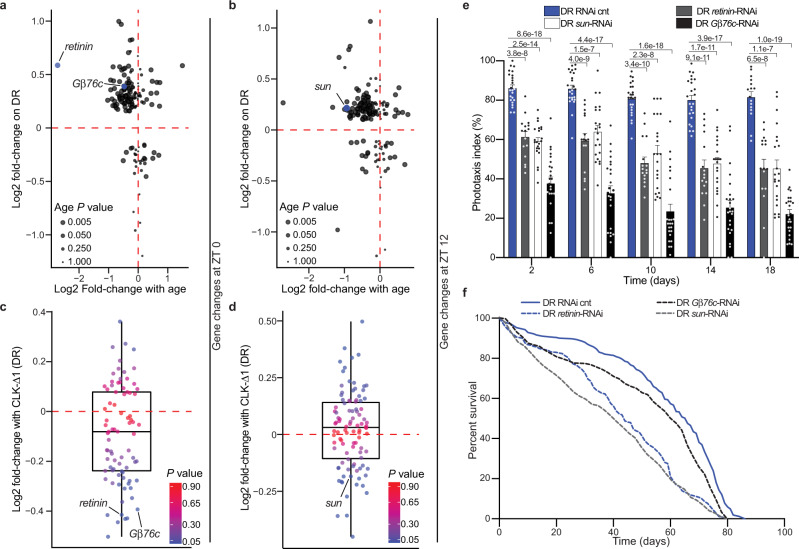
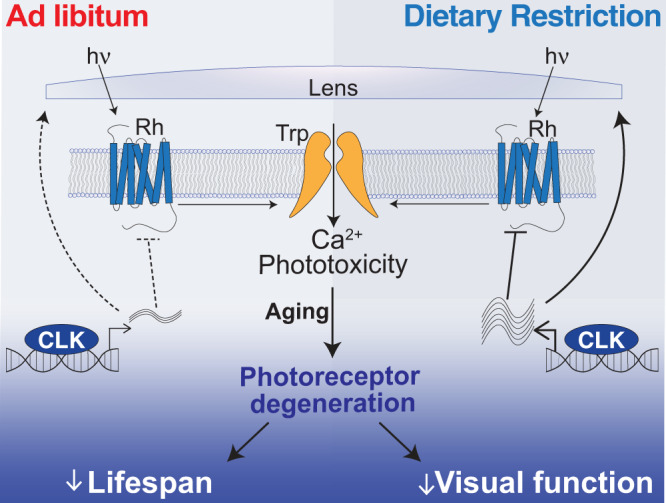
Many vital processes in the eye are under circadian regulation, and circadian dysfunction has emerged as a potential driver of eye aging. Dietary restriction is one of the most robust lifespan-extending therapies and amplifies circadian rhythms with age. Herein, we demonstrate that dietary restriction extends lifespan in Drosophila melanogaster by promoting circadian homeostatic processes that protect the visual system from age- and light-associated damage. Altering the positive limb core molecular clock transcription factor, CLOCK, or CLOCK-output genes, accelerates visual senescence, induces a systemic immune response, and shortens lifespan. Flies subjected to dietary restriction are protected from the lifespan-shortening effects of photoreceptor activation. Inversely, photoreceptor inactivation, achieved via mutating rhodopsin or housing flies in constant darkness, primarily extends the lifespan of flies reared on a high-nutrient diet. Our findings establish the eye as a diet-sensitive modulator of lifespan and indicates that vision is an antagonistically pleiotropic process that contributes to organismal aging.


Conflict of interest statement

The authors declare no competing interests.

Figures

Fig. 1
Fig. 1. Dietary restriction amplifies circadian transcriptional output and rhythmicity of phototransduction genes.
ac Circadian transcriptome heatmaps for Canton-S flies representing 24 h expression plots for transcripts that cycle only on DR (a, n = 1487 transcripts), only on AL (b, n = 548 transcripts), or on both diets (c, n = 259 transcripts). Circadian transcripts plotted here are defined as having JTK_CYCLE P ≤ 0.05 (non-adjusted, non-rhythmic [P ≥ 0.05] in tim01 mutants) and are plotted by phase. d Gene-ontology enrichment categories corresponding to transcripts that cycle on both AL and DR diets. P-values were calculated with hypergeometric distribution (findGO.pl, HOMER) with no adjustment for multiple-hypothesis testing. e Heatmap of phototransduction transcript expression on AL and DR.
Fig. 2
Fig. 2. Dietary restriction delays visual senescence in a CLK-dependent manner.
a GO enrichment scores corresponding to downregulated light-response genes in heads from RNA-Seq of nCLK-Δ1 (Elav-GS-GAL4 > UAS-CLK-Δ1) vs controls. P-values were calculated with hypergeometric distribution (findGO.pl, HOMER) with no adjustment for multiple-hypothesis testing. b Heatmap of normalized RNA-Seq expression corresponding to the gene-ontology category “Deactivation of rhodopsin-mediated signaling” (GO:0016059) in nCLK-Δ1 and controls at zeitgeber times 0 and 12 (lights on and lights off, respectively). c Positive phototaxis responses for nCLK-Δ1 flies. For each timepoint results are represented as mean values of percent positive phototaxis ±SEM (n = 24 biologically independent cohorts of 20 flies examined over three independent experiments, N = 480 flies per condition). P-values were determined by two-tailed Student’s t-test (unpaired), comparing responses between diet and/or genotype at each timepoint. d Boxplots of electroretinogram amplitudes for nCLK-Δ1 flies and controls at day 14 and 21. Data are presented as Tukey multiple comparison of means: The horizontal line within each box is the median, the bottom and top of the box are lower and upper quartiles, and the whiskers are minimum and maximum values. (n = 8 and 12 biologically independent flies measured at day 14 and 21, respectively, examined over 1 independent experiment). P-values were determined by two-tailed Student’s t-test (unpaired), comparing responses between diet and/or genotype at each timepoint. Source data are provided as a Source Data file.
Fig. 3
Fig. 3. Photoreceptor clocks modulate visual function and degeneration with age.
a Positive phototaxis responses for prCLK-Δ1 flies (Trpl-GAL4; GAL80ts > UAS-CLK-Δ1), prCLK-OE (Trpl-GAL4; GAL80ts > UAS-Clk), and control flies (Trpl-GAL4; GAL80ts /+ ) reared at 30 °C. For each timepoint results are represented as mean values of percent positive phototaxis ±SEM (control and prCLK-Δ1: n = 24 biologically independent cohorts of 20 flies examined over three independent experiments, N = 480 flies per condition. prCLK-OE: n = 16 biologically independent cohorts of 20 flies examined over 2 independent experiments, N = 320 flies per condition). P-values were determined by two-tailed Student’s t-test (unpaired), comparing responses between diet and/or genotype at each timepoint. b Boxplots of electroretinogram amplitudes for prCLK-Δ1, prCLK-OE, and control flies reared at 30 °C. The sample sizes (n) corresponding to (b) can be found in the “Statistics and Reproducibility” section within the Methods. Data are presented as Tukey multiple comparison of means: The horizontal line within each box is the median, the bottom and top of the box are lower and upper quartiles, and the whiskers are minimum and maximum values. P-values were determined by two-tailed Student’s t-test (unpaired), comparing responses between diet and/or genotype at each timepoint. c Tangential sections through prCLK-Δ1, prCLK-OE, and control retinas at day 2 and day 10. R1-7 photoreceptors are apparent within each hexongonally shaped ommatidia. White bars in bottom right corners represents 10 microns. The number of biologically independent replicates for each group within this experiment are in the Statistics and Reproducibility section. Additional representative images are included with the source data file. Source data are provided as a Source Data file.
Fig. 4
Fig. 4. nCLK-Δ1 flies display elevated immune responses and shortened lifespan.
a GO enrichment scores corresponding to upregulated inflammatory genes in heads from RNA-Seq of nCLK-Δ1 vs controls. P-values were calculated with hypergeometric distribution (findGO.pl, HOMER) with no adjustment for multiple-hypothesis testing. b Heatmap of normalized RNA-seq expression corresponding to the gene-ontology category “Antimicrobial humoral responses” (GO:0019730) in nCLK-Δ1 and controls. c Relative expression of AMP genes (attA, diptB, and dro) calculated by RT-qPCR with mRNA isolated from nCLK-Δ1 bodies. Results are plotted as average Log2 fold-change in expression calculated by the ΔΔ-Ct method, normalized to DR vehicle-treated control samples, as well as the housekeeping gene rp49 ± SEM (n = 3 biologically independent cohorts of flies, N = 30 flies per cohort). P-values were determined by two-tailed Student’s t-test (unpaired), comparing Log2 fold-changes in expression. d Relative mRNA expression of immune genes (attaA, diptB, and dro) calculated by RT-qPCR with mRNA isolated from bodies of w1118 and rhodopsin mutant flies housed in 12:12 h LD. Results are plotted as average Log2 fold-change in expression calculated by the ΔΔ-Ct method normalized w1118 DR control samples as well as rp49 ± SEM (n = 3 biologically independent cohorts of flies, N = 30 flies per cohort). P-values were determined by two-tailed Student’s t-test (unpaired), comparing Log2 fold-changes in expression. e Kaplan–Meyer survival analysis of nCLK-Δ1 flies (Elav-GS-GAL4 > UAS-CLK-Δ1) reared at 25 °C. Survival data are plotted as an average of three independent lifespan repeats. Control flies (vehicle-treated): AL N = 575, DR N = 526; nCLK-Δ1 flies (RU486 treated): AL N = 570, DR N = 565. f Kaplan–Meyer survival analysis of prCLK-Δ1 flies (Trpl-GAL4; GAL80ts > UAS-CLK-Δ1) and control (Trpl-GAL4/+; GAL80ts/+), flies reared at 30 °C. Survival data are plotted as an average of three independent lifespan repeats. Control flies: AL N = 599, DR N = 501; prCLK-Δ1 flies: AL N = 513, DR N = 564. Source data are provided as a Source Data file.
Fig. 5
Fig. 5. Photoreceptor activation modulates lifespan in a diet-dependent fashion.
a Survival analysis of w1118 flies housed in 12:12 h LD or constant darkness (DD). Survival data are plotted as an average of three independent lifespan repeats. bf Survival analysis of w1118; ninaE17, w1118; rh32, w1118; rh41, w1118; rh6G, and w1118; Gqα1 mutants compared to w1118 control flies housed in 12:12 h LD. Survival data are plotted as an average of three independent lifespan repeats. *Survival curves for w1118 are re-plotted (bf) for visual comparison, and the w1118 and rhodopsin-null lifespans repeats were performed simultaneously. All mutant lines were outcrossed to w1118. g Hazard ratios for rhodopsin and Gq mutant flies compared to w1118 control flies (ratios < 1 indicate flies that are more likely to survive compared to w1118). The hazard ratio for each strain is plotted as the measure of centre and the error bars indicate the 95% confidence interval of the hazard ratios. P-values were determined by Log-rank (Mantel-Cox) test, ns denotes a non-significant P-value, **** indicates P ≤ 1.0e-15. h Survival analysis of eye-specific arr1-RNAi knockdown flies vs RNAi control flies. Survival data are plotted as an average of two independent lifespan repeats for arr1-RNAi and one independent lifespan replicate for RNAi-controls. i Survival analysis of retinal inducible, photoreceptor-specific optogenetic flies (Trpl-GAL4 > UAS-csChrimson [red-shifted]) supplemented with retinal or vehicle control and housed in 12:12 h red light:dark. Survival data are plotted as an average of two independent lifespan repeats. j Survival analysis of eye-specific ATPα RNAi knockdown flies vs RNAi control flies. Survival data are plotted as an average of three independent lifespan repeats. The total number of flies (N) corresponding to each lifespan in Fig. 5 can be found in the “Statistics and Reproducibility” section within the Methods. Source data are provided as a Source Data file.
Fig. 6
Fig. 6. Knockdown of DR-sensitive, eye-specific CLK-output genes reduces survival.
a, b Scatterplot of circadian, photoreceptor-enriched gene changes with age in wild-type heads (x-axis: 5- vs 55-day old flies) vs diet-dependent gene expression changes in heads from nCLK-Δ1 RNA-Seq control flies (y-axis: DR- vs AL-minus RU486) at ZT 0 (a) and ZT 12 (b). Age P-values (non-adjusted) were originally reported in ref. and were calculated with Cuffdiff comparing transcript expression at day 5 to day 55 in wild-type Canton-S heads. c, d Boxplots of the expression changes in nCLK-Δ1 heads (DR plus- vs DR minus-RU486) at ZT 0 (c) and ZT 12 (d) of genes that were downregulated with age and upregulated on DR (upper left quadrants of panels a, b). The horizontal line within each box is the median, the bottom and top of the box are lower and upper quartiles, and the whiskers are minimum and maximum values. P-values (non-adjusted) were calculated with DESeq2 comparing transcript expression between controls and nCLK-Δ1 flies reared on DR. e Positive phototaxis responses with eye-specific knockdown of Gβ76c (GMR-GAL4 > UAS-Gβ76c-RNAi), retinin (GMR-GAL4 > UAS-retinin-RNAi), and sun (GMR-GAL4 > UAS-sun-RNAi) compared to RNAi control flies (GMR-GAL4 > UAS-mCherry-RNAi) reared on DR. For each timepoint results are represented as mean values of phototaxis responses ±SEM (RNAi control n = 24 biologically independent cohorts of 20 flies examined over three independent experiments, N = 480 flies per condition; Gβ76c-RNAi n = 24 biologically independent cohorts of 20 flies examined over three independent experiments, N = 480 flies per condition; retinin RNAi n = 16 biologically independent cohorts of 20 flies examined over two independent experiments, N = 320 flies per condition; sun RNAi n = 24 biologically independent cohorts of 20 flies examined over three independent experiments, N = 480 flies per condition) P-values were determined by two-tailed Student’s t-test (unpaired) at each timepoint comparing the phototaxis index of RNAi control flies to Gβ76c-, retinin-, and sun-RNAi flies. f Survival analysis of eye-specific Gβ76c, retinin, sun, and RNAi knockdown flies compared to RNAi control flies reared on DR. Survival data are plotted as an average of three independent lifespan repeats for RNAi control, sun, and Gβ76c flies and two independent lifespan repeats for retinin RNAi knockdown flies. RNAi-cnt flies: N = 490; retinin-RNAi flies: N = 363; sun-RNAi flies: N = 468; Gβ76c-RNAi flies: N = 509. Source data are provided as a Source Data file.
Fig. 7
Fig. 7. Dietary restriction extends lifespan by promoting rhythmic homeostatic processes in the eye.
DR promotes CLK-output processes in the eye that suppress light/Ca2+-mediated phototoxicity to delay visual senescence and improve survival.

Similar articles

Cited by

References

    1. Rijo-Ferreira F, Takahashi JS. Genomics of circadian rhythms in health and disease. Genome Med. 2019;11:82. doi: 10.1186/s13073-019-0704-0. - DOI - PMC - PubMed
    1. Patke A, Young MW, Axelrod S. Molecular mechanisms and physiological importance of circadian rhythms. Nat. Rev. Mol. Cell Biol. 2020;21:67–84. doi: 10.1038/s41580-019-0179-2. - DOI - PubMed
    1. Rouyer F. Clock genes: from Drosophila to humans. Bull. Acad. Natl Med. 2015;199:1115–1131. - PubMed
    1. Ogueta M, Hardie RC, Stanewsky R. Non-canonical phototransduction mediates synchronization of the Drosophila melanogaster circadian clock and retinal light responses. Curr. Biol. 2018;28:1725–1735 e1723. doi: 10.1016/j.cub.2018.04.016. - DOI - PMC - PubMed
    1. Hall H, et al. Transcriptome profiling of aging Drosophila photoreceptors reveals gene expression trends that correlate with visual senescence. BMC Genomics. 2017;18:894. doi: 10.1186/s12864-017-4304-3. - DOI - PMC - PubMed

Publication types