. 2022 Jun 7;12(1):9411.
doi: 10.1038/s41598-022-13646-8.

Asynchronous division at 4-8-cell stage of preimplantation embryos affects live birth through ICM/TE differentiation

Affiliations

Asynchronous division at 4-8-cell stage of preimplantation embryos affects live birth through ICM/TE differentiation

Daisuke Mashiko et al. Sci Rep. .

Abstract

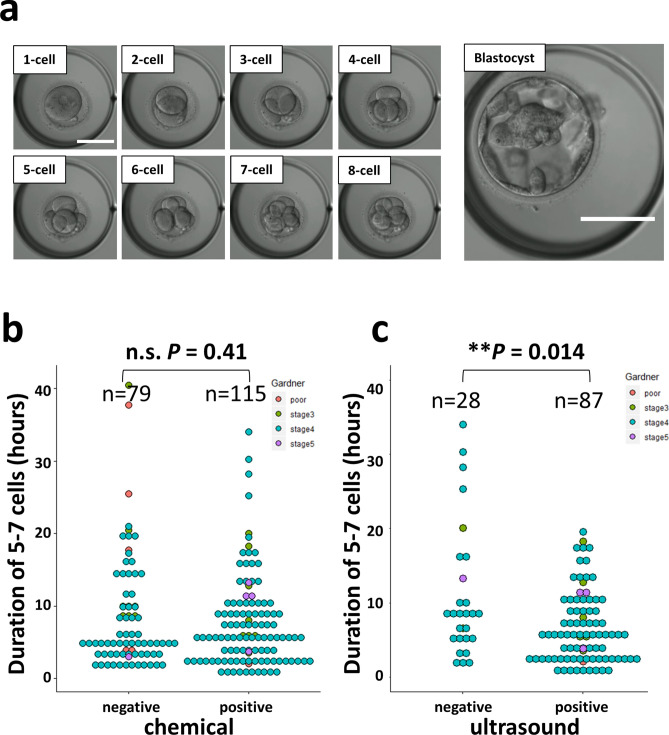
To improve the performance of assisted reproductive technology, it is necessary to find an indicator that can identify and select embryos that will be born or be aborted. We searched for indicators of embryo selection by comparing born/abort mouse embryos. We found that asynchronous embryos during the 4-8-cell stage were predisposed to be aborted. In asynchronous mouse embryos, the nuclear translocation of YAP1 in some blastomeres and compaction were delayed, and the number of ICMs was reduced. Hence, it is possible that asynchronous embryos have abnormal differentiation. When the synchrony of human embryos was observed, it was confirmed that embryos that did not reach clinical pregnancy had asynchrony as in mice. This could make synchrony a universal indicator common to all animal species.


Conflict of interest statement

The authors declare no competing interests.

Figures

Figure 1
Figure 1
Comparative strategies and schemes for identifying indicators that predict embryo prognosis. (a) The zygote injected with the fluorescent probe histone H2B-mCherry mRNA was observed up to the blastocyst stage. Each blastocyst was transplanted into one pseudopregnant mouse, and the comparison was made retrospectively based on the transplantation results. (b) We measured the number of nuclei, morphology, and motility using barycentric coordinates.
Figure 2
Figure 2
Comparison of cell number and time between born embryos and aborted embryos. (a) Comparison of averaged cell growth curves of born/abort embryos. *: significantly different. Data are represented as mean ± SD. We used 65 mouse zygotes for the retrospective study (we used 15 female and three male mice). (b) Schematic diagram of “Intra” stage duration and “Inter” stage duration. “Intra” stage denotes 2-, 4-, 8-, 16-, 32-cell stage duration, and Inter stage denotes 3-, 5–7-, 9–15-, 17–31-cell stage duration. When the cells were not dividing, shown in blue, the duration is the intra-stage duration. The time during which the cell was dividing, shown in red, represents the interstage duration. (c) Comparison of “intra” stage duration between born and abort embryos. (d) Comparison of “inter” stage duration between born and abort embryos.
Figure 3
Figure 3
Variations in third and fourth duration are correlated with early abortion. (a) Tree diagram of the duration of stages of embryos. The red delta represents the difference between the duration of the second duration of each blastomere. (b) Comparison of variations in second duration blastomeres. Normalization was performed by dividing by the average time of second duration of each blastomere. We transferred 65 mouse zygotes for the retrospective study (we used 15 female and three male mice). Born: n = 38 Abort: n = 27. (c) Comparison of variations in third duration blastomeres. Born: n = 38 Abort: n = 27. Normalization was performed by dividing by the average time of third duration of each blastomere. (d) Comparison of variations in fourth duration blastomeres. Normalization was performed by dividing by the average time of fourth duration of each blastomere. Born: n = 38 Abort: n = 27. (e) Correlation of variations of second, third, and fourth duration. Correlation coefficients, histograms, and scatter plots are shown.
Figure 4
Figure 4
Prospective analysis by embryo selection and embryo transfer of asynchronous/synchronous embryos. (a) Scheme diagram for embryo selection. (b) Graph of transplantation results after embryo selection. For the prospective study, 74 mouse zygotes (we used 15 female and three male mice) were transferred. Born: n = 23 Abort: n = 51.
Figure 5
Figure 5
Bright-field observation of human embryos reveals that the third division is related to early abortion. (a) Stills taken from movies of human embryos getting infertility treatment were retrospectively analyzed to calculate the time to the 8-cell stage. The embryos growing up to the blastocyst stage were observed and scored by Gardner classification. Bar = 100 µm. In this cohort, 194 human zygotes were analyzed. (b) Comparison of duration of 5–7 cells between positive (n = 115) and negative (n = 79) groups of chemical pregnancy tests. (c) Comparison of duration of 5–7 cells between ultrasound-positive (n = 87) and negative (n = 28) groups.
Figure 6
Figure 6
Relationships between synchrony and number of cells of ICM/TE. (a) Fluorescence images of H2B-mCherry-expressing, CDX immunostained, and OCT3/4 immunostained embryos. Bar = 100 µm For this analysis, 60 mouse zygotes (we used 15 female and three male mice) were observed. (b) Correlation between third CV and number of TE. (c) Correlation between third CV and number of ICM. (d) Correlation between third CV and TE/ICM ratio. (e) Correlation between third CV and total number of cells (TE + ICM).
Figure 7
Figure 7
Third division synchrony affects compaction and YAP1 localization. (a) Comparison of the state of compaction between an embryo showing a high CV and an embryo showing a low CV. Black arrowheads represent blastomeres that did not become flattened. Bar = 50 µm. (b) Relationship between not-all/all cells became flattened and low CV/high CV. For this analysis, 74 mouse zygotes (we used 15 female and three male mice) were observed. (c) Not-all/all flattened embryos immunostained with the anti-YAP1 antibody. Black and yellow arrowheads represent blastomeres that do not contribute to compaction. Bar = 50 µm. We used mouse 56 zygotes for immunostaining (we used five female and one male mice). (d) YAP1 localization by live-cell imaging using Yap1-EGFP mRNA. The upper left illustration shows the plasmid that we used. The upper right illustration shows the scheme of the experiments. The middle left panel shows the embryo with low CV at third division. Video is at 10 min intervals. Red frames show the durations in which the YAP1-EGFP signal was strongly seen in the nucleus. The middle right panel shows the embryo with high CV at third division. Yellow arrowheads indicate blastomeres that do not contribute to compaction at this point, and white arrowheads indicate blastomeres derived from blastomeres shown with yellow arrowheads, wherein Yap1-EGFP was localized to the nucleus. The bottom panels show an enlarged single-plane image. Bar = 50 µm. We used 49 zygotes for the observation of YAP1-EGFP (we used five female and one male mice).

References

    1. Boivin J, Bunting L, Collins JA, Nygren KG. International estimates of infertility prevalence and treatment-seeking: Potential need and demand for infertility medical care. Hum. Reprod. 2007;22:1506–1512. doi: 10.1093/humrep/dem046. - DOI - PubMed
    1. Mascarenhas MN, Flaxman SR, Boerma T, Vanderpoel S, Stevens GA. National, regional, and global trends in infertility prevalence since 1990: A systematic analysis of 277 health surveys. PLoS Med. 2012;9:e1001356. doi: 10.1371/journal.pmed.1001356. - DOI - PMC - PubMed
    1. Gerris J, et al. Prevention of twin pregnancy after in-vitro fertilization or intracytoplasmic sperm injection based on strict embryo criteria: A prospective randomized clinical trial. Hum. Reprod. 1999;14:2581–2587. doi: 10.1093/humrep/14.10.2581. - DOI - PubMed
    1. Gardner DK, Schoolcraft WB. In vitro culture of human blastocyst. In: Jansen R, Mortimer D, editors. Towards Reproductive Certainty: Infertility and Genetics Beyond. Carnforth: Parthenon Press; 1999. pp. 377–388.
    1. Gardner DK, Lane M, Stevens J, Schlenker T, Schoolcraft WB. Blastocyst score affects implantation and pregnancy outcome. Fertil. Steril. 2000;73:1155–1158. doi: 10.1016/S0015-0282(00)00518-5. - DOI - PubMed

Publication types