. 2022 Jun 7;5(1):553.
doi: 10.1038/s42003-022-03486-7.

Platelets from patients with visceral obesity promote colon cancer growth

Affiliations

Platelets from patients with visceral obesity promote colon cancer growth

Marica Cariello et al. Commun Biol. .

Abstract

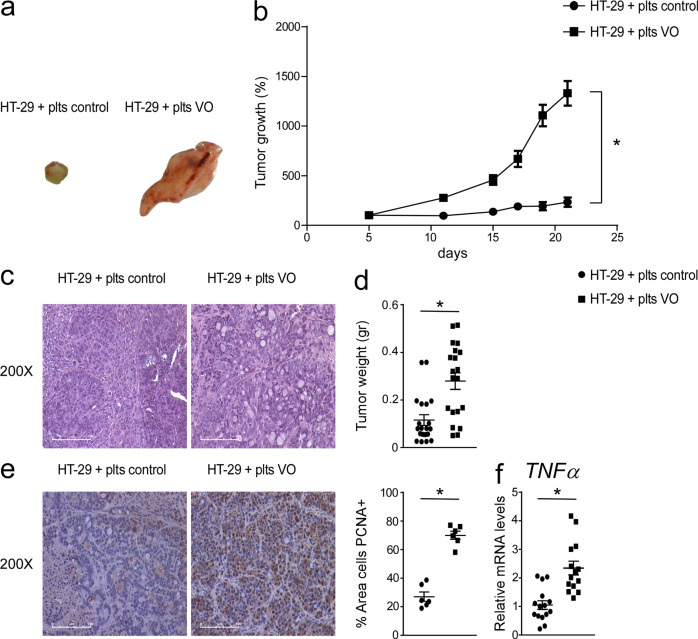
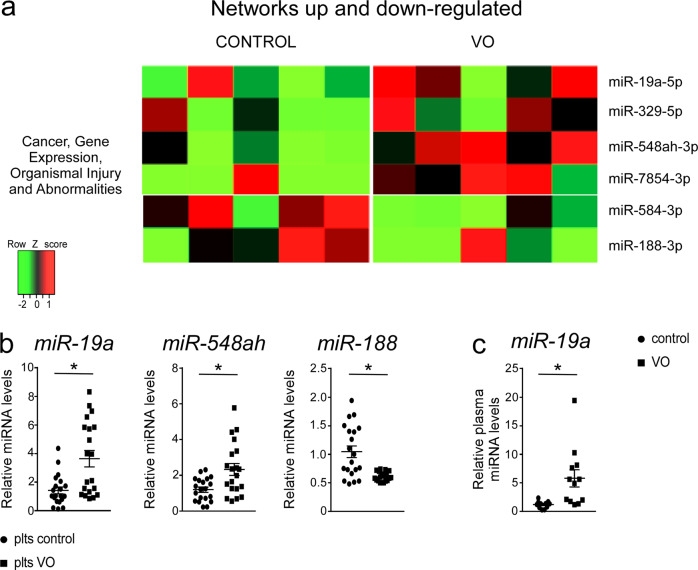
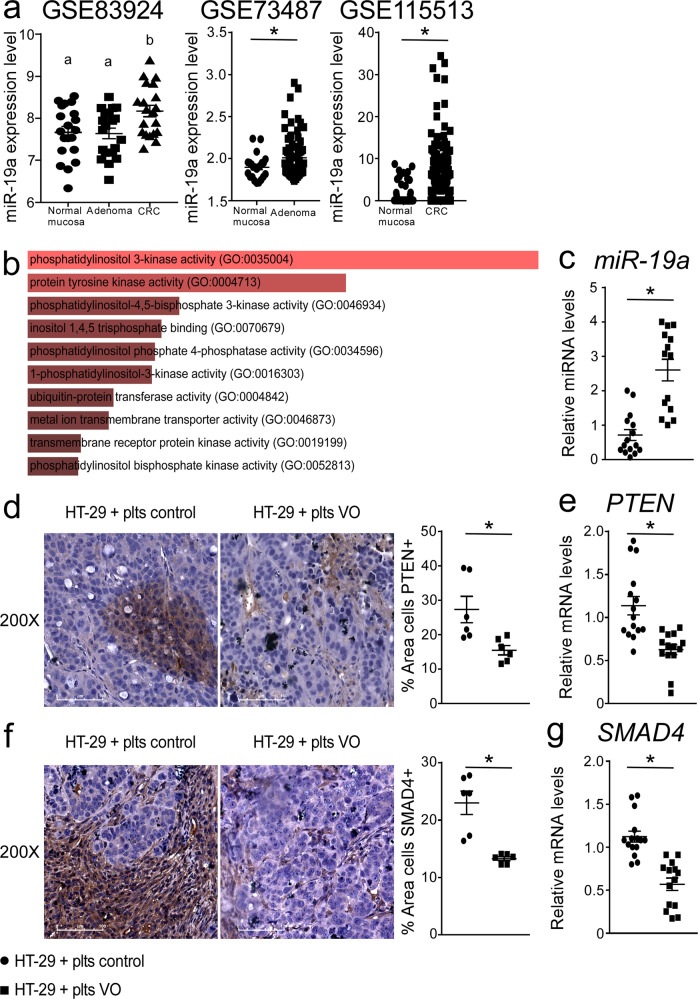
Several studies highlighted the importance of platelets in the tumor microenvironment due to their ability to interact with other cell types such as leukocytes, endothelial, stromal and cancer cells. Platelets can influence tumor development and metastasis formation through several processes consisting of the secretion of growth factors and cytokines and/or via direct interaction with cancer cells and endothelium. Patients with visceral obesity (VO) are susceptible to pro-thrombotic and pro-inflammatory states and to development of cancer, especially colon cancer. These findings provide us with the impetus to analyze the role of platelets isolated from VO patients in tumor growth and progression with the aim to explore a possible link between platelet activation, obesity and colon cancer. Here, using xenograft colon cancer models, we prove that platelets from patients with visceral obesity are able to strongly promote colon cancer growth. Then, sequencing platelet miRNome, we identify miR-19a as the highest expressed miRNA in obese subjects and prove that miR-19a is induced in colon cancer. Last, administration of miR-19a per se in the xenograft colon cancer model is able to promote colon cancer growth. We thus elect platelets with their specific miRNA abundance as important factors in the tumor promoting microenvironment of patients with visceral obesity.


Conflict of interest statement

The authors declare no competing interests.

Figures

Fig. 1
Fig. 1. Platelets isolated from visceral obesity (VO) patients increased tumor growth in xenograft tumor model.
a Athymic nu/nu mice were injected subcutaneously with HT29 cells and platelets isolated from VO patient and control were administered directly into the tumor mass every 7 days. Gross morphology of HT-29 cells treated with platelets isolated from VO patients and controls (n = 10 mice/group). The pictures were taken during the sacrifice with digital camera. b Tumor growth (%) curves showed high expansion of tumors injected with VO platelets (n = 20 tumors/group). c Histology was assessed by H&E staining and was observed by light microscopy (magnification, 200X). Representative specimens are shown. d Tumor weight (gr) was reported. e Paraffin-embedded tumor specimens from HT-29 cells inoculated with control platelets and HT-29 cells inoculated with VO platelets were immunoassayed with anti-PCNA antibody (200x magnification). Representative specimens are shown. PCNA staining per field was quantified by ImageJ software and displayed as percentage per field (n = 6 samples/group). f Gene expression analysis of TNFα in HT-29 cells inoculated with control platelets (n = 15) and HT-29 cells inoculated with VO platelets (n = 14). Cyclophilin was used as a housekeeping gene to normalize data. The results are shown as mean ± SEM in scatter plots. Statistical significance (P < 0.05) was assessed by student’s t test.
Fig. 2
Fig. 2. Identification of miRNome profile in platelets isolated from VO patients.
a miRNAs up and down-regulated in platelets isolated from VO patients and controls were profiled using sequencing, and clustered in networks displaying a coordinate biological function. Data are shown in a heatmap with a matrix format of the miRNA differentially modulated within the network; single rows represent miRNA expression in a single patient (column). Colors: red, expression greater than the mean; black, expression equal to the mean; green, expression smaller than the mean (n = 5 samples/group). b Relative miR-19a, miR-548ah and miR-188 expression from platelets of VO patients and controls (n = 20 samples/group). c Relative plasma miR-19a expression from VO patients and controls (n = 12 samples/group). The data were normalized on the geometric mean (best-keeper gene) of miR-374 and RNU6B, presented as relative expression values. All results are shown as means ± SEM in scatter plots. Statistical significance (P < 0.05) was assessed by student’s t test.
Fig. 3
Fig. 3. miR-19a upregulation in xenograft tumors treated with platelets isolated from VO patients.
a MiR-19a expression level in normal mucosa, adenoma and CRC. Comparison of different groups was performed using One-way ANOVA followed by Tukey’s test for multiple comparison. The results are shown as mean ± SEM in scatter plots. Statistical significance of two groups was assessed by student’s t test. P value < 0.05 was considered significant. b MicroRNA target prediction and enrichment analysis of the predicted target genes. Genes targeted by miR-19a were predicted using TargetScan database. The gene set enrichment analysis was assessed using EnrichR. The bar graphs show the predicted mouse Kyoto Encyclopedia of Genes and Genomes (KEGG) pathways based on p– value ranking. c Relative miR-19a expression from HT-29 cells (xenograft tumor) treated with control platelets (n = 15) or VO platelets (n = 14). The data were normalized on the geometric mean (best-keeper gene) of miR-374 and RNU6B, presented as relative expression values. Paraffin-embedded tumor specimens from HT-29 cells inoculated with control platelets and HT-29 cells inoculated with VO platelets were immunoassayed with (d) anti-PTEN and (f) anti-SMAD4 antibody (200x magnification). Representative specimens are shown. PTEN and SMAD4 staining per field was quantified by ImageJ software and displayed as percentage per field (n = 6 samples/group). The results are shown as mean ± SEM. Statistical significance (P < 0.05) was assessed by student’s t test. Gene expression analysis of (e) PTEN and (g) SMAD4 in xenograft tumors treated with control platelets (n = 15) and xenograft tumors treated with VO platelets (n = 14). Cyclophilin was used as a housekeeping gene to normalize data. The results are shown as mean ± SEM in scatter plots. Statistical significance (P < 0.05) was assessed by student’s t test.
Fig. 4
Fig. 4. miR-19a increased tumor growth in xenograft tumor model.
a Athymic nu/nu mice were injected subcutaneously with HT29 cells and a single injection of 5*1010 GC/ml of AAV-EGFP (control) or AAV-miR-19a suspension were administered directly into the tumor mass. Gross morphology of HT-29 cells treated with AAV-miR19a and control (n = 10 mice/group). The pictures were taken during the sacrifice with digital camera. b Tumor growth (%) curves showed high expansion of tumors injected with AAV-miR-19a (n = 20 tumors/group). c Tumor weight (gr) was reported (n = 19 HT-29 cells treated with AAV-ctrl vs n = 20 HT-29 cells treated with AAV-miR-19a). d Histology was assessed by H&E staining and was observed by light microscopy (magnification, ×200). Representative specimens are shown. e Relative miR-19a expression from xenograft tumors treated with AAV-EGFP and AAV-miR-19a (n = 19 samples/group). The data were normalized on the geometric mean (best-keeper gene) of miR-374 and RNU6B, presented as relative expression values. Paraffin-embedded tumor specimens from HT-29 cells treated with AAV-EGFP and AAV-miR-19a were immunoassayed with (f) anti-PCNA, (g) anti-PTEN and (i) anti-SMAD4 antibody (×200 magnification). Representative specimens are shown. PCNA, PTEN and SMAD4 staining per field was quantified by ImageJ software and displayed as a percentage per field (n = 6 samples/group). Gene expression analysis of (h) PTEN and (j) SMAD4 in xenograft tumors treated with AAV-EGFP (control) or AAV-miR-19a (n = 19 samples/group). Cyclophilin was used as a housekeeping gene to normalize data. All results are shown as means ± SEM in scatter plots. Statistical significance (P < 0.05) was assessed by student’s t test.

References

    1. Davi G, Patrono C. Platelet activation and atherothrombosis. N. Engl. J. Med. 2007;357:2482–2494. doi: 10.1056/NEJMra071014. - DOI - PubMed
    1. Dovizio M, Alberti S, Guillem-Llobat P, Patrignani P. Role of platelets in inflammation and cancer: novel therapeutic strategies. Basic Clin. Pharm. Toxicol. 2014;114:118–127. doi: 10.1111/bcpt.12156. - DOI - PubMed
    1. Xu XR, et al. Platelets are versatile cells: new discoveries in hemostasis, thrombosis, immune responses, tumor metastasis and beyond. Crit. Rev. Clin. Lab Sci. 2016;53:409–430. doi: 10.1080/10408363.2016.1200008. - DOI - PubMed
    1. Barberio AM, et al. Central body fatness is a stronger predictor of cancer risk than overall body size. Nat. Commun. 2019;10:383. doi: 10.1038/s41467-018-08159-w. - DOI - PMC - PubMed
    1. Bosello O, Zamboni M. Visceral obesity and metabolic syndrome. Obes. Rev. 2000;1:47–56. doi: 10.1046/j.1467-789x.2000.00008.x. - DOI - PubMed

Publication types

MeSH terms