. 2022 May;15(5):908-926.
doi: 10.1038/s41385-022-00524-9. Epub 2022 Jun 7.

Gut-derived short-chain fatty acids modulate skin barrier integrity by promoting keratinocyte metabolism and differentiation

Affiliations

Gut-derived short-chain fatty acids modulate skin barrier integrity by promoting keratinocyte metabolism and differentiation

Aurélien Trompette et al. Mucosal Immunol. 2022 May.

Abstract

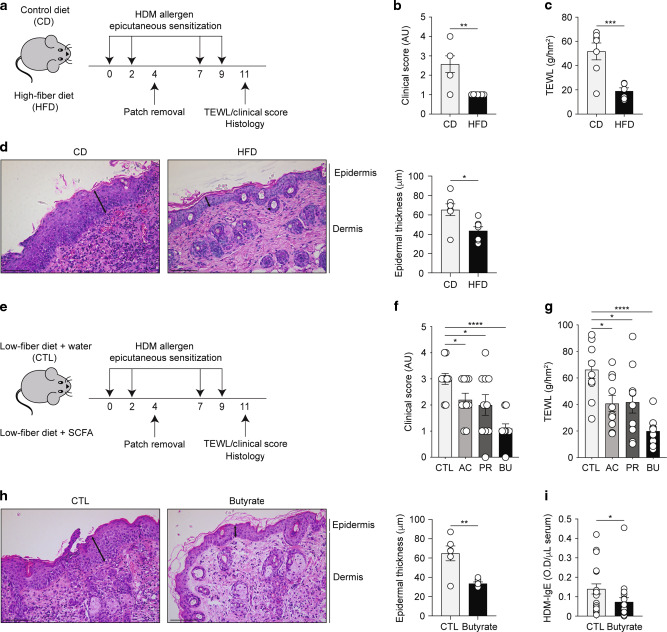
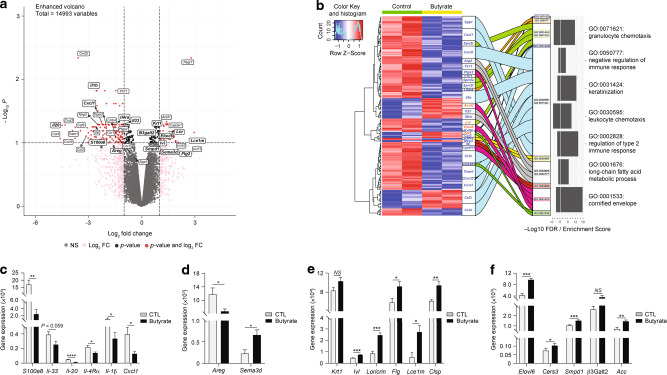
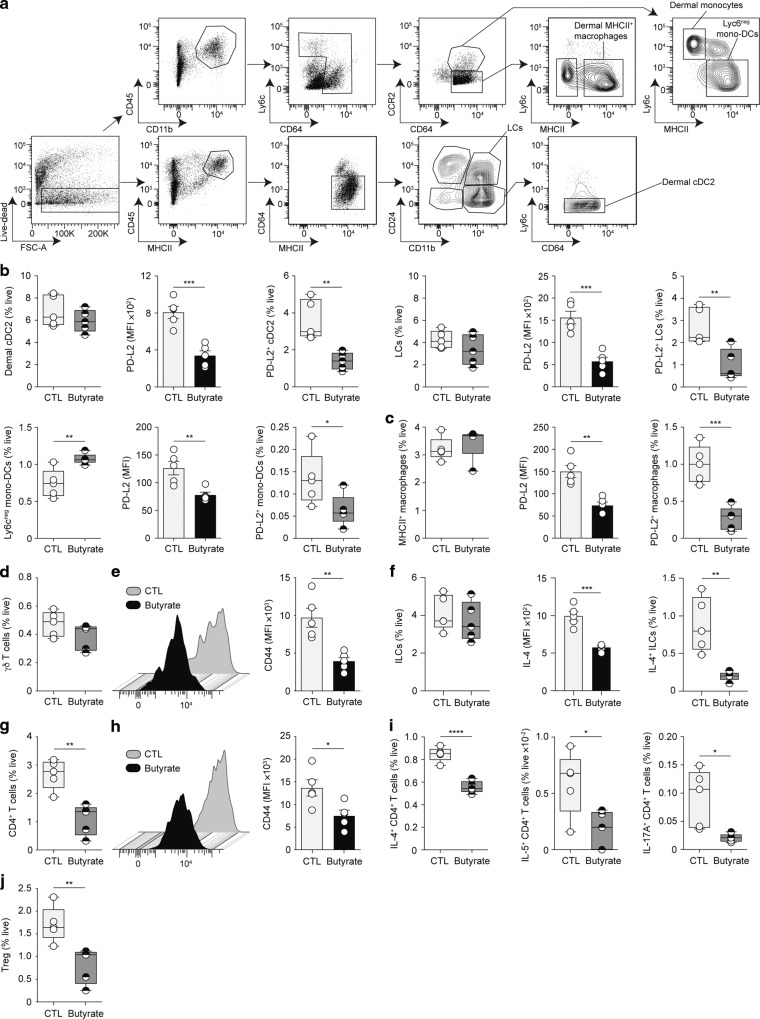
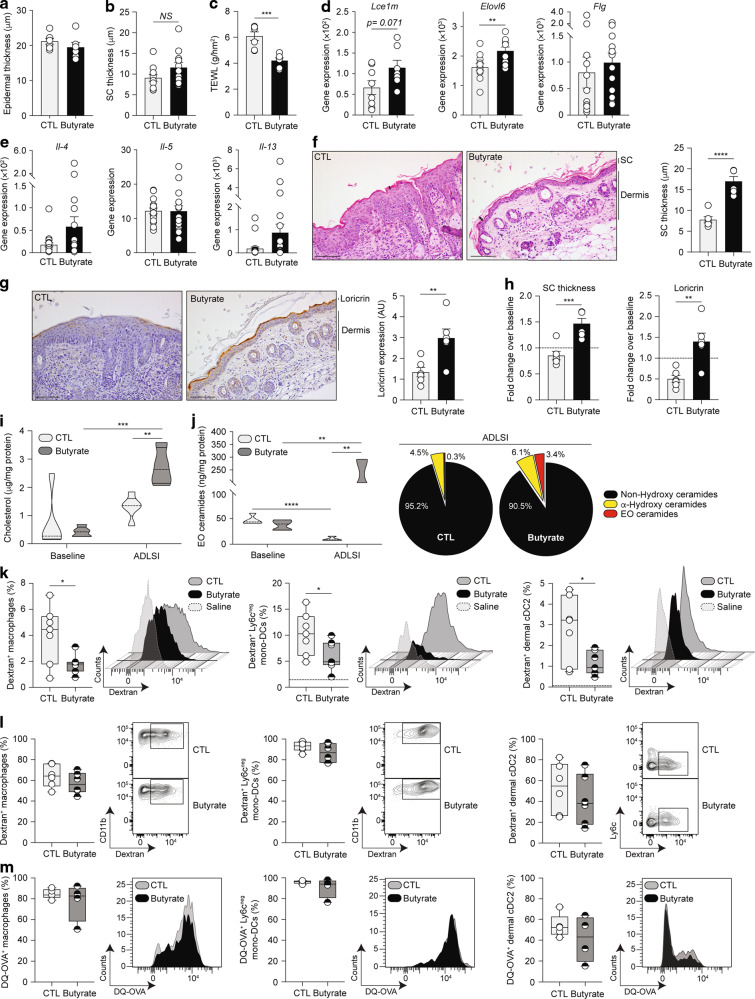
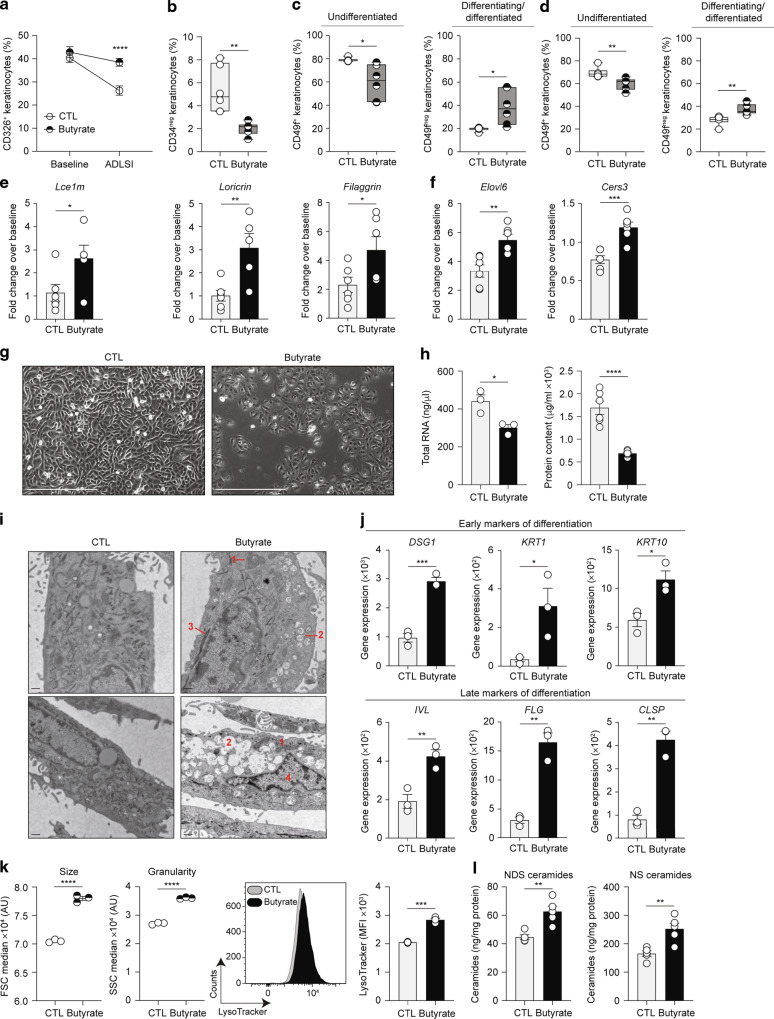
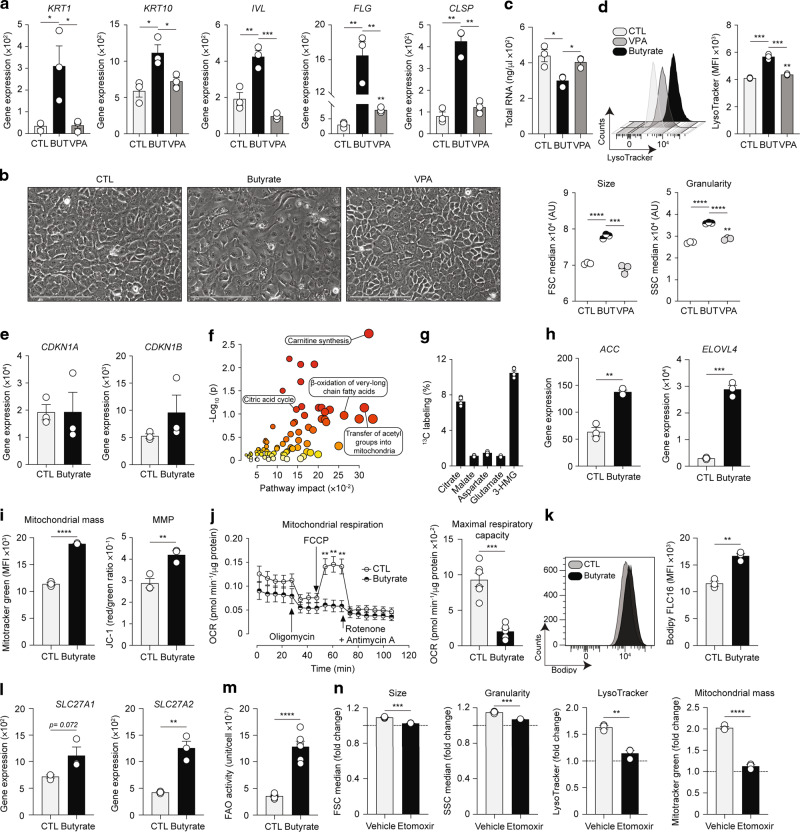
Barrier integrity is central to the maintenance of healthy immunological homeostasis. Impaired skin barrier function is linked with enhanced allergen sensitization and the development of diseases such as atopic dermatitis (AD), which can precede the development of other allergic disorders, for example, food allergies and asthma. Epidemiological evidence indicates that children suffering from allergies have lower levels of dietary fibre-derived short-chain fatty acids (SCFA). Using an experimental model of AD-like skin inflammation, we report that a fermentable fibre-rich diet alleviates systemic allergen sensitization and disease severity. The gut-skin axis underpins this phenomenon through SCFA production, particularly butyrate, which strengthens skin barrier function by altering mitochondrial metabolism of epidermal keratinocytes and the production of key structural components. Our results demonstrate that dietary fibre and SCFA improve epidermal barrier integrity, ultimately limiting early allergen sensitization and disease development.The Graphical Abstract was designed using Servier Medical Art images ( https://smart.servier.com ).


Conflict of interest statement

B.J.M. is part of the editorial board of Mucosal Immunology. All other authors have no disclosures.

Figures

Fig. 1
Fig. 1. Dietary fibre and SCFA protect against allergen-induced ADLSI and systemic allergen sensitization.
a Experimental model of skin barrier dysfunction and atopic dermatitis-like skin inflammation (ADLSI) using epicutaneous house dust mite (HDM) allergen sensitization (four times 15 μg HDM over 2 weeks) in control (cellulose; CD) or high-fibre diet (inulin; HFD) fed mice. b Disease severity assessment and c measurement of dorsal trans-epidermal water loss (TEWL) in CD or HFD-fed mice after 2 weeks of allergen sensitization. AU, arbitrary units. d Representative hematoxylin and eosin (H&E)-stained skin tissue from CD or HFD-fed mice after allergen exposure and quantification of epidermal thickness (distance from basal to upper granular layer, randomly measured 3 times per picture, 7–8 pictures per sample). Arrows represent representative sites for thickness measurement. Scale bars, 100 μm. e Experimental model of epicutaneous allergen sensitization in water control (CTL) or SCFA-treated mice. f Assessment of disease severity and g measurement of TEWL in CTL or SCFA-supplemented mice after allergen exposure. AC: Acetate, PR: Propionate, BU: Butyrate. h Representative H&E-stained skin tissue from CTL or butyrate-treated mice after allergen sensitization and quantification of epidermal thickness. Scale bars, 100 μm. i Levels of circulating HDM-specific IgE antibodies in serum at the end of the 2 weeks HDM epicutaneous sensitization model, as determined by ELISA. OD, optical density. Results are representative of data generated in three independent experiments in bd, from at least three independent experiments in h, pooled from two (f, g) or four (i) independent experiments. All results are expressed as mean ± SEM (n = 7 per group in bd; n = 10 per group in f, g; n = 6 per group in h; and n = 22 CTL and n = 20 butyrate in i). Statistical significance was determined with Student’s t-test (unpaired, two-tailed) in bd and fh, or Mann–Whitney test in i. *P = 0.05, **P = 0.01, ***P = 0.001, and ****P = 0.0001. See also Fig. S1.
Fig. 2
Fig. 2. Butyrate alters the skin transcriptome following allergen exposure.
a Volcano plot of differentially expressed genes (DEGs) after transcriptomics analysis of HDM allergen-sensitized skin from control or butyrate-treated mice (false detection rate (FDR) < 0.1; fold-change = 2). b Gene ontology (GO) analysis of lesional skin transcriptomics. Heatmap and alluvial plot of select DEGs (blue = decreased and red = increased in butyrate-treated mice) linked to GO IDs. Mirrored box plot indicates −log10 FDR on left and enrichment score on right for each GO ID. Gene expression analysis by quantitative RT-PCR of key genes involved in atopic dermatitis inflammation (c), itching pathway (d), keratinocyte differentiation and cornification (e), and lipid/ceramide synthesis and cornified lipid envelope formation (f) in skin from control (CTL) or butyrate-treated animals after 2 weeks HDM sensitization. Gene expression was normalized to β-actin. Results are representative of data from one experiment in a and b, and from three independent experiments in cf. All results are expressed as mean ± SEM (n = 2 per group in a, b; n = 6 per group in cf). Statistical significance was determined with Student’s t-test (unpaired, two-tailed) or Mann–Whitney test in cf. NS = non-significant, *P = 0.05, **P = 0.01, ***P = 0.001, and ****P = 0.0001.
Fig. 3
Fig. 3. Early cutaneous immune responses to HDM allergens are blunted in butyrate-treated animals.
a Gating strategy for flow cytometry analysis of the main antigen-presenting cells in the skin of control (CTL) or butyrate-supplemented mice. b Frequencies of main dendritic cell (DC) subsets (CD11b+ cDC2, Langherans cells (LCs), and Ly6cneg mono-DCs) and their surface expression of Th2 activation marker program death-ligand 2 (PD-L2) in the skin of CTL and butyrate-treated animals. MFI, mean fluorescence intensity. c Frequencies and PD-L2 expression (MFI) by the most prominent skin macrophage population. d, e Frequencies of skin γδT cells and their surface expression of activation marker CD44 (MFI) in CTL and butyrate-treated mice. f Frequencies of total and IL-4-producing innate lymphoid cells (ILCs) in the skin, and their expression of IL-4 (MFI). Frequencies of CD4+ T lymphocytes in the skin (g) and their surface expression of CD44 (MFI) (h), as well as frequencies of IL-4-, IL-5, and IL-17A-producing CD4+ T cells (i). j Frequencies of Foxp3+ T regulatory cells (Tregs) in the skin. Data were determined by flow cytometry after two topical HDM allergen sensitizations. Results are representative of data from two to three independent experiments in b, c, from two independent experiments in df and i, and from at least three independent experiments in g, h and j. All results are expressed as mean ± SEM (n = 5 per group in bh and j; n = 6 per group in I). Statistical significance was determined with Student’s t-test (unpaired, two-tailed) in bj, or Mann–Whitney test in b. *P = 0.05, **P = 0.01, ***P = 0.001, and ****P = 0.0001. See also Fig. S2.
Fig. 4
Fig. 4. Butyrate promotes skin barrier function.
a Quantification of baseline epidermal thickness in water control (CTL) or butyrate-treated mice before allergen sensitization. b Quantification of stratum corneum (SC) thickness following analysis of representative hematoxylin and eosin (H&E)-stained skin tissue before HDM allergen exposure. c Measurement of baseline dorsal transepidermal water loss (TEWL) in control or butyrate-treated mice before allergen exposure. d Expression of key components of the cornified envelope by fluorescence-activated cell sorting (FACS)-purified epidermal CD326+ keratinocytes isolated before allergen sensitization from CTL mice or butyrate-treated mice, as determined by quantitative RT-PCR. e Expression of TH2 cytokines in the skin at baseline, as determined by quantitative RT-PCR. Gene expression was normalized to β-actin in d and e. f Representative H&E-stained skin tissue from CTL or butyrate-treated mice after 2 weeks of HDM allergen exposure and corresponding quantification of stratum corneum (SC) thickness (randomly measured 3 times per picture, 7–8 pictures per sample). Arrows represent representative sites for SC thickness measurement. Scale bars, 100 μm. g Representative immunohistochemistry-stained skin tissue from CTL or butyrate-supplemented mice after 2 weeks of HDM allergen sensitization and corresponding quantification of loricrin expression (represented by a light-to-dark brown staining). Loricrin staining was measured in the entire picture, with 4 pictures per sample. Scale bars, 100 μm. h Fold-change (2 weeks HDM-sensitized over baseline) SC thickness and loricrin expression in the skin of CTL or butyrate-exposed animals. Dotted line represents an arbitrary value for baseline fold-change. i Absolute quantities of cholesterol in the skin of naive (“baseline”) and HDM allergen-sensitized (“ADLSI”) CTL and butyrate-treated mice, as determined by ultrahigh performance supercritical fluid chromatography coupled to quadrupole time-of-flight mass spectrometry with electrospray ionisation (UHPSFC/ESI-QTOF-MSE). j Distribution of the main classes of ceramides and absolute quantities of Ester-linked-Omega-hydroxy (EO) ceramides, as determined by ultrahigh performance liquid chromatography coupled to tandem mass spectrometry with electrospray ionisation (UPLC/ESI-MS/MS). k Frequencies and representative histograms of FITC-dextran-positive MHCII+ dermal macrophages, Ly6cneg mono-DC, and CD11b+ cDC2 in the skin of two-time HDM allergen-sensitized control (CTL) or butyrate-treated animals after one topical administration of 100 μg FITC-dextran (10 KDa). Saline = HDM-exposed skin without FITC dextran administration (saline-treated). Frequencies and representative histograms of FITC positive cells in the skin of two-time HDM allergen-sensitized CTL or butyrate-supplemented mice after one intradermal administration of 100 μg FITC-dextran (l) or 100 μg DQ-OVA (m). Results are representative of data from 3 independent experiments in a and C, pooled from 2 independent experiments in b, d, pooled from 4 independent experiments in e, from at least three independent experiments in fh, from one independent experiment in i, j, and from two independent experiments in km. All results are expressed as mean ± SEM (n = 7 CTL and n = 6 butyrate in a and c; n = 11 per group in b; n = 8/12 for CTL and n = 7/11 for butyrate in d; n = 16/23 for CTL and n = 15/23 for butyrate in e; n = 6 per group in fh and l; n = 5 CTL “baseline”, 5 CTL “ADLSI”, 5 butyrate “baseline”, and 4 butyrate “ADLSI” in i; n = 5 CTL “baseline”, 4 CTL “ADLSI”, 5 butyrate” baseline”, and 3 butyrate “ADLSI” in j; n = 7 per group in k; n = 5 CTL and 4 butyrate in m). Statistical significance was determined with Student’s t-test (unpaired, two-tailed) in am, or Mann–Whitney test in e and k. *P = 0.05, **P = 0.01, ***P = 0.001, and ****P = 0.0001.
Fig. 5
Fig. 5. Butyrate promotes terminal differentiation of epidermal keratinocytes.
a CD326+ keratinocytes in the skin of naive (“baseline”) and two-time house dust mite (HDM) allergen-sensitized (“ADLSI”) CTL and butyrate-exposed mice, as assessed by flow cytometry. b CD34+ hair bulge keratinocytes in HDM allergen-sensitized skin from water control (CTL) or butyrate-supplemented mice, as assessed by flow cytometry. CD49f+ basal CD326+ keratinocytes and CD49fneg differentiating/differentiated CD326+ keratinocytes in baseline (c) or two-time HDM allergen-sensitized (d) skin from CTL or butyrate-treated mice, as determined by flow cytometry. Fold-change expression over baseline of key components of the cornified envelope (e) or key enzymes for generation of long-chain fatty acids and ceramides (f) in fluorescence-activated cell sorting (FACS)-purified CD326+ CD34neg epidermal interfollicular keratinocytes isolated from two-time HDM allergen-sensitized control (CTL) or butyrate-treated mice, as determined by quantitative RT-PCR. Gene expression was normalized to β-actin. g Representative phase-contrast micrographs of primary human epidermal keratinocytes (HEK) either vehicle (CTL) or butyrate (500 μM)-supplemented for 48 h. Scale bars, 400 μm. h Total RNA and protein contents from HEK cultures. i Representative transmission electron microscopy micrographs of HEK cultures. Annotations: 1 = enlarged mitochondria; 2 = lysosomes; 3 = tonofibrils; 4 = degenerating nucleus. Scale bars, 500 nm. j Expression of skin barrier genes in HEK cultures, as determined by quantitative RT-PCR. Gene expression was normalized to β-ACTIN. k Median size (FSC, Forward scatter) and granularity (SSC, Side scatter) of HEK cultures, and assessment of the presence of acidic lysosome-like organelles by flow cytometry using LysoTracker probe. MFI, mean fluorescence intensity. l Quantification of ceramide production by HEK cultures, as determined by UPLC/ESI-MS/MS. Results are representative of data pooled from three (group “baseline”) and four (group “ADLSI”) independent experiments in a, from three independent experiments in b and d, from two independent experiments in c, e, and f, from at least three independent experiments in g, h, j, and k, and from one experiment in i and l. All results are expressed as mean ± SEM (n = 18 per group in “baseline” and n = 24 CTL and n = 23 Butyrate in “ADLSI” in a; n = 6 per group in be, and f; n = 3–6 per group in g, h, j, and k; n = 2 per group in i; n = 5 per group in l). Statistical significance was determined with Student’s t-test (unpaired, two-tailed) in af, h, and jl. *P = 0.05, **P = 0.01, ***P = 0.001, and ****P = 0.0001. See also Fig. S3.
Fig. 6
Fig. 6. Butyrate reprograms keratinocyte metabolism to induce mitochondria-dependent epidermal differentiation.
a Expression of skin barrier genes in HEK cultures either vehicle (CTL), 500 μM butyrate (BUT), or 500 μM valproate (VPA)-treated for 48 h, as determined by quantitative RT-PCR. b Representative phase-contrast micrographs of HEK cultures. Scale bars, 200 μm. c Total RNA quantification from HEK cultures. d Median size, granularity, and LysoTracker expression in HEK cultures, as determined by flow cytometry. MFI, mean fluorescence intensity. e Gene expression of CDKN1A and CDKN1B in HEK cultures, as determined by quantitative RT-PCR. f Pathway enrichment (based on the small molecule pathway database (SMPD)) and topology analyses of the multiple pathway targeted metabolomics data on FACS-isolated murine CD326+ keratinocytes highlighting several robustly altered metabolic pathways, as determined using MetaboAnalyst 5.0 software. g 13C enrichment in several intermediates and products of the citric acid cycle in HEK supplemented with 13C-butyrate for 24 h, as determined by Hydrophilic Interaction Liquid Chromatography coupled to high-resolution mass spectrometry. h Expression of malonyl-CoA-generating enzyme ACC and fatty acid elongation enzyme ELOVL4 in HEK cultures, as determined by quantitative RT-PCR. i Determination of mitochondrial mass and membrane potential (MMP) of HEK cultures, as assessed by flow cytometry using MitoTracker green and bivariate dye JC-1, respectively. j Mitochondrial respiration of CTL or butyrate-treated HEK for 48 h, as determined by oxygen consumption rate (OCR) Seahorse assays. FCCP, trifluoromethoxy carbonylcyanide phenylhydrazone. k Measurement of long-chain fatty acids (LCFA) uptake by HEK, as determined by flow cytometry using a synthetic fluorescent LCFA (Bodipy FLC16). l Expression of LCFA transporters and activators SLC27A1 and SLC27A2 in HEK cultures, as assessed by quantitative RT-PCR. m Quantification of fatty acid oxidation (FAO) activities in HEK cultures. n Effect of low-dose etomoxir (20 μM) on median size, granularity, lysosome contents, and mitochondrial mass in cultures, as determined by flow cytometry. Results are expressed as fold-change over CTL in the absence (“vehicle”) or presence of etomoxir. For data in a, e, h, and l, gene expression was normalized to β-ACTIN. Results are representative of data from two to three independent experiments in a, at least three independent experiments in b, d, h, k, and l, three independent experiments in c, i, j, m, and n, and from one experiment in fg. All results are expressed as mean ± SEM (n = 3 per group in ae, k, l, and n; n = 5 per group in fg; n = 6 per group in m; n = 6 for CTL and n = 5 for butyrate in j). Statistical significance was determined with Student’s t-test (unpaired, two-tailed). *P = 0.05, **P = 0.01, ***P = 0.001, and ****P = 0.0001. See also Fig. S4.

Similar articles

Cited by

References

    1. Platts-Mills TA. The allergy epidemics: 1870-2010. J. Allergy Clin. Immunol. 2015;136:3–13. doi: 10.1016/j.jaci.2015.03.048. - DOI - PMC - PubMed
    1. Asher MI, et al. Worldwide time trends in the prevalence of symptoms of asthma, allergic rhinoconjunctivitis, and eczema in childhood: ISAAC Phases One and Three repeat multicountry cross-sectional surveys. Lancet. 2006;368:733–743. doi: 10.1016/S0140-6736(06)69283-0. - DOI - PubMed
    1. Bach JF. The effect of infections on susceptibility to autoimmune and allergic diseases. N. Engl. J. Med. 2002;347:911–920. doi: 10.1056/NEJMra020100. - DOI - PubMed
    1. Grode L, et al. Prevalence, incidence, and autoimmune comorbidities of celiac disease: a nation-wide, population-based study in Denmark from 1977 to 2016. Eur. J. Gastroenterol. Hepatol. 2018;30:83–91. doi: 10.1097/MEG.0000000000000992. - DOI - PubMed
    1. Pawankar R. Allergic diseases and asthma: a global public health concern and a call to action. World Allergy Organ J. 2014;7:12. doi: 10.1186/1939-4551-7-12. - DOI - PMC - PubMed

Publication types