. 2023 Jan;13(1):252-274.
doi: 10.1007/s13346-022-01181-y. Epub 2022 Jun 7.

Ashwagandha-loaded nanocapsules improved the behavioral alterations, and blocked MAPK and induced Nrf2 signaling pathways in a hepatic encephalopathy rat model

Affiliations

Ashwagandha-loaded nanocapsules improved the behavioral alterations, and blocked MAPK and induced Nrf2 signaling pathways in a hepatic encephalopathy rat model

Heba M A Khalil et al. Drug Deliv Transl Res. 2023 Jan.

Abstract

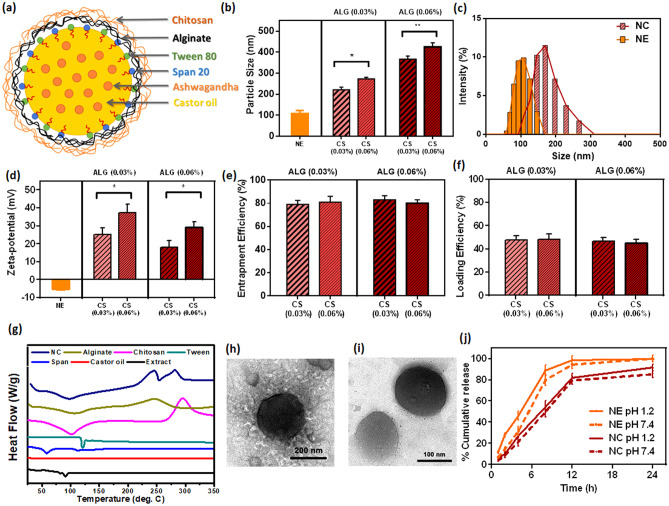
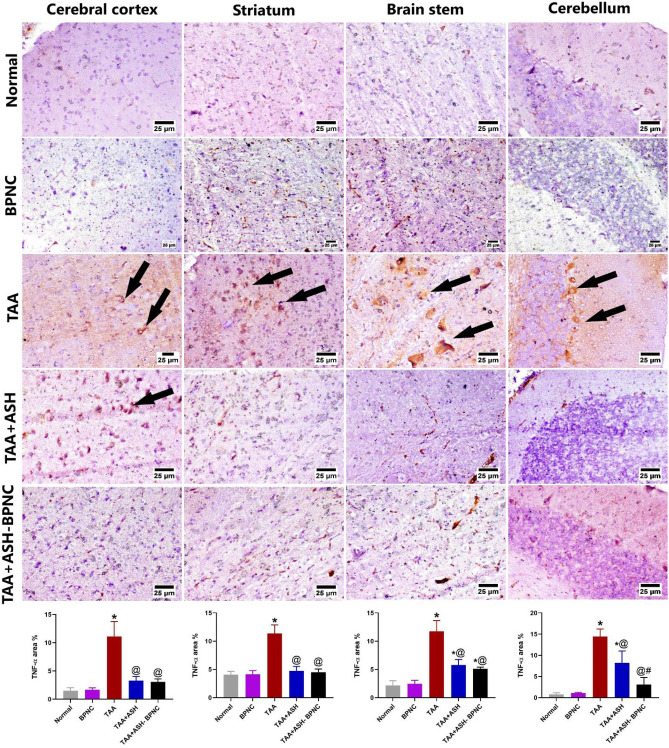
Ashwagandha (ASH), a vital herb in Ayurvedic medicine, demonstrated potent preclinical hepato- and neuroprotective effects. However, its efficacy is limited due to low oral bioavailability. Accordingly, we encapsulated ASH extract in chitosan-alginate bipolymeric nanocapsules (ASH-BPNCs) to enhance its physical stability and therapeutic effectiveness in the gastrointestinal tract. ASH-BPNC was prepared by emulsification followed by sonication. The NCs showed small particle size (< 220 nm), zeta-potential of 25.2 mV, relatively high entrapment efficiency (79%), physical stability at acidic and neutral pH, and in vitro release profile that extended over 48 h. ASH-BPNC was then investigated in a thioacetamide-induced hepatic encephalopathy (HE) rat model. Compared with free ASH, ASH-BPNC improved survival, neurological score, general motor activity, and cognitive task-performance. ASH-BPNC restored ALT, AST and ammonia serum levels, and maintained hepatic and brain architecture. ASH-BPNC also restored GSH, MDA, and glutathione synthetase levels, and Nrf2 and MAPK signaling pathways in liver and brain tissues. Moreover, ASH-BPNC downregulated hepatic NF-κB immunohistochemical expression. Moreover, the in vivo biodistribution studies demonstrated that most of the administered ASH-BPNC is accumulated in the brain and hepatic tissues. In conclusion, chitosan-alginate BPNCs enhanced the hepatoprotective and neuroprotective effects of ASH, thus providing a promising therapeutic approach for HE.

Keywords: Ashwagandha; Bipolymeric nanocapsules; Cognition; Hepatic encephalopathy; MAPK pathway; Nrf2 pathway.


Conflict of interest statement

The authors declare no competing interests.

Figures

Fig. 1
Fig. 1
Development of ASH-BPNC: A schematic illustration of NC structure with a NE core and bipolymeric shell (a), particle size of the developed NE and NC (b), histogram of the particle size distribution of NE and NC (c), zeta potential of NE and NC (d), entrapment efficiency (e), loading efficiency (f), DSC thermograms (g), representative TEM image of the selected NC (h) and NE (i), and drug dissolution profile of the selected NE and NC in neutral and acidic medium (j). Data are represented as mean ± SD (P < 0.05 and P < 0.01). ALG and CS refer to sodium alginate and chitosan, respectively
Fig. 2
Fig. 2
Effects of ASH-BPNC on survival, neurological scores, motor activity, and cognitive task performance in TAA-induced HE in rats. Percent survival (a), neurological score (b), number of crossings squares in open field (c), rearing frequency in open field (d), total exploration time in novel object recognition task (e), novel object preference percentage (f), and spontaneous alternation percentage in Y-maze (g). Data are represented as mean ± SD (P < 0.05),*significant from normal control; @significant from TAA-intoxicated group; #significant from TAA + ASH-treated group
Fig. 3
Fig. 3
Effects of ASH-BPNC on hepatotoxicity markers, serum ammonia levels, and glutamine synthetase (GS) in TAA-induced HE in rats. Serum levels of ALT (a), AST (b), ammonia (c), hepatic (d), and brain (e) levels of GS. Data are represented as mean ± SD (P < 0.05). *significant from normal control; @significant from TAA-intoxicated group; #significant from TAA + ASH-treated group
Fig. 4
Fig. 4
Effects of ASH-BPNC on hepatic histopathological alterations in TAA-induced HE in rats. Photomicrographs of hepatic sections stained with H&E (a) showing normal histology of hepatic parenchyma in normal and BPNC groups; TAA-intoxicated hepatic sections showing portal fibroplasia with mononuclear inflammatory cells infiltration (arrows) and extensive hepatocellular necrosis and hemorrhage; TAA-intoxicated hepatic sections treated with ASH showing apparently normal liver cells with few mononuclear inflammatory cells infiltration; TAA-intoxicated hepatic sections treated with ASH-BPNC showing apparently normal hepatocytes (upper panel); and a chart of liver histologic score (lower panel) with data represented as median (Max. and Min.) (P < 0.05). Photomicrographs of hepatic sections stained with MTC (b) showing TAA-intoxicated hepatic sections with mild portal fibroplasia in group (arrow) and TAA-intoxicated hepatic sections treated with either ASH or ASH-BPNC showing apparently normal liver histology (upper panel) and a chart showing MTC-stained area (lower panel) represented as mean ± SD (P < 0.05). *significant from normal control group; @significant from TAA-intoxicated group; #significant from TAA + ASH-treated group
Fig. 5
Fig. 5
Effects of ASH-BPNC on brain histopathological alterations in TAA-induced HE in rats. Photomicrographs of brain sections stained with H&E displaying TAA-intoxicated brain sections with area of vacuolation and neuronal degeneration in cerebral cortex (arrows), edema and demyelination in striatum (arrows), extensive vacuolation and neuronal necrosis in hippocampus (arrows), and Purkinje cell necrosis with vacuolation in the cerebellum (arrows); TAA-intoxicated brain sections treated with ASH showing few dark neurons in the cerebral cortex, apparently normal striatum and few degenerating cells in hippocampus (arrows), and cerebellum (arrows); TAA-intoxicated brain sections treated with ASH-BPNC showing apparently normal cerebral cortex, striatum, hippocampus, and cerebellum
Fig. 6
Fig. 6
Effect of ASH-BPNC on hepatic oxidative stress markers and Nrf2 pathway in TAA-induced HE in rats. Hepatic tissue levels of MDA (a), GSH (b), Nrf2 (c), and HO-1 (d); relative mRNA expression levels of Nrf2 (e), NQO1 (f), and GCLC (g) in hepatic tissues. Data are represented as mean ± SD (P < 0.05). *significant from normal control, @significant from TAA-intoxicated group, and #significant from TAA + ASH-treated group
Fig. 7
Fig. 7
Effect of ASH-BPNC on brain oxidative stress markers and Nrf2 pathway in TAA-induced HE in rats. Brain tissue levels of MDA (a), GSH (b), Nrf2 (c), and HO-1 (d); relative mRNA expression levels of Nrf2 (e), NQO1 (f), and GCLC (g) in brain tissues. Data are represented as mean ± SD (P < 0.05). *significant from normal control and BPNC groups, @significant from TAA-intoxicated group, and #significant from TAA + ASH-treated group
Fig. 8
Fig. 8
Effect of ASH-BPNC on the hepatic immunohistochemical expression of pro-inflammatory markers (NF-κB and TNF-α) in TAA-induced HE in rats. Representative photomicrographs of NF-κB staining (black stars; positive expression) in hepatic tissues and quantitative analysis of the immunohistochemical expression of NF-κB (left panel). Representative photomicrographs of TNF-α staining (black stars; positive expression) in hepatic tissues and quantitative analysis of the immunohistochemical expression of TNF-α (right panel). Data are represented as mean ± SD (P < 0.05). *significant from normal control, @significant from TAA-intoxicated group, and #significant from TAA + ASH-treated group
Fig. 9
Fig. 9
Effect of ASH-BPNC on the brain immunohistochemical expression of NF-κB in TAA-induced HE in rats. Representative photomicrographs of NF-κB staining (black arrows; positive expression) in different regions of brain tissues (upper panel) and quantitative analysis of the Immunohistochemical expression of NF-κB (lower panel). Data are represented as mean ± SD (P < 0.05). *significant from normal control; @significant from TAA-intoxicated group; #significant from TAA + ASH-treated group
Fig. 10
Fig. 10
Effect of ASH-BPNC on the brain immunohistochemical expression of TNF-α in TAA-induced HE in rats. Representative photomicrographs of TNF-α staining (black arrows; positive expression) in different regions of brain tissues (upper panel) and quantitative analysis of the immunohistochemical expression of TNF-α (lower panel). Data are represented as mean ± SD (P < 0.05). *significant from normal control; @significant from TAA-intoxicated group; #significant from TAA + ASH-treated group
Fig. 11
Fig. 11
Effect of ASH-BPNC on the brain immunohistochemical expression of GFAP in TAA-induced HE in rats. Representative photomicrographs of GFAP staining (black arrows; positive expression) in different regions of brain tissues (upper panel) and quantitative analysis of the immunohistochemical expression of GFAP (lower panel). Data are represented as mean ± SD (P < 0.05). *significant from normal control; @significant from TAA-intoxicated group; #significant from TAA + ASH-treated group
Fig. 12
Fig. 12
Effect of ASH-BPNC on MAPK signaling pathway in TAA-induced HE in rats. Relative mRNA expression of p38 in hepatic (a) and brain (c) tissues; Relative mRNA expression of ERK1/2 in hepatic (b) and brain (d) tissues. Data are represented as mean ± SD (P < 0.05). *significant from normal control; @significant from TAA-intoxicated group; #significant from TAA + ASH-treated group
Fig. 13
Fig. 13
In vivo biodistribution of fluorescein diacetate-labeled ASH-BPNC in tissues of vital organs. Representative graph showing biodistribution of fluorescein diacetate-labeled ASH-BPNC in homogenized tissues of vital organs (a) and photomicrographs showing fluorescent imaging of tissue sections of vital organs treated with fluorescein diacetate-labeled ASH-BPNC (b). Data are represented as mean ± SD

Similar articles

Cited by

References

    1. Rose CF, Amodio P, Bajaj JS, et al. Hepatic encephalopathy:novel insights into classification, pathophysiology and therapy. J Hepatol. 2020;73:1526–1547. doi: 10.1016/j.jhep.2020.07.013. - DOI - PubMed
    1. Elwir S, Rahimi RS. Hepatic encephalopathy:an update on the pathophysiology and therapeutic options. J Clin Transl Hepatol. 2017;5:142–151. - PMC - PubMed
    1. Vilstrup H, Amodio P, Bajaj J, et al. Hepatic encephalopathy in chronic liver disease:2014 Practice Guideline by the American Association for the Study Of Liver Diseases and the European Association for the Study of the Liver. Hepatology. 2014;60:715–735. doi: 10.1002/hep.27210. - DOI - PubMed
    1. Montagnese S, Russo FP, Amodio P, et al. Hepatic encephalopathy 2018:A clinical practice guideline by the Italian Association for the Study of the Liver (AISF) Dig Liver Dis. 2019;51:190–205. doi: 10.1016/j.dld.2018.11.035. - DOI - PubMed
    1. Ryu AJ, Rahimi RS, Leise MD. The current hepatic encephalopathy pipeline. J Clin Exp Hepatol. 2020;10:377–385. doi: 10.1016/j.jceh.2020.01.001. - DOI - PMC - PubMed