

Effect of chronic intermittent hypoxia-induced HIF-1α/ATAD2 expression on lung cancer stemness
- PMID: 35672694
- PMCID: PMC9172155
- DOI: 10.1186/s11658-022-00345-5
Effect of chronic intermittent hypoxia-induced HIF-1α/ATAD2 expression on lung cancer stemness
Abstract
Background: Obstructive sleep apnea is associated with increased lung cancer incidence and mortality. Cancer stem cells (CSCs) are characterized by their self-renewing ability, which contributes to metastasis, recurrence, and drug resistance. ATPase family AAA domain-containing protein 2 (ATAD2) induces malignancy in different types of tumors. However, a correlation between ATAD2 expression and CSCs in lung cancer has not yet been reported.
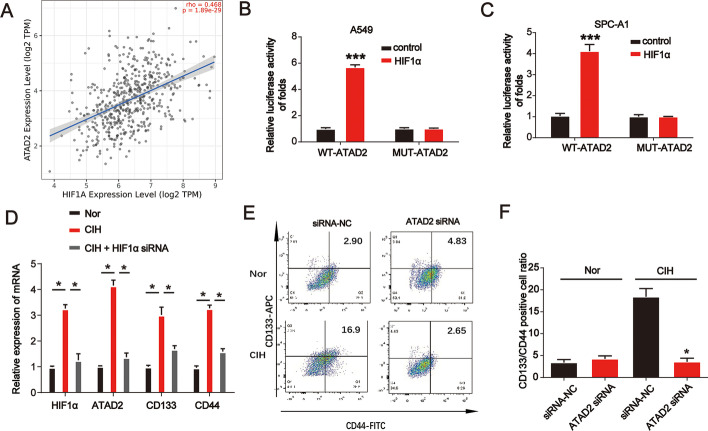
Methods: The relative messenger RNA (mRNA) levels of ATAD2, CD44, CD133, and hypoxia-inducible factor (HIF)-1α were determined using reverse-transcription quantitative polymerase chain reaction. ATAD2 protein levels were determined using Western blotting. Cell counting kit-8, 5-ethynyl-2'-deoxyuridine (EdU), and colony formation assays were performed to analyze the proliferation of lung cancer cells. Transwell migration and invasion assays were performed to evaluate cell migration and invasion, respectively. Tumor sphere formation analysis was used to determine tumor spheroid capacity. The link between ATAD2 and HIF-1α was verified using a dual-luciferase reporter assay. Immunofluorescence staining was performed to assess mitochondrial reactive oxygen species (mtROS) production. Flow cytometry analysis was conducted to determine the CD133 and CD44 positive cell ratio.
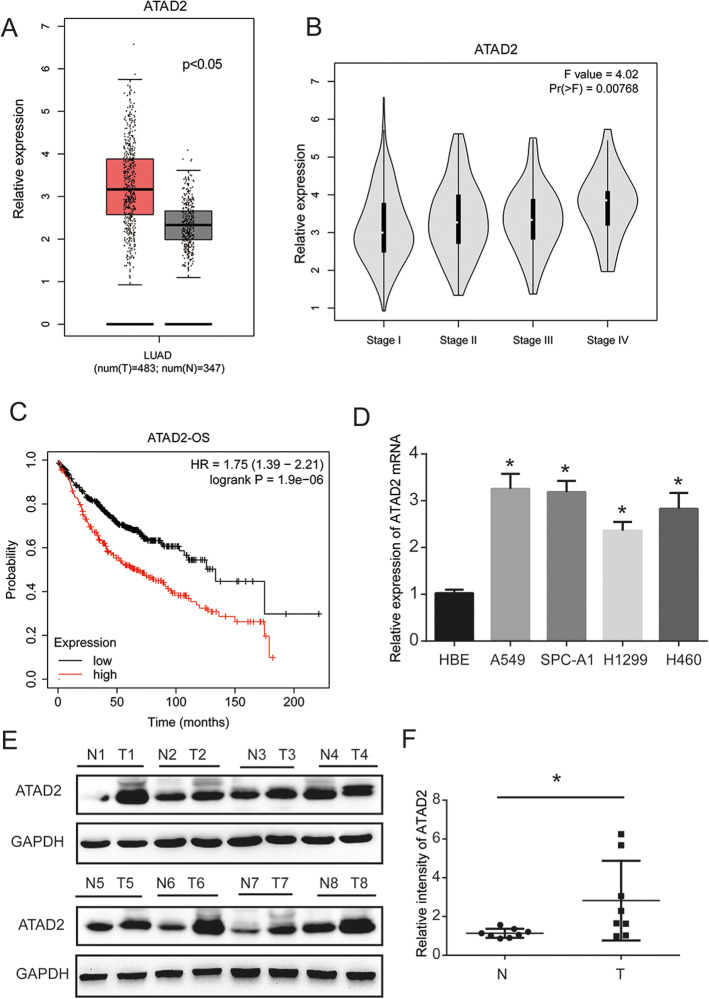
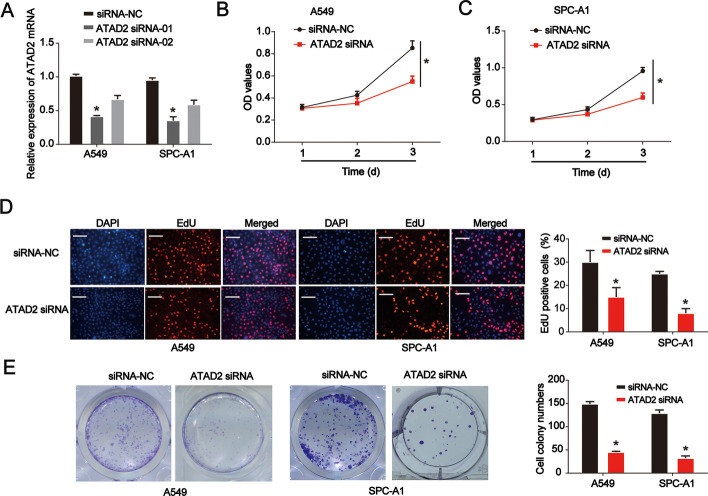
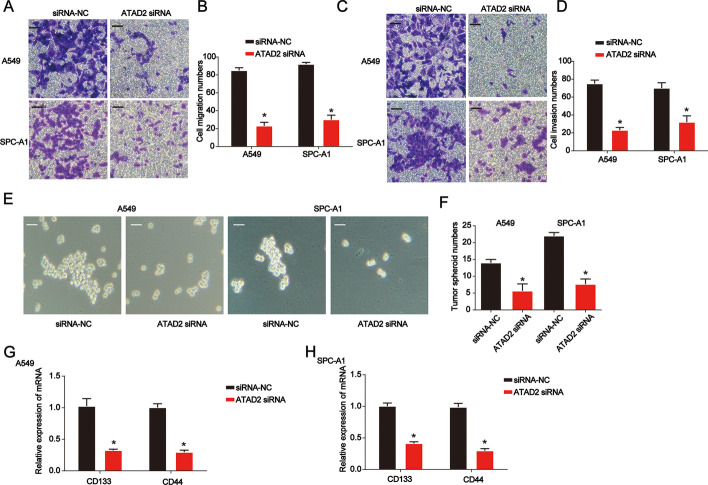
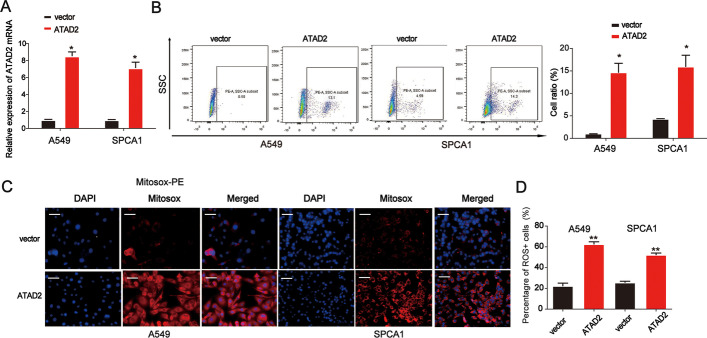
Results: We evaluated the relative expression of ATAD2 in four lung cancer cell lines (A549, SPC-A1, H460, and H1299 cells) and found increased mRNA and protein levels of ATAD2 in lung cancer samples. ATAD2 overexpression was a poor prognostic factor for lung cancer patients. Loss of ATAD2 reduced lung cancer cell viability and proliferation. Additionally, ATAD2 knockdown repressed lung cancer cell migration, invasion, stem-cell-like properties, and mtROS production. Chronic intermittent hypoxia (CIH)-induced HIF-1α expression significantly activated ATAD2 during lung cancer progression.
Conclusions: This study found that CIH induced HIF-1α expression, which acts as a transcriptional activator of ATAD2. The present study also suggests a novel mechanism by which the integrity of CIH-triggered HIF-1α/ATAD2 may determine lung cancer aggressiveness via the interplay of mtROS and stemness in lung cancer cells.
Keywords: ATAD2; CIH; HIF-1α; Lung cancer stem cells.
© 2022. The Author(s).
Conflict of interest statement
The authors declare that they have no competing interests.
Figures
Similar articles
-
ESM1/HIF‑1α pathway modulates chronic intermittent hypoxia‑induced non‑small‑cell lung cancer proliferation, stemness and epithelial‑mesenchymal transition.Oncol Rep. 2021 Mar;45(3):1226-1234. doi: 10.3892/or.2020.7913. Epub 2020 Dec 30. Oncol Rep. 2021. PMID: 33650648
-
BTB and CNC homology 1 (Bach1) induces lung cancer stem cell phenotypes by stimulating CD44 expression.Respir Res. 2021 Dec 23;22(1):320. doi: 10.1186/s12931-021-01918-2. Respir Res. 2021. PMID: 34949193 Free PMC article.
-
Downregulation of AAA-domain-containing protein 2 restrains cancer stem cell properties in esophageal squamous cell carcinoma via blockade of the Hedgehog signaling pathway.Am J Physiol Cell Physiol. 2020 Jul 1;319(1):C93-C104. doi: 10.1152/ajpcell.00133.2019. Epub 2019 Nov 20. Am J Physiol Cell Physiol. 2020. PMID: 31747529
-
Tumor-Promoting ATAD2 and Its Preclinical Challenges.Biomolecules. 2022 Jul 28;12(8):1040. doi: 10.3390/biom12081040. Biomolecules. 2022. PMID: 36008934 Free PMC article. Review.
-
ATPase family AAA domain-containing protein 2 (ATAD2): From an epigenetic modulator to cancer therapeutic target.Theranostics. 2023 Jan 1;13(2):787-809. doi: 10.7150/thno.78840. eCollection 2023. Theranostics. 2023. PMID: 36632213 Free PMC article. Review.
Cited by
-
Identification of a novel intermittent hypoxia-related prognostic lncRNA signature and the ceRNA of lncRNA GSEC/miR-873-3p/EGLN3 regulatory axis in lung adenocarcinoma.PeerJ. 2023 Oct 10;11:e16242. doi: 10.7717/peerj.16242. eCollection 2023. PeerJ. 2023. PMID: 37842058 Free PMC article.
-
GJB2 enhances cancer stem cell properties by modulating SOX2 expression via NF-κB pathway activation in lung adenocarcinoma.Transl Cancer Res. 2025 May 30;14(5):2648-2660. doi: 10.21037/tcr-24-2075. Epub 2025 Apr 27. Transl Cancer Res. 2025. PMID: 40530159 Free PMC article.
-
THER: Integrative Web Tool for Tumour Hypoxia Exploration and Research.Cell Prolif. 2025 Aug;58(8):e70053. doi: 10.1111/cpr.70053. Epub 2025 May 1. Cell Prolif. 2025. PMID: 40312874 Free PMC article.
-
Potential Pathophysiological Pathways in the Complex Relationships between OSA and Cancer.Cancers (Basel). 2023 Feb 7;15(4):1061. doi: 10.3390/cancers15041061. Cancers (Basel). 2023. PMID: 36831404 Free PMC article. Review.
-
A review of obstructive sleep apnea and lung cancer: epidemiology, pathogenesis, and therapeutic options.Front Immunol. 2024 Mar 28;15:1374236. doi: 10.3389/fimmu.2024.1374236. eCollection 2024. Front Immunol. 2024. PMID: 38605948 Free PMC article. Review.
References
-
- Chiang AA. Obstructive sleep apnea and chronic intermittent hypoxia: a review. Chin J Physiol. 2006;49:234–243. - PubMed
Publication types
MeSH terms
Substances
Grants and funding
LinkOut - more resources
Full Text Sources
Medical
Research Materials
Miscellaneous
