

Evaluation of the models generated from clinical features and deep learning-based segmentations: Can thoracic CT on admission help us to predict hospitalized COVID-19 patients who will require intensive care?
- PMID: 35672719
- PMCID: PMC9172094
- DOI: 10.1186/s12880-022-00833-2
Evaluation of the models generated from clinical features and deep learning-based segmentations: Can thoracic CT on admission help us to predict hospitalized COVID-19 patients who will require intensive care?
Abstract
Background: The aim of the study was to predict the probability of intensive care unit (ICU) care for inpatient COVID-19 cases using clinical and artificial intelligence segmentation-based volumetric and CT-radiomics parameters on admission.
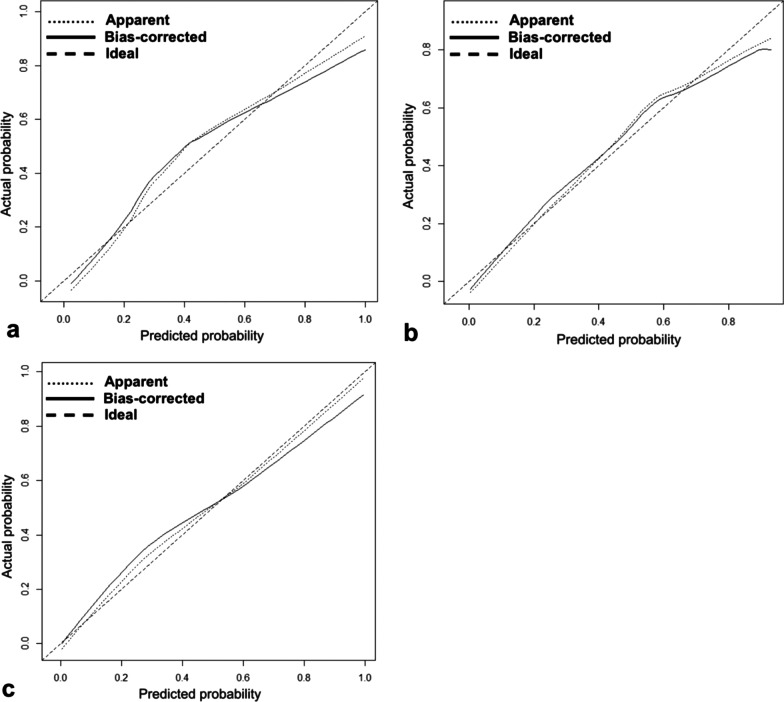
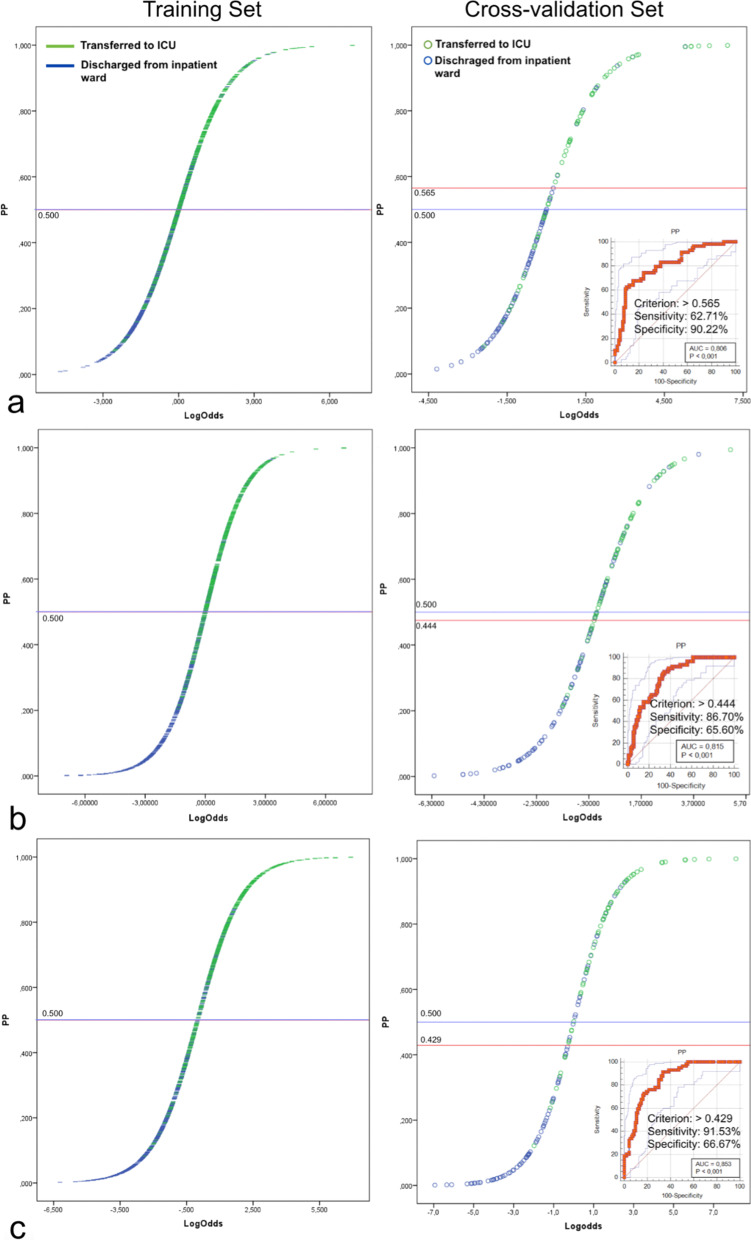
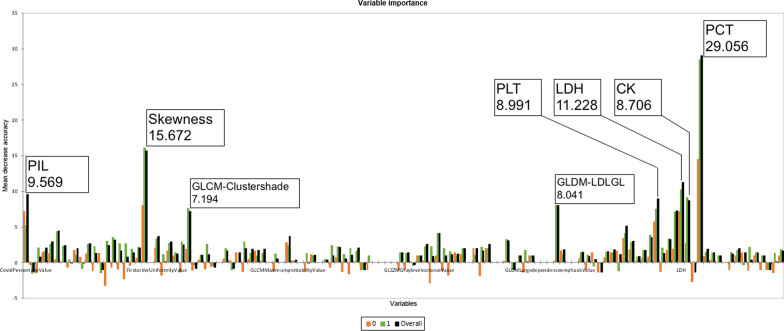
Methods: Twenty-eight clinical/laboratory features, 21 volumetric parameters, and 74 radiomics parameters obtained by deep learning (DL)-based segmentations from CT examinations of 191 severe COVID-19 inpatients admitted between March 2020 and March 2021 were collected. Patients were divided into Group 1 (117 patients discharged from the inpatient service) and Group 2 (74 patients transferred to the ICU), and the differences between the groups were evaluated with the T-test and Mann-Whitney test. The sensitivities and specificities of significantly different parameters were evaluated by ROC analysis. Subsequently, 152 (79.5%) patients were assigned to the training/cross-validation set, and 39 (20.5%) patients were assigned to the test set. Clinical, radiological, and combined logit-fit models were generated by using the Bayesian information criterion from the training set and optimized via tenfold cross-validation. To simultaneously use all of the clinical, volumetric, and radiomics parameters, a random forest model was produced, and this model was trained by using a balanced training set created by adding synthetic data to the existing training/cross-validation set. The results of the models in predicting ICU patients were evaluated with the test set.
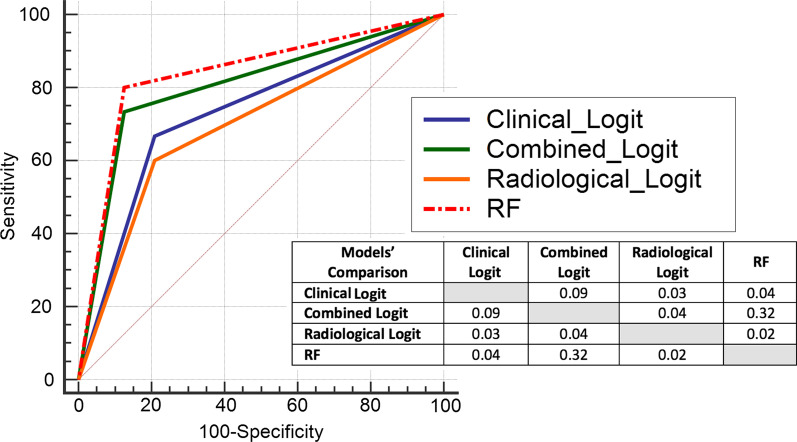
Results: No parameter individually created a reliable classifier. When the test set was evaluated with the final models, the AUC values were 0.736, 0.708, and 0.794, the specificity values were 79.17%, 79.17%, and 87.50%, the sensitivity values were 66.67%, 60%, and 73.33%, and the F1 values were 0.67, 0.62, and 0.76 for the clinical, radiological, and combined logit-fit models, respectively. The random forest model that was trained with the balanced training/cross-validation set was the most successful model, achieving an AUC of 0.837, specificity of 87.50%, sensitivity of 80%, and F1 value of 0.80 in the test set.
Conclusion: By using a machine learning algorithm that was composed of clinical and DL-segmentation-based radiological parameters and that was trained with a balanced data set, COVID-19 patients who may require intensive care could be successfully predicted.
Keywords: Artificial intelligence; COVID-19; Computed tomography; Deep learning; Logistic regression models; Machine learning; Radiomics.
© 2022. The Author(s).
Conflict of interest statement
The authors declare no competing interests.
The authors of this manuscript declare no relationships with any companies, whose products or services may be related to the subject matter of the article.
Figures

Similar articles
-
3D CT-Inclusive Deep-Learning Model to Predict Mortality, ICU Admittance, and Intubation in COVID-19 Patients.J Digit Imaging. 2023 Apr;36(2):603-616. doi: 10.1007/s10278-022-00734-4. Epub 2022 Nov 30. J Digit Imaging. 2023. PMID: 36450922 Free PMC article.
-
Clinic, CT radiomics, and deep learning combined model for the prediction of invasive pulmonary aspergillosis.BMC Med Imaging. 2024 Oct 7;24(1):264. doi: 10.1186/s12880-024-01442-x. BMC Med Imaging. 2024. PMID: 39375609 Free PMC article.
-
Comparison of deep learning, radiomics and subjective assessment of chest CT findings in SARS-CoV-2 pneumonia.Clin Imaging. 2021 Dec;80:58-66. doi: 10.1016/j.clinimag.2021.06.036. Epub 2021 Jul 1. Clin Imaging. 2021. PMID: 34246044 Free PMC article.
-
Artificial intelligence-driven assessment of radiological images for COVID-19.Comput Biol Med. 2021 Sep;136:104665. doi: 10.1016/j.compbiomed.2021.104665. Epub 2021 Jul 21. Comput Biol Med. 2021. PMID: 34343890 Free PMC article. Review.
-
Diagnosis of COVID-19 Using Machine Learning and Deep Learning: A Review.Curr Med Imaging. 2021;17(12):1403-1418. doi: 10.2174/1573405617666210713113439. Curr Med Imaging. 2021. PMID: 34259149 Review.
Cited by
-
Classification of the ICU Admission for COVID-19 Patients with Transfer Learning Models Using Chest X-Ray Images.Diagnostics (Basel). 2025 Mar 26;15(7):845. doi: 10.3390/diagnostics15070845. Diagnostics (Basel). 2025. PMID: 40218195 Free PMC article.
-
Radiomics analysis in medical imaging research.J Med Radiat Sci. 2023 Mar;70(1):3-7. doi: 10.1002/jmrs.662. Epub 2023 Feb 10. J Med Radiat Sci. 2023. PMID: 36762402 Free PMC article.
-
Peritumoral features for assessing invasiveness of lung adenocarcinoma manifesting as ground-glass nodules.Sci Rep. 2025 Apr 23;15(1):14112. doi: 10.1038/s41598-025-99180-9. Sci Rep. 2025. PMID: 40269224 Free PMC article.
-
Utilizing machine learning to predict hospital admissions for pediatric COVID-19 patients (PrepCOVID-Machine).Sci Rep. 2025 Jan 24;15(1):3131. doi: 10.1038/s41598-024-80538-4. Sci Rep. 2025. PMID: 39856094 Free PMC article.
-
Concordance and generalization of an AI algorithm with real-world clinical data in the pre-omicron and omicron era.Heliyon. 2024 Feb 2;10(3):e25410. doi: 10.1016/j.heliyon.2024.e25410. eCollection 2024 Feb 15. Heliyon. 2024. PMID: 38356547 Free PMC article.
References
-
- COVID-19 Treatment Guidelines Panel. Coronavirus disease 2019 (COVID-19) treatment guidelines. National Institutes of Health. Available at https://www.covid19treatmentguidelines.nih.gov/. Accessed 24 Oct 2021. - PubMed
MeSH terms
LinkOut - more resources
Full Text Sources
Medical
