

Time trend prediction and spatial-temporal analysis of multidrug-resistant tuberculosis in Guizhou Province, China, during 2014-2020
- PMID: 35672746
- PMCID: PMC9171477
- DOI: 10.1186/s12879-022-07499-9
Time trend prediction and spatial-temporal analysis of multidrug-resistant tuberculosis in Guizhou Province, China, during 2014-2020
Abstract
Background: Guizhou is located in the southwest of China with high multidrug-resistant tuberculosis (MDR-TB) epidemic. To fight this disease, Guizhou provincial authorities have made efforts to establish MDR-TB service system and perform the strategies for active case finding since 2014. The expanded case finding starting from 2019 and COVID-19 pandemic may affect the cases distribution. Thus, this study aims to analyze MDR-TB epidemic status from 2014 to 2020 for the first time in Guizhou in order to guide control strategies.
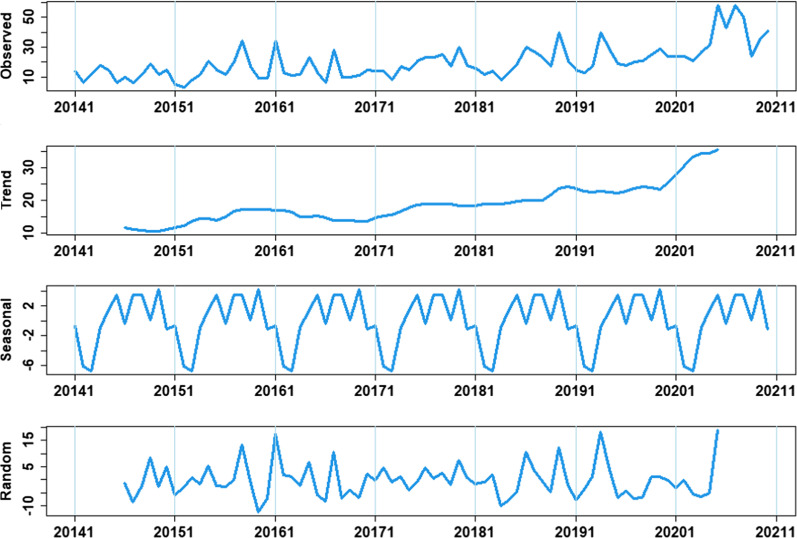
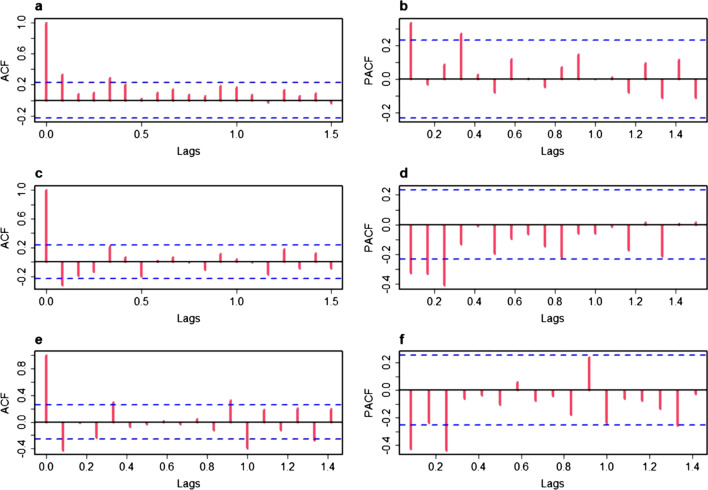
Methods: Data of notified MDR-TB cases were extracted from the National TB Surveillance System correspond to population information for each county of Guizhou from 2014 to 2020. The percentage change was calculated to quantify the change of cases from 2014 to 2020. Time trend and seasonality of case series were analyzed by a seasonal autoregressive integrated moving average (SARIMA) model. Spatial-temporal distribution at county-level was explored by spatial autocorrelation analysis and spatial-temporal scan statistic.
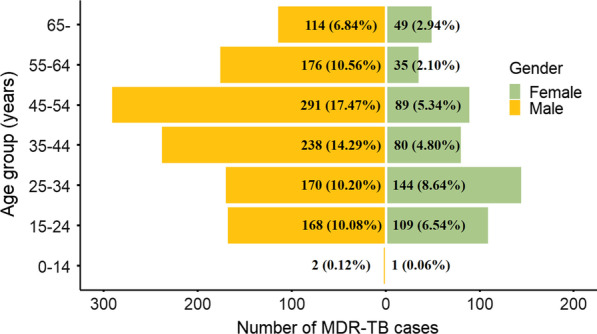
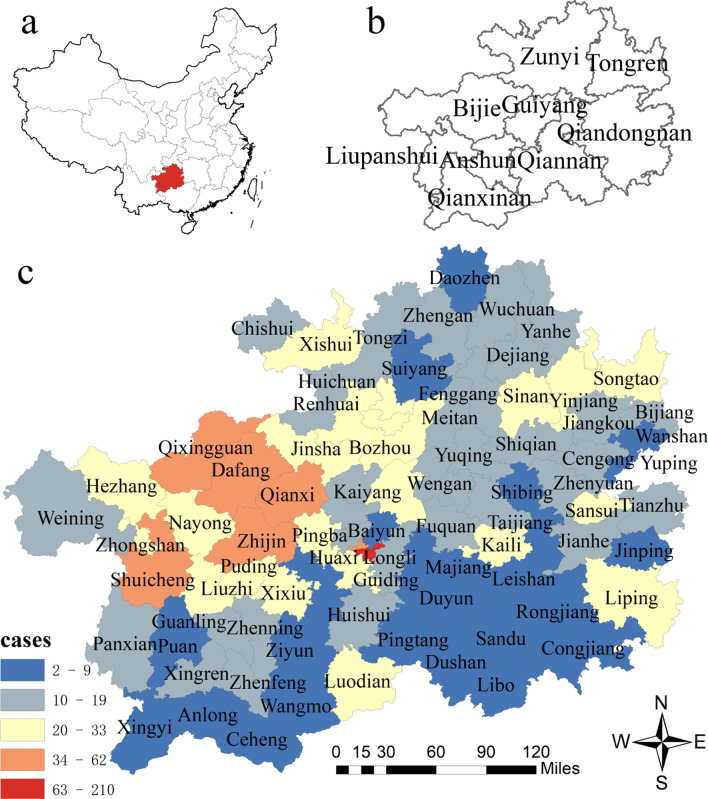
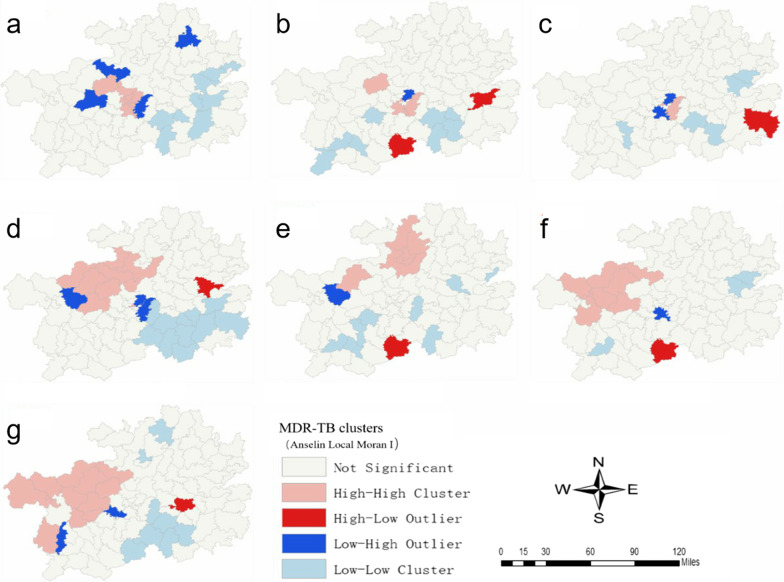
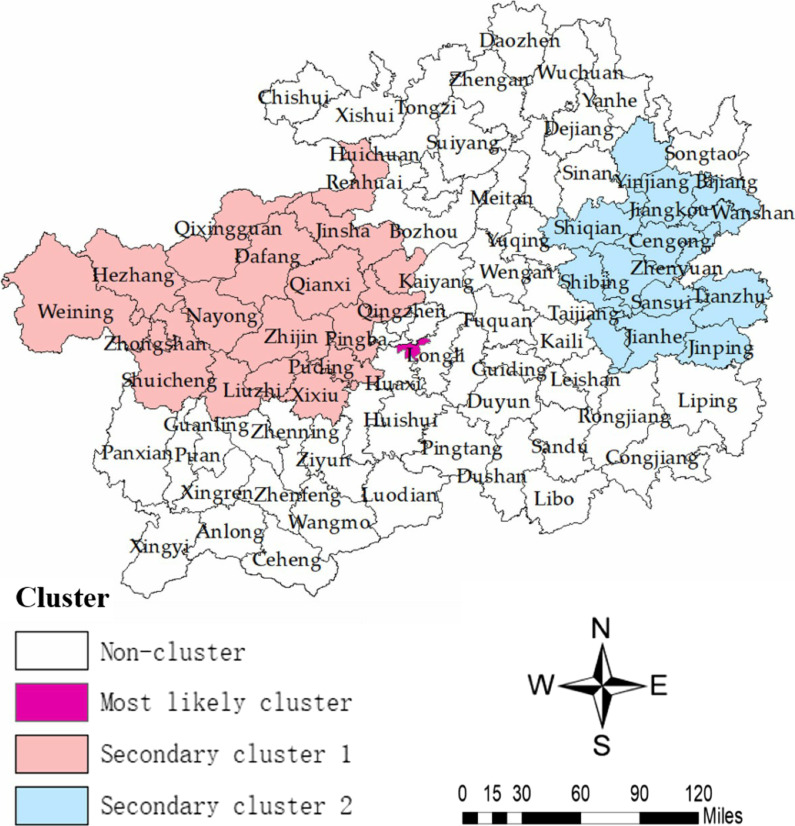
Results: Guizhou has 9 prefectures and 88 counties. In this study, 1,666 notified MDR-TB cases were included from 2014-2020. The number of cases increased yearly. Between 2014 and 2019, the percentage increase ranged from 6.7 to 21.0%. From 2019 to 2020, the percentage increase was 62.1%. The seasonal trend illustrated that most cases were observed during the autumn with the trough in February. Only in 2020, a peak admission was observed in June. This may be caused by COVID-19 pandemic restrictions being lifted until May 2020. The spatial-temporal heterogeneity revealed that over the years, most MDR-TB cases stably aggregated over four prefectures in the northwest, covering Bijie, Guiyang, Liupanshui and Zunyi. Three prefectures (Anshun, Tongren and Qiandongnan) only exhibited case clusters in 2020.
Conclusion: This study identified the upward trend with seasonality and spatial-temporal clusters of MDR-TB cases in Guizhou from 2014 to 2020. The fast rising of cases and different distribution from the past in 2020 were affected by the expanded case finding from 2019 and COVID-19. The results suggest that control efforts should target at high-risk periods and areas by prioritizing resources allocation to increase cases detection capacity and better access to treatment.
Keywords: MDR-TB; Prediction; SARIMA model; Spatial−temporal analysis.
© 2022. The Author(s).
Conflict of interest statement
The authors declare that they have no competing interests.
Figures

Similar articles
-
Spatiotemporal characteristics and the epidemiology of tuberculosis in China from 2004 to 2017 by the nationwide surveillance system.BMC Public Health. 2020 Aug 26;20(1):1284. doi: 10.1186/s12889-020-09331-y. BMC Public Health. 2020. PMID: 32843011 Free PMC article.
-
Predicting the incidence of rifampicin resistant tuberculosis in Yunnan, China: a seasonal time series analysis based on routine surveillance data.BMC Infect Dis. 2024 Aug 16;24(1):835. doi: 10.1186/s12879-024-09740-z. BMC Infect Dis. 2024. PMID: 39152374 Free PMC article.
-
The characteristics of spatial-temporal distribution and cluster of tuberculosis in Yunnan Province, China, 2005-2018.BMC Public Health. 2019 Dec 21;19(1):1715. doi: 10.1186/s12889-019-7993-5. BMC Public Health. 2019. PMID: 31864329 Free PMC article.
-
Analysis on spatial-temporal distribution characteristics of smear positive pulmonary tuberculosis in China, 2004-2015.Int J Infect Dis. 2019 Mar;80S:S36-S44. doi: 10.1016/j.ijid.2019.02.038. Epub 2019 Feb 27. Int J Infect Dis. 2019. PMID: 30825654
-
Treatment of multidrug-resistant tuberculosis in Thailand.Chemotherapy. 1996;42 Suppl 3:10-5; discussion 30-3. doi: 10.1159/000239508. Chemotherapy. 1996. PMID: 8980862 Review.
Cited by
-
Analysis of Tuberculosis Epidemiological Distribution Characteristics in Fujian Province, China, 2005-2021: Spatial-Temporal Analysis Study.JMIR Public Health Surveill. 2024 Nov 18;10:e49123. doi: 10.2196/49123. JMIR Public Health Surveill. 2024. PMID: 39556716 Free PMC article.
-
Epidemiological characteristics, diagnosis and treatment effect of rifampicin-resistant pulmonary tuberculosis (RR-PTB) in Guizhou Province.BMC Infect Dis. 2024 Sep 27;24(1):1058. doi: 10.1186/s12879-024-09976-9. BMC Infect Dis. 2024. PMID: 39333894 Free PMC article.
-
Examining the efficacy of treatment outcomes for patients with pulmonary tuberculosis in Western China: A retrospective study in a region of high incidence.BMC Public Health. 2025 Apr 11;25(1):1360. doi: 10.1186/s12889-025-22543-4. BMC Public Health. 2025. PMID: 40217246 Free PMC article.
References
-
- WHO. Global tuberculosis report 2020. https://www.medbox.org/document/global-tuberculosis-report-2020#GO. Accessed Oct 2021.
-
- WHO. Global tuberculosis report 2018. https://www.aidsdatahub.org/resource/global-tuberculosis-report-2018. Accessed Nov 2019.
-
- Guizhou provincial health and family planning commission. Guizhou provincial TB control programme from 2016 to 2020.2016. http://www.chinatb.org/xxjlg/201712/P020171217473860262138.pdf. Accessed 13 Sep 2019.
MeSH terms
Grants and funding
LinkOut - more resources
Full Text Sources
Medical
Miscellaneous
