

Vascular network expansion, integrity of blood-brain interfaces, and cerebrospinal fluid cytokine concentration during postnatal development in the normal and jaundiced rat
- PMID: 35672829
- PMCID: PMC9172137
- DOI: 10.1186/s12987-022-00332-0
Vascular network expansion, integrity of blood-brain interfaces, and cerebrospinal fluid cytokine concentration during postnatal development in the normal and jaundiced rat
Abstract
Background: Severe neonatal jaundice resulting from elevated levels of unconjugated bilirubin in the blood induces dramatic neurological impairment. Central oxidative stress and an inflammatory response have been associated with the pathophysiological mechanism. Cells forming the blood-brain barrier and the choroidal blood-CSF barrier are the first CNS cells exposed to increased plasma levels of unconjugated bilirubin. These barriers are key regulators of brain homeostasis and require active oxidative metabolism to fulfill their protective functions. The choroid plexus-CSF system is involved in neuroinflammatory processes. In this paper, we address the impact of neonatal hyperbilirubinemia on some aspects of brain barriers. We describe physiological changes in the neurovascular network, blood-brain/CSF barriers integrities, and CSF cytokine levels during the postnatal period in normobilirubinemic animals, and analyze these parameters in parallel in Gunn rats that are deficient in bilirubin catabolism and develop postnatal hyperbilirubinemia.
Methods: Gunn rats bearing a mutation in UGT1a genes were used. The neurovascular network was analyzed by immunofluorescence stereomicroscopy. The integrity of the barriers was evaluated by [14C]-sucrose permeability measurement. CSF cytokine levels were measured by multiplex immunoassay. The choroid plexus-CSF system response to an inflammatory challenge was assessed by enumerating CSF leukocytes.
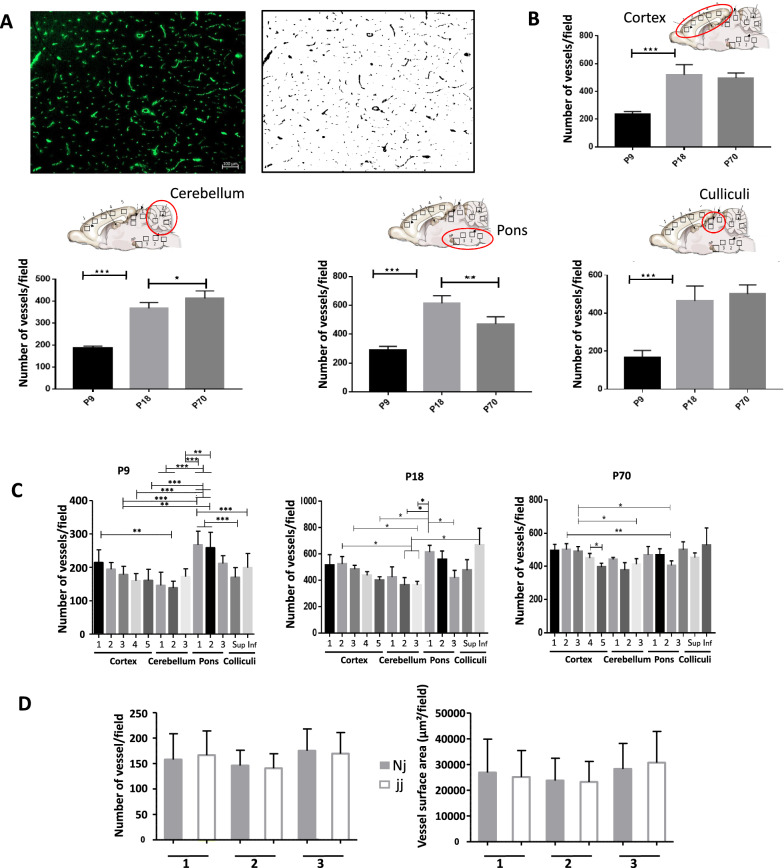
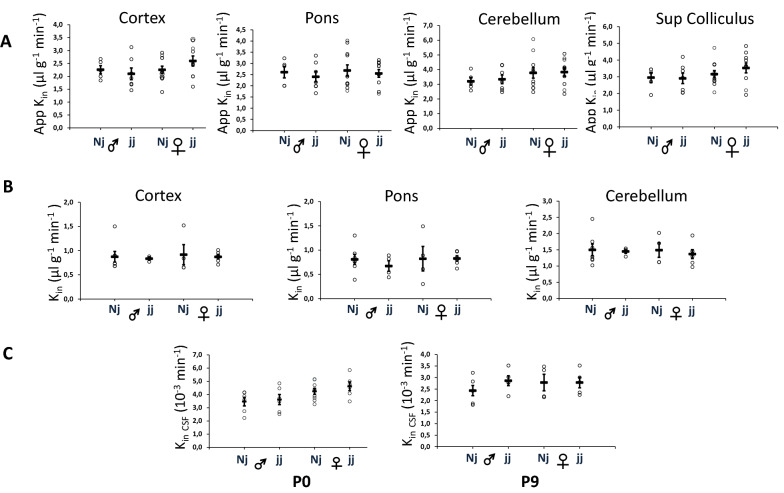
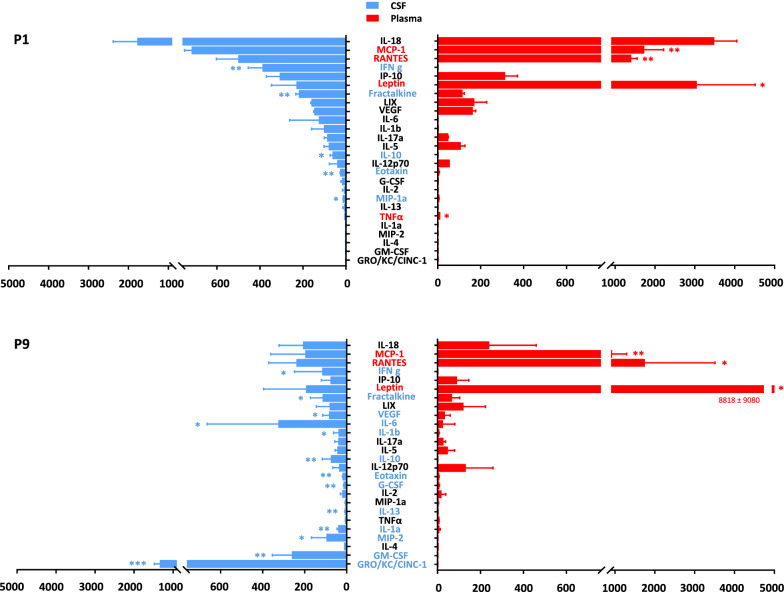
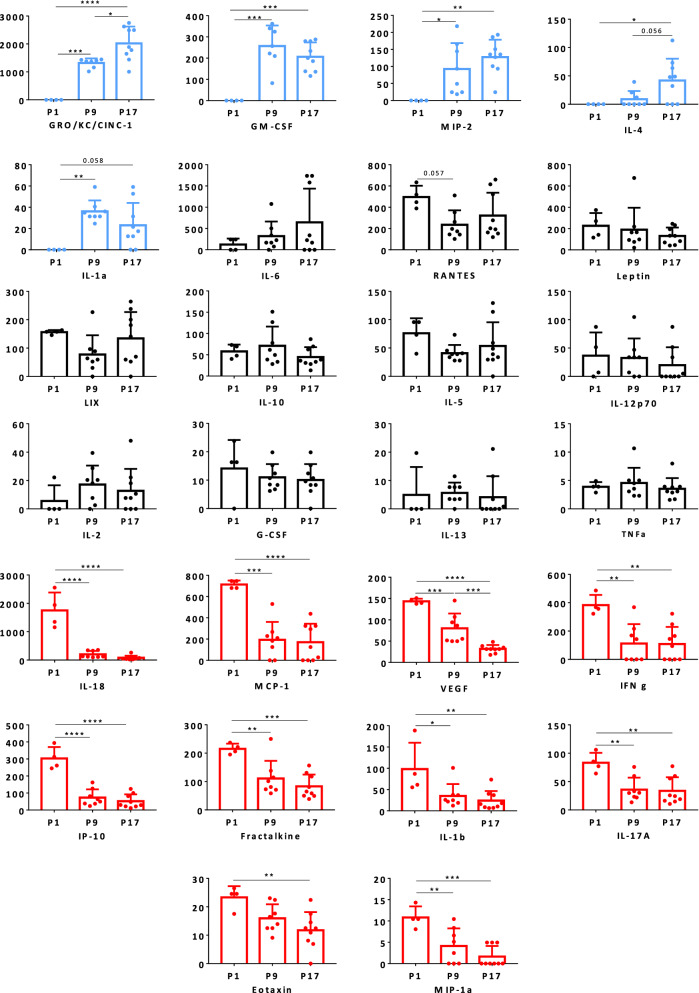
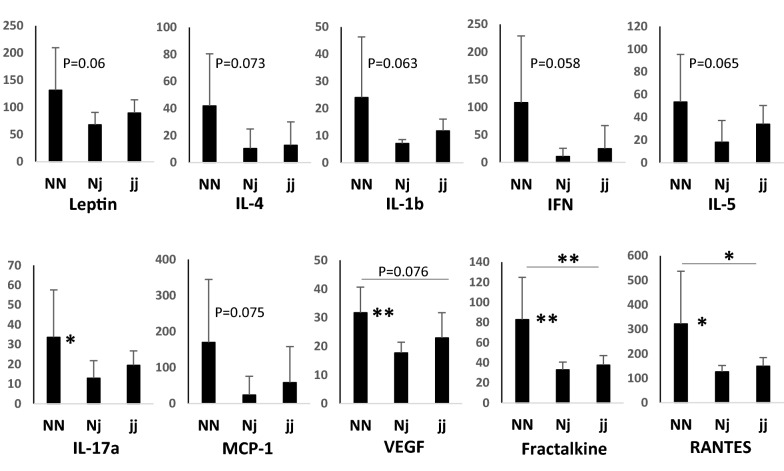
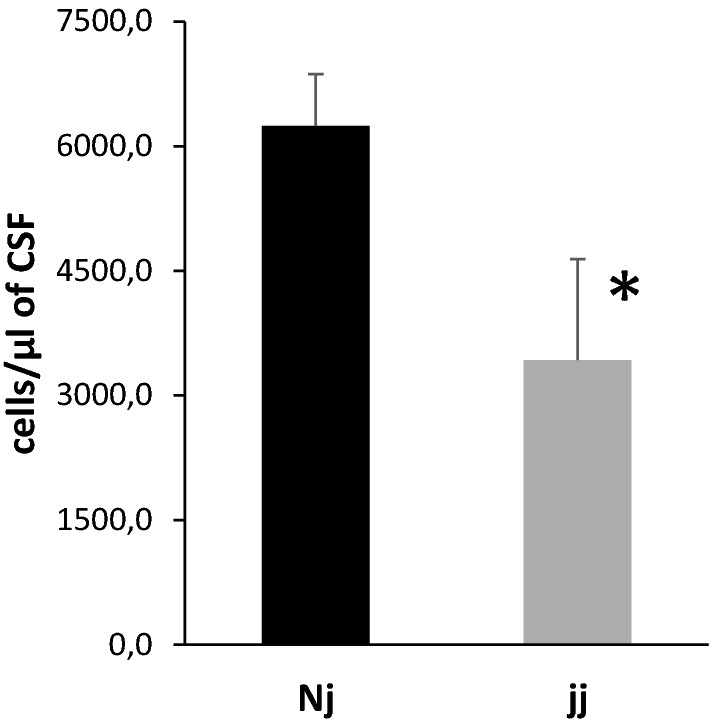
Results: In normobilirubinemic animals, the neurovascular network expands postnatally and displays stage-specific regional variations in its complexity. Network expansion is not affected by hyperbilirubinemia. Permeability of the blood-brain and blood-CSF barriers to sucrose decreases between one- and 9-day-old animals, and does not differ between normobilirubinemic and hyperbilirubinemic rats. Cytokine profiles differ between CSF and plasma in all 1-, 9-, and 18-day-old animals. The CSF cytokine profile in 1-day-old animals is markedly different from that established in older animals. Hyperbilirubinemia perturbs these cytokine profiles only to a very limited extent, and reduces CSF immune cell infiltration triggered by systemic exposure to a bacterial lipopeptide.
Conclusion: The data highlight developmental specificities of the blood-brain barrier organization and of CSF cytokine content. They also indicate that a direct effect of bilirubin on the vascular system organization, brain barriers morphological integrity, and inflammatory response of the choroid plexus-CSF system is not involved in the alteration of brain functions induced by severe neonatal jaundice.
Keywords: Blood–CSF barrier; Blood–brain barrier; Cerebrospinal fluid; Choroid plexus; Cytokines; Gunn; Jaundice; Neurovascular; Postnatal development hyperbilirubinemia.
© 2022. The Author(s).
Conflict of interest statement
The authors declare that they have no competing interests.
Figures
Similar articles
-
Effects of valproate on the entry of inert hydrophilic markers and expression of tight junction associated genes in the neonatal brain and choroid plexus of a rat model of epilepsy (GAERS).Fluids Barriers CNS. 2025 Jun 12;22(1):56. doi: 10.1186/s12987-025-00667-4. Fluids Barriers CNS. 2025. PMID: 40506716 Free PMC article.
-
Modulation of Mrp1 (ABCc1) and Pgp (ABCb1) by bilirubin at the blood-CSF and blood-brain barriers in the Gunn rat.PLoS One. 2011 Jan 31;6(1):e16165. doi: 10.1371/journal.pone.0016165. PLoS One. 2011. PMID: 21297965 Free PMC article.
-
Blood-brain interfaces and bilirubin-induced neurological diseases.Curr Pharm Des. 2009;15(25):2893-907. doi: 10.2174/138161209789058147. Curr Pharm Des. 2009. PMID: 19754366 Review.
-
Simulated microgravity-induced dysregulation of cerebrospinal fluid immune homeostasis by disrupting the blood-cerebrospinal fluid barrier.Brain Behav. 2024 Sep;14(9):e3648. doi: 10.1002/brb3.3648. Brain Behav. 2024. PMID: 39262161 Free PMC article.
-
Blood-brain barrier and bilirubin: clinical aspects and experimental data.Arch Med Res. 2014 Nov;45(8):660-76. doi: 10.1016/j.arcmed.2014.11.015. Epub 2014 Dec 1. Arch Med Res. 2014. PMID: 25475697 Review.
Cited by
-
Bilirubin metabolism and its application in disease prevention: mechanisms and research advances.Inflamm Res. 2025 May 24;74(1):81. doi: 10.1007/s00011-025-02049-w. Inflamm Res. 2025. PMID: 40413269 Review.
-
Molecular events in brain bilirubin toxicity revisited.Pediatr Res. 2024 Jun;95(7):1734-1740. doi: 10.1038/s41390-024-03084-9. Epub 2024 Feb 20. Pediatr Res. 2024. PMID: 38378754 Review.
-
The glutathione-dependent neuroprotective activity of the blood-CSF barrier is inducible through the Nrf2 signaling pathway during postnatal development.Fluids Barriers CNS. 2025 Feb 21;22(1):19. doi: 10.1186/s12987-025-00622-3. Fluids Barriers CNS. 2025. PMID: 39985067 Free PMC article.
-
Age dependent contribution of entry via the CSF to the overall brain entry of small and large hydrophilic markers.Fluids Barriers CNS. 2022 Nov 14;19(1):90. doi: 10.1186/s12987-022-00387-z. Fluids Barriers CNS. 2022. PMID: 36376903 Free PMC article.
-
Neonatal IL-4 Over-Exposure is Accompanied by Macrophage Accumulation in Dura Mater After Instant Anti-inflammatory Cytokine Response in CSF.Cell Mol Neurobiol. 2024 Feb 5;44(1):18. doi: 10.1007/s10571-023-01451-4. Cell Mol Neurobiol. 2024. PMID: 38315435 Free PMC article.
References
-
- Strazielle N, Ghersi-Egea JF. Physiology of blood-brain interfaces in relation to brain disposition of small compounds and macromolecules. Mol Pharm. 2013;10(5):1473–1491. - PubMed
-
- Walchli T, Wacker A, Frei K, Regli L, Schwab ME, Hoerstrup SP, et al. Wiring the vascular network with neural cues: a CNS perspective. Neuron. 2015;87(2):271–296. - PubMed
-
- Ghersi-Egea JF, Strazielle N, Catala M, Silva-Vargas V, Doetsch F, Engelhardt B. Molecular anatomy and functions of the choroidal blood-cerebrospinal fluid barrier in health and disease. Acta Neuropathol. 2018;135(3):337–361. - PubMed
MeSH terms
Substances
LinkOut - more resources
Full Text Sources
