Decadal-scale phenology and seasonal climate drivers of migratory baleen whales in a rapidly warming marine ecosystem
- PMID: 35672922
- PMCID: PMC9541444
- DOI: 10.1111/gcb.16225
Decadal-scale phenology and seasonal climate drivers of migratory baleen whales in a rapidly warming marine ecosystem
Abstract
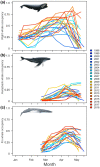
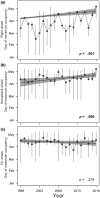
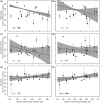
Species' response to rapid climate change can be measured through shifts in timing of recurring biological events, known as phenology. The Gulf of Maine is one of the most rapidly warming regions of the ocean, and thus an ideal system to study phenological and biological responses to climate change. A better understanding of climate-induced changes in phenology is needed to effectively and adaptively manage human-wildlife conflicts. Using data from a 20+ year marine mammal observation program, we tested the hypothesis that the phenology of large whale habitat use in Cape Cod Bay has changed and is related to regional-scale shifts in the thermal onset of spring. We used a multi-season occupancy model to measure phenological shifts and evaluate trends in the date of peak habitat use for North Atlantic right (Eubalaena glacialis), humpback (Megaptera novaeangliae), and fin (Balaenoptera physalus) whales. The date of peak habitat use shifted by +18.1 days (0.90 days/year) for right whales and +19.1 days (0.96 days/year) for humpback whales. We then evaluated interannual variability in peak habitat use relative to thermal spring transition dates (STD), and hypothesized that right whales, as planktivorous specialist feeders, would exhibit a stronger response to thermal phenology than fin and humpback whales, which are more generalist piscivorous feeders. There was a significant negative effect of western region STD on right whale habitat use, and a significant positive effect of eastern region STD on fin whale habitat use indicating differential responses to spatial seasonal conditions. Protections for threatened and endangered whales have been designed to align with expected phenology of habitat use. Our results show that whales are becoming mismatched with static seasonal management measures through shifts in their timing of habitat use, and they suggest that effective management strategies may need to alter protections as species adapt to climate change.
Keywords: Gulf of Maine; North Atlantic right whale; climate change; endangered species; fin whale; humpback whale; ocean warming; phenology.
© 2022 The Authors. Global Change Biology published by John Wiley & Sons Ltd.
Conflict of interest statement
The authors declare no conflicts of interest.
Figures


Similar articles
-
Phenological changes in North Atlantic right whale habitat use in Massachusetts Bay.Glob Chang Biol. 2020 Feb;26(2):734-745. doi: 10.1111/gcb.14867. Epub 2019 Nov 15. Glob Chang Biol. 2020. PMID: 31729818
-
Modeling changes in baleen whale seasonal abundance, timing of migration, and environmental variables to explain the sudden rise in entanglements in California.PLoS One. 2021 Apr 15;16(4):e0248557. doi: 10.1371/journal.pone.0248557. eCollection 2021. PLoS One. 2021. PMID: 33857163 Free PMC article.
-
Passive acoustic monitoring of baleen whale seasonal presence across the New York Bight.PLoS One. 2025 Feb 13;20(2):e0314857. doi: 10.1371/journal.pone.0314857. eCollection 2025. PLoS One. 2025. PMID: 39946324 Free PMC article.
-
Is it 'boom times' for baleen whales in the Pacific Arctic region?Biol Lett. 2016 Sep;12(9):20160251. doi: 10.1098/rsbl.2016.0251. Biol Lett. 2016. PMID: 27601724 Free PMC article. Review.
-
It's about time: A synthesis of changing phenology in the Gulf of Maine ecosystem.Fish Oceanogr. 2019 Sep;28(5):532-566. doi: 10.1111/fog.12429. Epub 2019 Apr 22. Fish Oceanogr. 2019. PMID: 31598058 Free PMC article. Review.
Cited by
-
Ten best practices for effective phenological research.Int J Biometeorol. 2023 Oct;67(10):1509-1522. doi: 10.1007/s00484-023-02502-7. Epub 2023 Jul 29. Int J Biometeorol. 2023. PMID: 37507579 Free PMC article. Review.
-
Long-term data reveal widespread phenological change across major US estuarine food webs.Ecol Lett. 2024 Dec;27(12):e14441. doi: 10.1111/ele.14441. Ecol Lett. 2024. PMID: 39738977 Free PMC article.
-
Rapid restructuring of the odontocete community in an ocean warming hotspot.Glob Chang Biol. 2022 Nov;28(22):6524-6540. doi: 10.1111/gcb.16382. Epub 2022 Aug 23. Glob Chang Biol. 2022. PMID: 36054792 Free PMC article.
-
Effects of temperature and precipitation changes on shifts in breeding phenology of an endangered toad.Sci Rep. 2023 Sep 4;13(1):14573. doi: 10.1038/s41598-023-40568-w. Sci Rep. 2023. PMID: 37666849 Free PMC article.
-
Don't mind if I do: Arctic humpback whales respond to winter foraging opportunities before migration.R Soc Open Sci. 2023 Sep 6;10(9):230069. doi: 10.1098/rsos.230069. eCollection 2023 Sep. R Soc Open Sci. 2023. PMID: 37680501 Free PMC article.
References
-
- Anderson, J. J. , Gurarie, E. , Bracis, C. , Burke, B. J. , & Laidre, K. L. (2013). Modeling climate change impacts on phenology and population dynamics of migratory marine species. Ecological Modelling, 264, 83–97. 10.1016/j.ecolmodel.2013.03.009 - DOI
-
- Beardsley, R. C. , Epstein, A. W. , Chen, C. S. , Wishner, K. F. , Macaulay, M. C. , & Kenney, R. D. (1996). Spatial variability in zooplankton abundance near feeding right whales in the Great South Channel. Deep‐Sea Research Part II‐Topical Studies in Oceanography, 43(7–8), 1601–1625.
-
- Bigelow, H. B. (1927). The physical oceanography of the Gulf of Maine. Bulletin of the Bureau of Fisheries, 40(2), 511–1027.
MeSH terms
LinkOut - more resources
Full Text Sources
Research Materials

