. 2022 Jul;26(14):3837-3849.
doi: 10.1111/jcmm.17418. Epub 2022 Jun 7.

PBRM1 deficiency oncogenic addiction is associated with activated AKT-mTOR signalling and aerobic glycolysis in clear cell renal cell carcinoma cells

Affiliations

PBRM1 deficiency oncogenic addiction is associated with activated AKT-mTOR signalling and aerobic glycolysis in clear cell renal cell carcinoma cells

Yu Tang et al. J Cell Mol Med. 2022 Jul.

Abstract

The PBRM1 (PB1) gene which encodes the specific subunit BAF180 of the PBAF SWI/SNF complex, is highly mutated (~ 40%) in clear cell renal cell carcinoma (ccRCC). However, its functions and impact on cell signalling are still not fully understood. Aerobic glycolysis, also known as the 'Warburg Effect', is a hallmark of cancer, whether PB1 is involved in this metabolic shift in clear cell renal cell carcinoma remains unclear. Here, with established stable knockdown PB1 cell lines, we performed functional assays to access the effects on 786-O and SN12C cells. Based on the RNA-seq data, we selected some genes encoding key glycolytic enzymes, including PFKP, ENO1, PKM and LDHA, and examined the expression levels. The AKT-mTOR signalling pathway activity and expression of HIF1α were also analysed. Our data demonstrate that PB1 deficiency promotes the proliferation, migration, Xenograft growth of 786-O and SN12C cells. Notably, knockdown of PB1 activates AKT-mTOR signalling and increases the expression of key glycolytic enzymes at both mRNA and protein levels. Furthermore, we provide evidence that deficient PB1 and hypoxic conditions exert a synergistic effect on HIF 1α expression and lactate production. Thus, our study provides novel insights into the roles of tumour suppressor PB1 and suggests that the AKT-mTOR signalling pathway, as well as glycolysis, is a potential drug target for ccRCC patients with deficient PB1.

Keywords: PBRM1(PB1); AKT-mTOR signalling; HIF1α; aerobic glycolysis; ccRCC.


Conflict of interest statement

The authors declare no conflict of interest.

Figures

FIGURE 1
FIGURE 1
Knockdown of PB1 enhances the proliferation, migration and invasion capabilities of 786‐O and SN12C cells. (A)Western blot results showing remarkable reduction of PB1 expression. (B) CCK8 assay showing knockdown of PB1 significantly promoted the proliferation rate of ccRCC cells. (C) The colony formation assay showing the colony formation capability for 786‐O and SN12C cells. (D) The wound‐healing assay showing that the migration capability for 786‐O and SN12C cells. (E) The transwell assay showing the migration capability for 786‐O and SN12C cells. The representative images (left)) and the quantitative results of independent duplicate (right) were shown in C, D and E. (*p < 0.05; **, p < 0.01; **, p < 0.001)
FIGURE 2
FIGURE 2
Knockdown of PB1 promotes the xenograft growth. (A)The mice were monitored every 5 days for 4 weeks and the body weights were measured. (B) Tumour volume in nude mice. (C) The xenografts were taken out after growing in nude mice for 25 days. (D) The final tumour weight was measured. (*p < 0.05; **, p < 0.01; **p < 0.001)
FIGURE 3
FIGURE 3
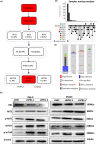
Deficient PB1 activates AKT–mTOR pathway in 786‐O and SN12C cells. (A) Analysis of TCGA data (Firehose Legacy) showing the key AKT–mTOR signalling players including PTEN, PIK3CA, AKT2, TSC1, TSC2, RHEB, MTOR are mutated; red box indicates the mutation rate of the gene is greater than 3%. (B) Overlap analysis among PTEN,PIK3CA,AKT2,TSC1,TSC2,RHEB,MTOR mutations with 528 RCC samples. (C) Screen shot showing comparisons among PBRM1, PTEN, PIK3CA and mTOR. Each horizontal bar represents a sample. Colour bars represent samples with genetic alterations and grey bars are samples not altered genetically. (D)Western blot analyses of AKT1, mTOR, p‐AKT1 and p‐mTOR in 786‐O and SN12C cells
FIGURE 4
FIGURE 4
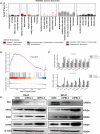
Knockdown of PB1 increases the expression levels of key glycolytic enzymes. (A) RNAseq data showing enriched KEGG terms in 786‐O cells. (B) GSE analysis showing that the glycolysis pathway was slightly enriched (p = 0.1973). (C) QRT–PCR analysis from two independent duplicates showing the mRNA levels of the selected gene. (D) Representative results of a Western blot showing the protein levels of key glycolytic enzymes. (*p < 0.05)
FIGURE 5
FIGURE 5
Depletion of PB1 promotes lactate production under hypoxic conditions. (A) Western blot analysis showing the protein levels of PB1 (top) and measurement of the lactate concentration, under normoxic conditions. (B) Western blot analysis showing the protein levels of LDHA (top) and measurement of the lactate concentration, under hypoxic conditions induced by CoCl2 (100 μM). Experiments were performed in independent duplicates. (*p < 0.05)
FIGURE 6
FIGURE 6
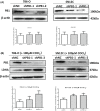
Depletion of PB1 further increases the protein level of HIF1α under hypoxic conditions in SN12C cells. (A) Western blot analysis showing the protein levels of HIF1α under normal conditions in 786‐O and SN12C cells. (B) Western blot analysis showing HIF1α levels when cells were treated with different concentrations of CoCl2. (C) Western blot analysis showing the protein levels of HIF1α under hypoxic conditions (100 μM COCl2). (D) QRT–PCR analysis showing the mRNA levels under normoxic and hypoxic conditions. (*p < 0.05, ***p < 0.001)
FIGURE 7
FIGURE 7
PB1 is negatively correlated with the mRNA levels of key glycolytic enzymes in clinic ccRCC samples. (A) TCGA data analysis showing the expression levels of PFKP, ENO1, PKM, LDHA in ccRCC tumours and the matched adjacent normal controls. (B) Co‐expression analysis of selected genes and PB1. (C) Overall survival analysis of ccRCC patients with high‐ or low‐level PB1. (D) The suggested mechanism shows that the AKT–mTOR and glycolysis signalling pathways could be activated by deficient PB1, HIF1α level could also be increased by deficient PB1, implying deficient PB1 together with hypoxic conditions exerting a synergetic effect on HIF1α expression. (*p < 0.05)

References

    1. Teyssonneau D, Gross‐Goupil M, Domblides C, et al. Treatment of spinal metastases in renal cell carcinoma: a critical review. Crit Rev Oncol Hematol. 2018;125:19‐29. doi:10.1016/j.critrevonc.2018.02.017 - DOI - PubMed
    1. Sung H, Ferlay J, Siegel RL, et al. Global cancer statistics 2020: GLOBOCAN estimates of incidence and mortality worldwide for 36 cancers in 185 countries. CA Cancer J Clin. 2021;71(3):209‐249. doi:10.3322/caac.21660 - DOI - PubMed
    1. Yu TA, Hui XI, You‐Fu PA. Research progress on the tumor suppressor gene PBRM1 in renal cell carcinoma. Med J Chin People's Lib Army. 2021;46(7):724‐730.
    1. Hargreaves DC, Crabtree GR. ATP‐dependent chromatin remodeling: genetics, genomics and mechanisms. Cell Res. 2011;21(3):396‐420. - PMC - PubMed
    1. Hargreaves DC. Chromatin openness requires continuous SWI/SNF activity. Nat Genet. 2021;53(3):263‐264. doi:10.1038/s41588-021-00781-7 - DOI - PMC - PubMed

Publication types

MeSH terms

Associated data