

The relative contribution of diurnal and nocturnal glucose exposures to HbA1c in type 1 diabetes males: a pooled analysis
- PMID: 35673512
- PMCID: PMC9167262
- DOI: 10.1007/s40200-022-01015-1
The relative contribution of diurnal and nocturnal glucose exposures to HbA1c in type 1 diabetes males: a pooled analysis
Abstract
Purpose: The exact contribution of daily glucose exposure to HbA1c in people with type 1 diabetes (T1D) remains controversial. We examined the contribution of pre- and postprandial glycaemia, nocturnal and early-morning glycaemia, and glycaemic variability to HbA1c levels in T1D. In this analysis, we used clinical data, namely age, BMI and HbA1c, as well as glycaemic metrics (24-h glycaemia, postprandial, nocturnal, early-morning glycaemia, wake-up glucose, and glycaemic variability) obtained over a four-week period of continuous glucose monitoring (CGM) wear in thirty-two males with T1D.
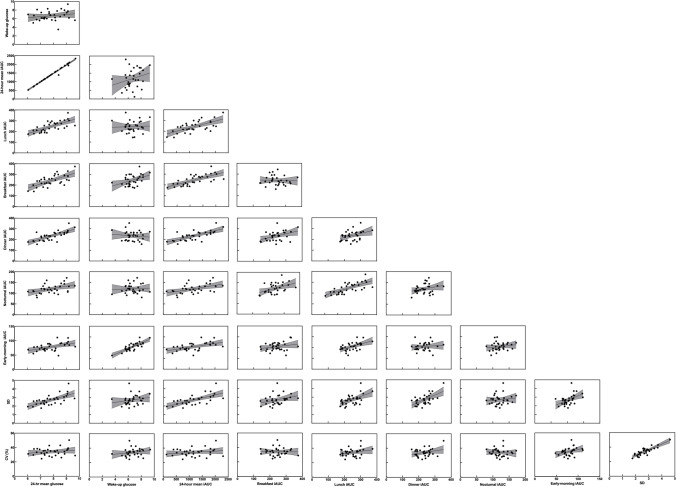
Methods: The trapezoid method was used estimate the incremental area under the glucose curve (iAUC) for 24-h, postprandial (3-h period following breakfast, lunch, and dinner, respectively), nocturnal (between 24:00-04:00 AM), and early-morning (2-h period 2-h prior to wake-up) glycaemia. Linear regression analysis was employed whereby CGM-derived glycaemic metrics were explanatory variables and HbA1c was the outcome.
Results: Thirty-two T1D males (mean ± SD: age 29 ± 4 years; HbA1c 7.3 ± 0.9% [56 ± 13 mmol/mol]; BMI 25.80 ± 5.01 kg/m2) were included in this analysis. In linear models adjusted for age and BMI, HbA1c was associated with 24-h mean glucose (r 2 = 0.735, p < 0.001), SD (r 2 = 0.643, p = 0.039), and dinner iAUC (r 2 = 0.711, p = 0.001). CGM-derived metrics and non-glycaemic factors explained 77% of the variance in HbA1c, in which postprandial glucose accounted for 32% of the variance explained. The single greatest contributor to HbA1c was dinner iAUC resulting in 0.6%-point (~7 mmol/mol) increase in HbA1c per SD increase in dinner iAUC.
Conclusions: Using comprehensive CGM profiling, we show that postprandial glucose, specifically evening-time postprandial glucose, is the single largest contributing factor to HbA1c in T1D.
Trial registration number: NCT02204839 (July 30th 2014); NCT02595658 (November 3rd 2015).
Keywords: CGM; Glucose variability; HbA1c; Postprandial glucose; Type 1 diabetes.
© The Author(s) 2022.
Conflict of interest statement
Conflicts of interest/ Competing interestsNo conflicts of interest or competing interests relevant to this article are reported.
Figures


References
Associated data
LinkOut - more resources
Full Text Sources
Medical
