. 2022 Mar 1;22(5):4569-4580.
doi: 10.1109/JSEN.2022.3145587. Epub 2022 Jan 21.

Scalp-Mounted Electrical Impedance Tomography of Cerebral Hemodynamics

Affiliations

Scalp-Mounted Electrical Impedance Tomography of Cerebral Hemodynamics

Taweechai Ouypornkochagorn et al. IEEE Sens J. .

Abstract

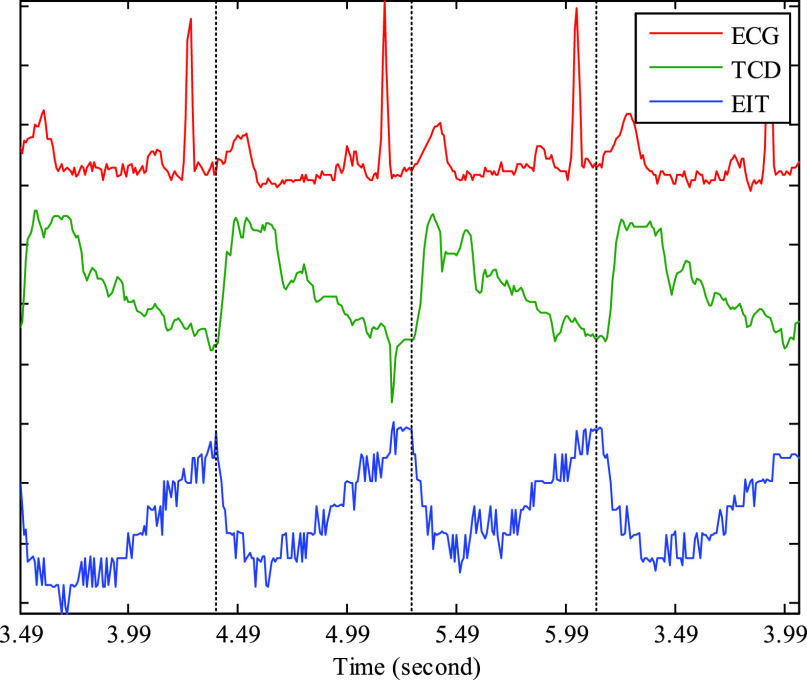
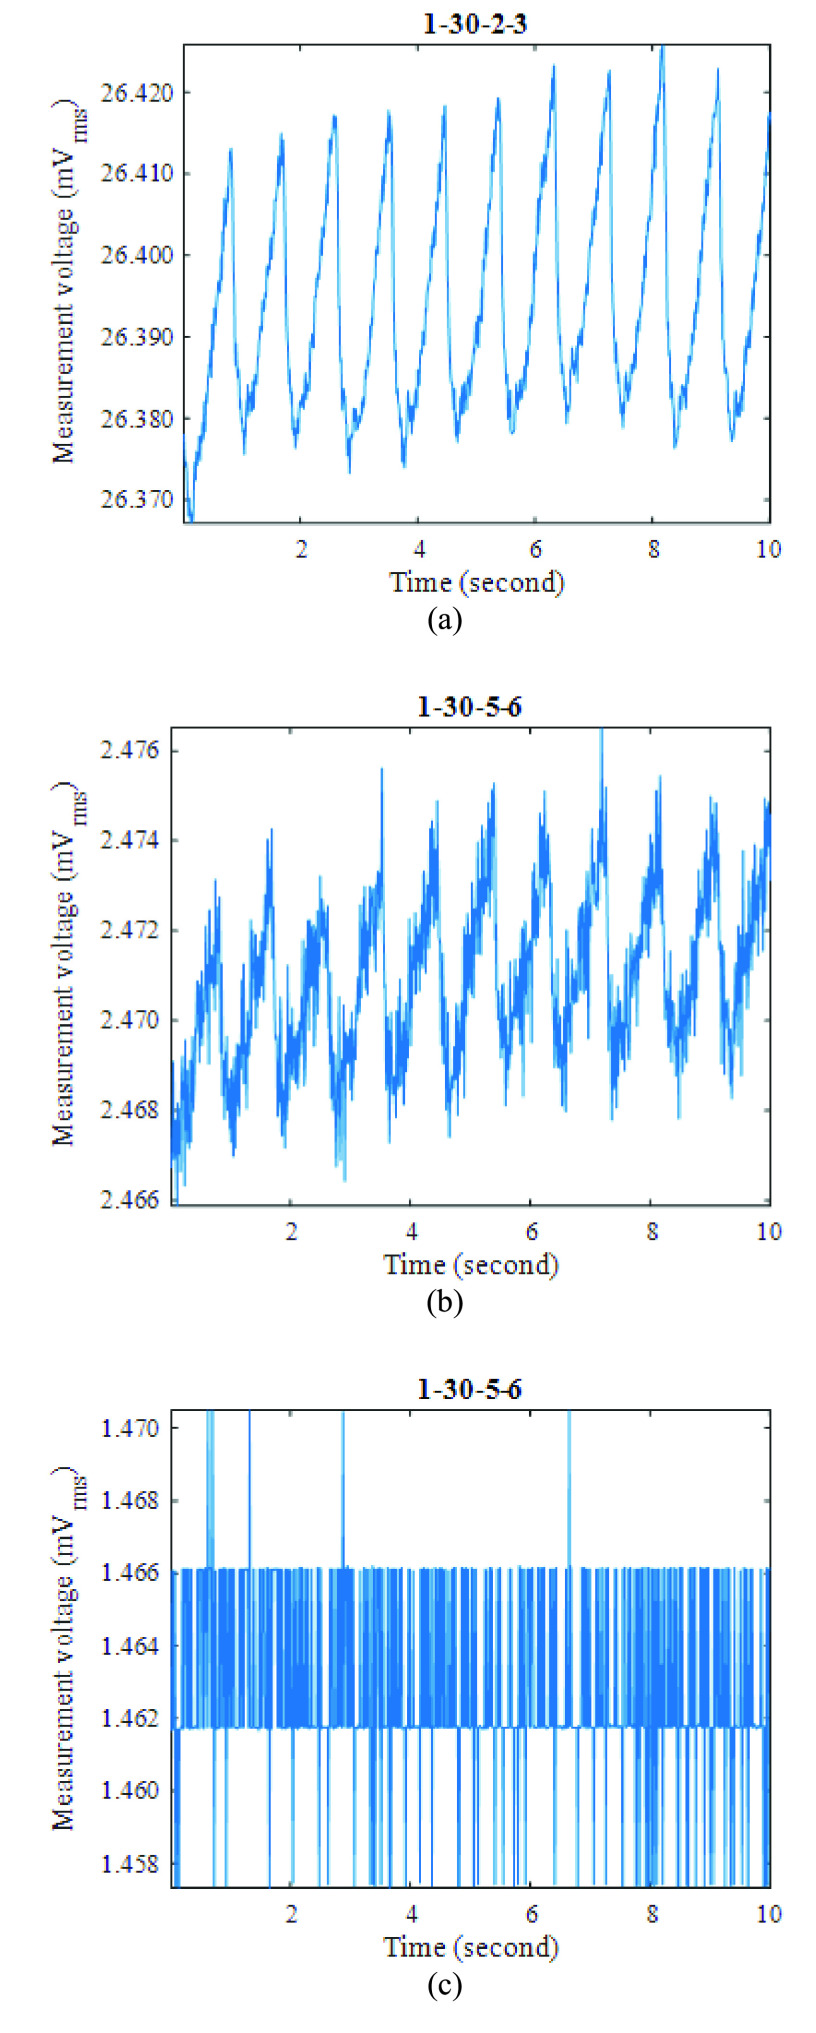
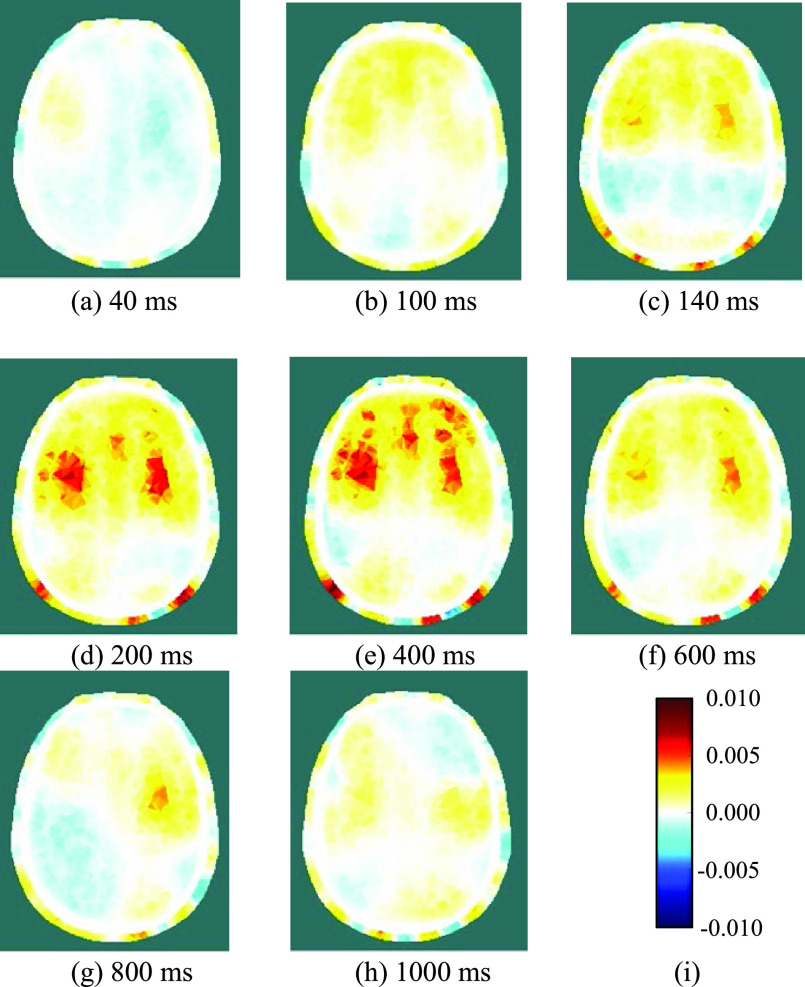
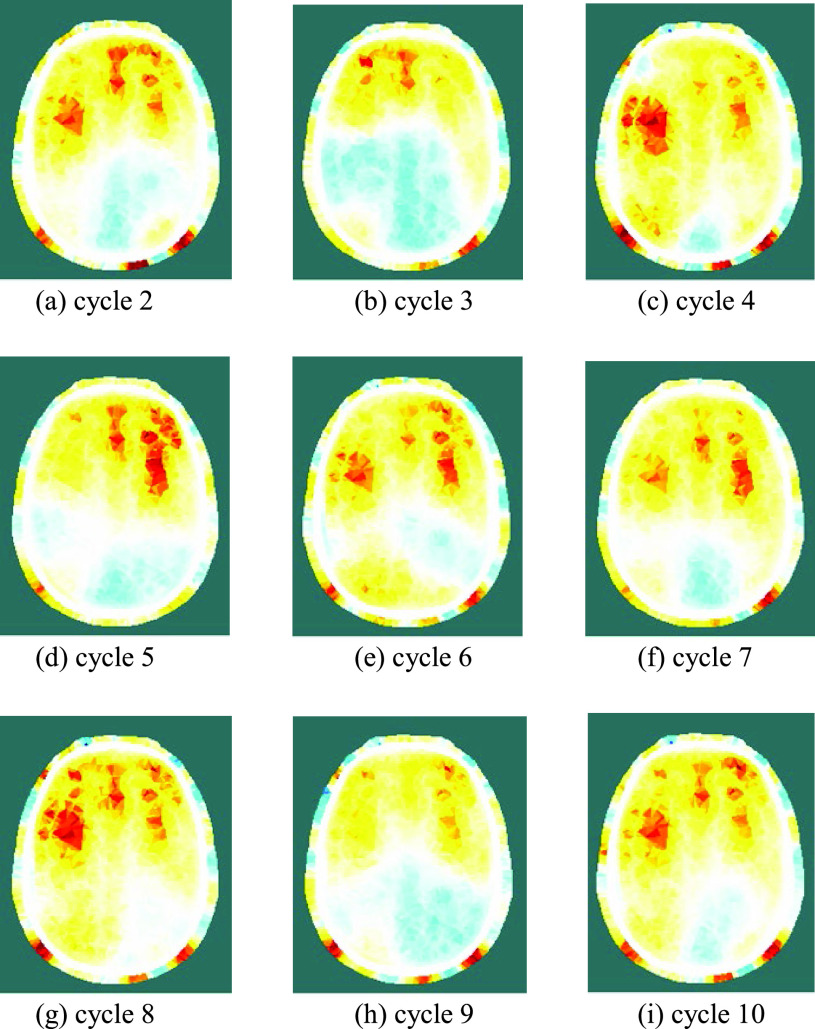
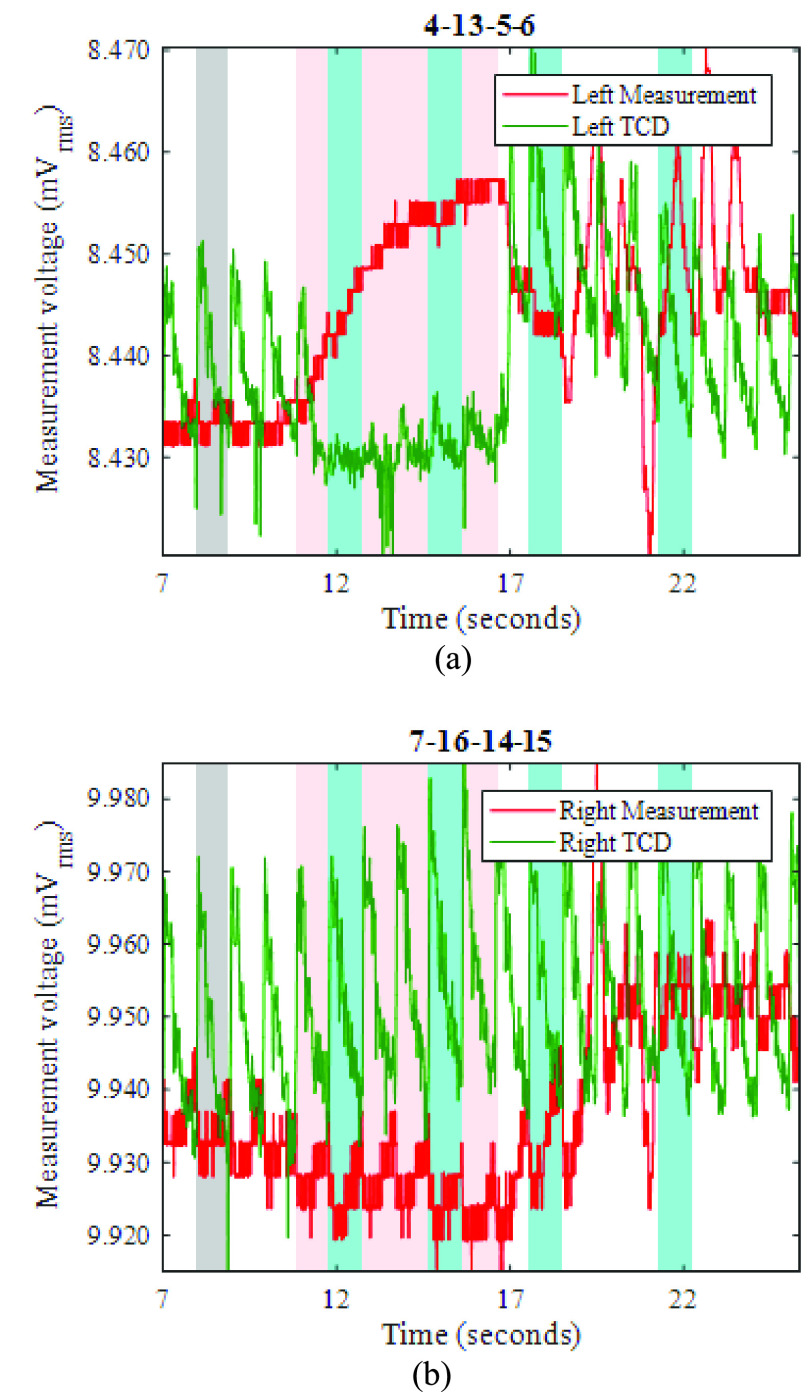
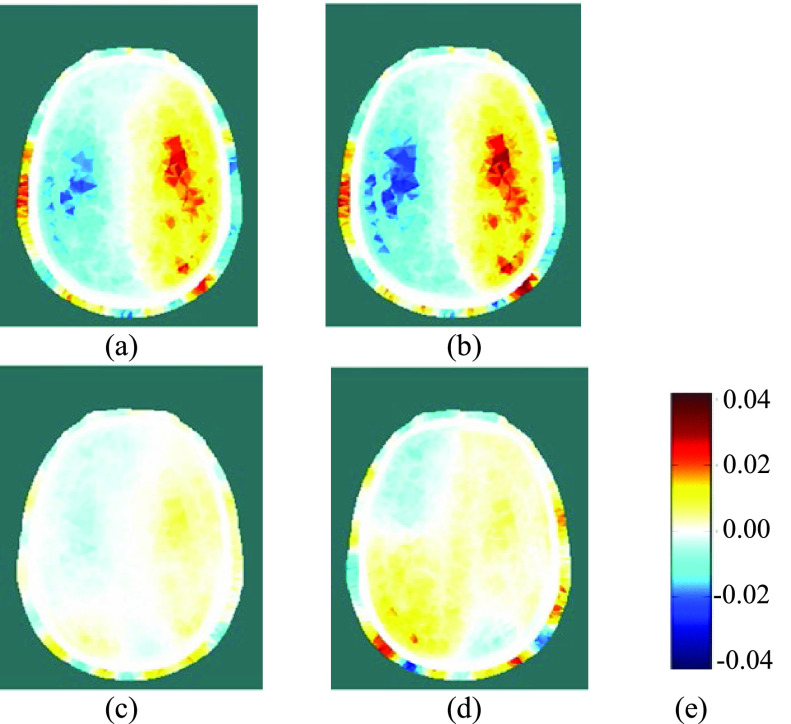
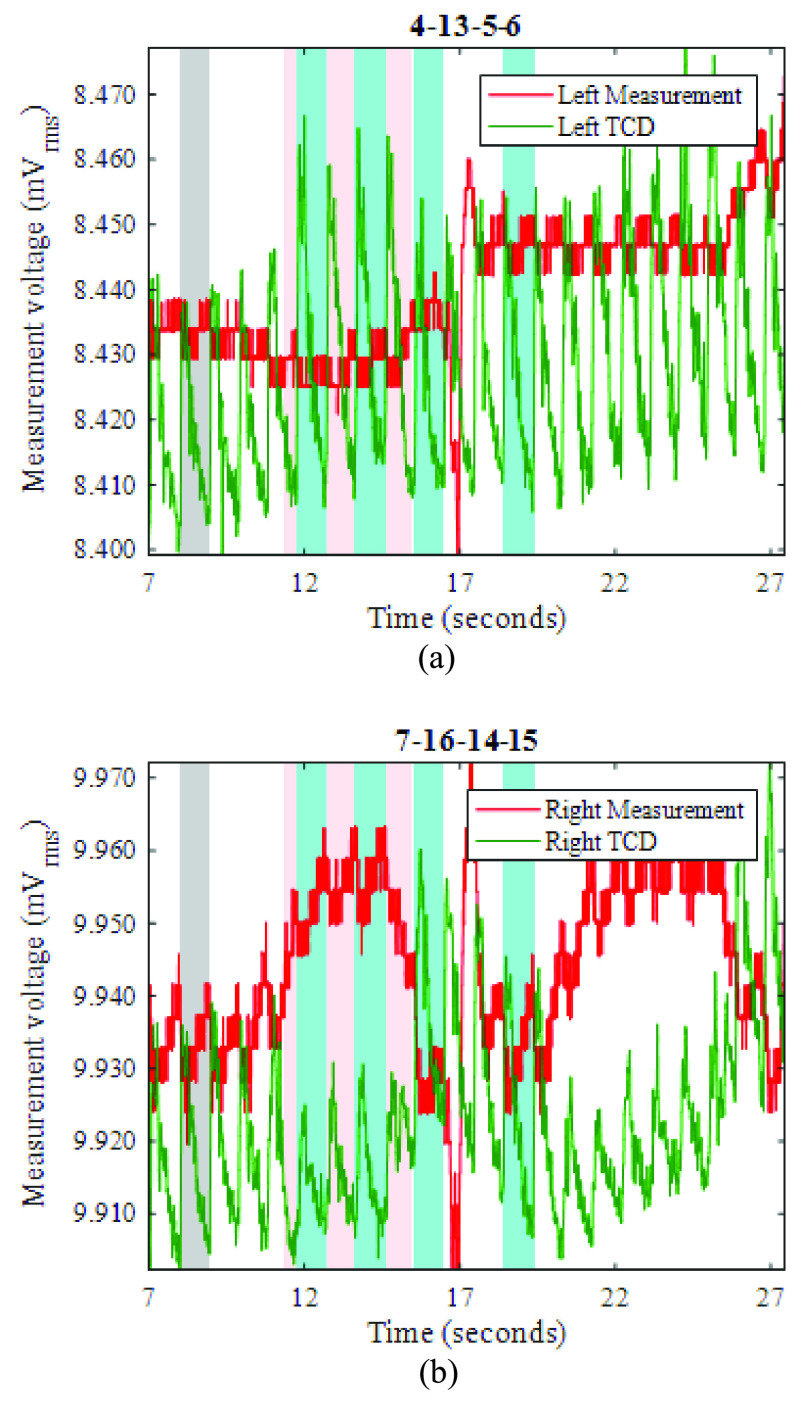
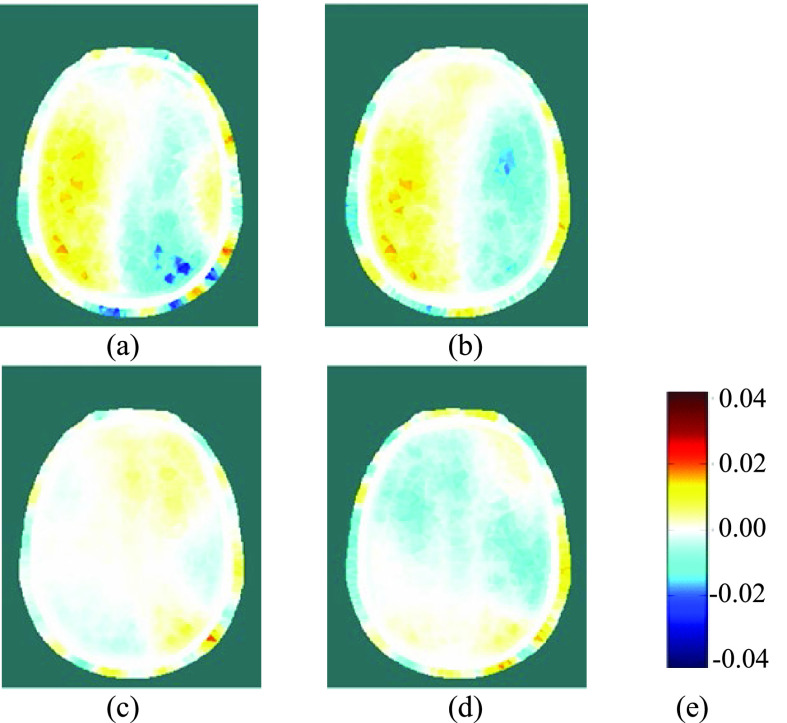
An Electrical Impedance Tomography (EIT) system has been developed for dynamic three-dimensional imaging of changes in conductivity distribution in the human head, using scalp-mounted electrodes. We attribute these images to changes in cerebral perfusion. At 100 frames per second (fps), voltage measurement is achieved with full-scale signal-to-noise ratio of 105 dB and common-mode rejection ratio > 90 dB. A novel nonlinear method is presented for 3-D imaging of the difference in conductivity distribution in the head, relative to a reference time. The method achieves much reduced modelling error. It successfully localizes conductivity inclusions in experimental and simulation tests, where previous methods fail. For > 50 human volunteers, the rheoencephalography (REG) waveform is observed in EIT voltage measurements for every volunteer, with peak-to-peak amplitudes up to approx. 50 μVrms. Images are presented of the change in conductivity distribution during the REG/cardiac cycle, at 50 fps, showing maximum local conductivity change of approx. 1% in grey/white matter. A total of 17 tests were performed during short (typically 5s) carotid artery occlusions on 5 volunteers, monitored by Transcranial Doppler ultrasound. From EIT measurements averaged over complete REG/cardiac cycles, 13 occlusion tests showed consistently decreased conductivity of cerebral regions on the occluded side, and increased conductivity on the opposite side. The maximum local conductivity change during occlusion was approx. 20%. The simplicity of the carotid artery intervention provides a striking validation of the scalp-mounted measurement system in imaging cerebral hemodynamics, and the REG images indicate its unique combination of sensitivity and temporal resolution.

Keywords: Cerebral; EIT; REG; SNR; THR; electrical impedance tomography; hemodynamic; rheoencephalogram; transient hyperemic response.


Figures

Fig. 1.
Fig. 1.
The fEITER electrode array (head anterior is at the top).
Fig. 2.
Fig. 2.
The green dashed line shows the position of the 2-dimensional cross-section used in Figs. 7, 8, 10 and 12 below. The dark circles show the electrodes visible from the right of the subject. The graded blue-grey area shows the white and grey matter (projected).
Fig. 3.
Fig. 3.
Reconstructed images of a carrot inclusion (shown by the red circle) in a saline solution within a head-shaped tank: (a) carrot in left-of-center region; (b) carrot in right-of-center region; (c) color legend of conductivity difference (S/m).
Fig. 4.
Fig. 4.
Reconstructed images (axial and sagittal views, sectioned at the CoG) of conductivity change due to introducing the “blood” sphere in four different locations indicated by the red circles (showing the projection of the sphere onto the CoG cut planes): top 2 rows, using the traditional method, with no noise; middle 2 rows, using the new method, with no noise; bottom 2 rows, using the new method, with 70 dB SNR. The location of the nose is at the top in the axial images, and on the right for the sagittal images. The numerical range associated with the color scale of conductivity change is varied between simulations to best illustrate the localization performance in each case, but it is fixed within each pair of views (axial and sagittal).
Fig. 5.
Fig. 5.
Examples of the time course of simultaneous recordings from ECG, TCD and fEITER Mk. I systems (measurement 1-10-2-3).
Fig. 6.
Fig. 6.
Examples of EIT measurements on a resting subject (electrode configurations indicated): (a) and (b) with fEITER Mk. II; and (c) same configuration as in (b), but with fEITER Mk. I (on a different subject).
Fig. 7.
Fig. 7.
(a)-(h) Reconstructed images of conductivity change during a single REG cycle, at the indicated times after the reference period; (i) legend for all images, depicting the change in conductivity (units S/m).
Fig. 8.
Fig. 8.
Reconstructed images of conductivity change during the REG cycle, at 200 ms post-reference, for 9 consecutive cycles immediately after the cycle shown in Fig. 7 (cycle 1). The legend is shown in Fig. 7(i).
Fig. 9.
Fig. 9.
For LEFT carotid artery occlusion during the period 11.0-16.8s (shaded pink), EIT measurements (red) and TCD measurements (green), recorded near (a) the left ear, and (b) the right ear. Grey shading shows the reference period for EIT image reconstruction.
Fig. 10.
Fig. 10.
(a) and (b): Reconstructed EIT images during LEFT carotid artery occlusion (the first two blue-shaded periods in Fig. 9); (c) and (d): Reconstructed EIT images after relief of the occlusion (the last two blue-shaded periods in Fig. 9); (e): colour legend, depicting the change in conductivity, in S/m.
Fig. 11.
Fig. 11.
For RIGHT carotid artery occlusion during the period 10.9-15.0s (shaded pink), EIT measurements (red) and TCD measurements (green), recorded near (a) the left ear, and (b) the right ear. Grey shading shows the reference period for EIT image reconstruction.
Fig. 12.
Fig. 12.
(a) and (b): Reconstructed EIT images during RIGHT carotid artery occlusion (the first two blue-shaded periods in Fig. 11); (c) and (d): Reconstructed EIT images after relief of the occlusion (the last two blue-shaded periods in Fig. 11); (e): colour legend, depicting the change in conductivity, in S/m.

Similar articles

Cited by

References

    1. Hahn G.et al., “Imaging pathologic pulmonary air and fluid accumulation by functional and absolute EIT,” Physiol. Meas., vol. 27, no. 5, pp. S187–S198, May 2006. - PubMed
    1. Crabb M. G.et al., “Mutual information as a measure of image quality for 3D dynamic lung imaging with EIT,” Physiol. Meas., vol. 35, no. 5, pp. 863–879, May 2014. - PMC - PubMed
    1. Frerichs I.et al., “Chest electrical impedance tomography examination, data analysis, terminology, clinical use and recommendations: Consensus statement of the translational EIT development study group,” Thorax, vol. 72, no. 1, pp. 83–93, 2017. - PMC - PubMed
    1. Wu Y., Jiang D., Bardill A., de Gelidi S., Bayford R., and Demosthenous A., “A high frame rate wearable EIT system using active electrode ASICs for lung respiration and heart rate monitoring,” IEEE Trans. Circuits Syst. I, Reg. Papers, vol. 65, no. 11, pp. 3810–3820, Nov. 2018.
    1. Tidswell T., Gibson A., Bayford R. H., and Holder D. S., “Three-dimensional electrical impedance tomography of human brain activity,” NeuroImage, vol. 13, pp. 283–294, Feb. 2001. - PubMed

LinkOut - more resources