. 2022 May 16;12(9):4200-4220.
doi: 10.7150/thno.70896. eCollection 2022.

Inflammatory endothelium-targeted and cathepsin responsive nanoparticles are effective against atherosclerosis

Affiliations

Inflammatory endothelium-targeted and cathepsin responsive nanoparticles are effective against atherosclerosis

Fei Fang et al. Theranostics. .

Abstract

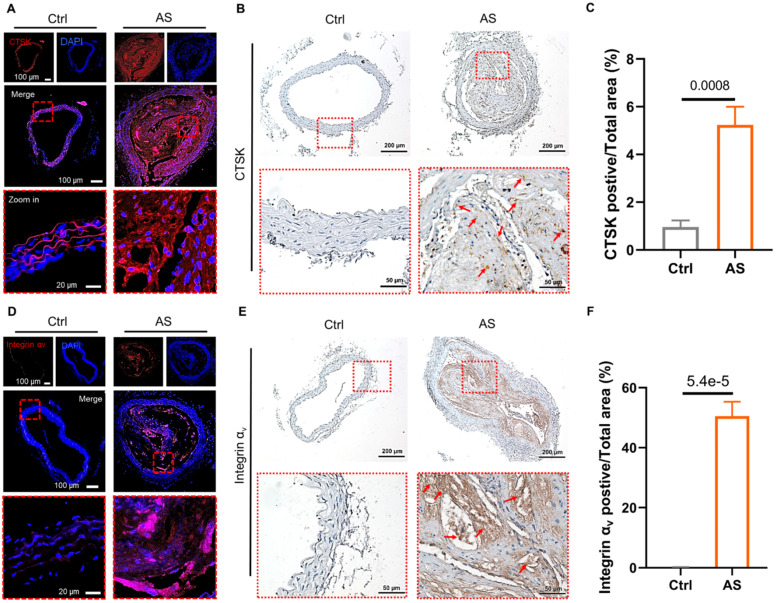
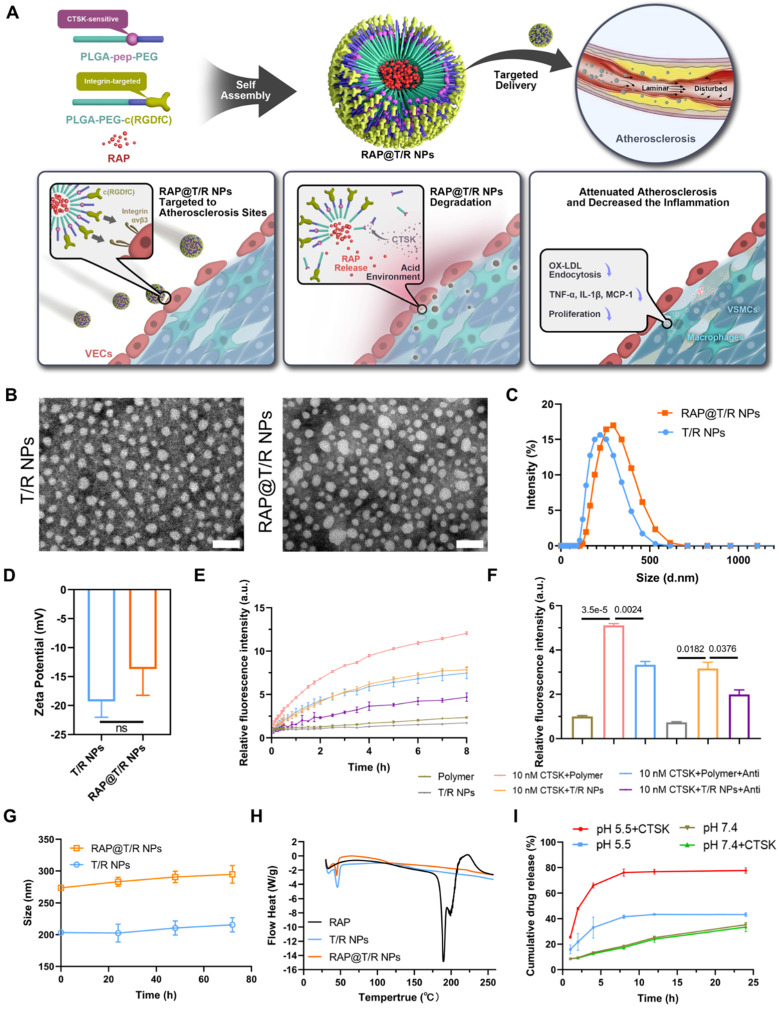
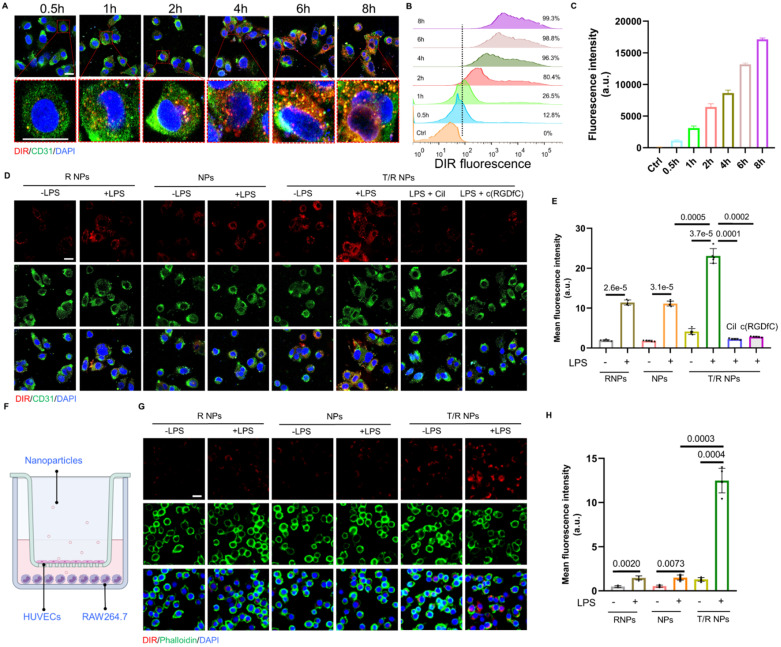
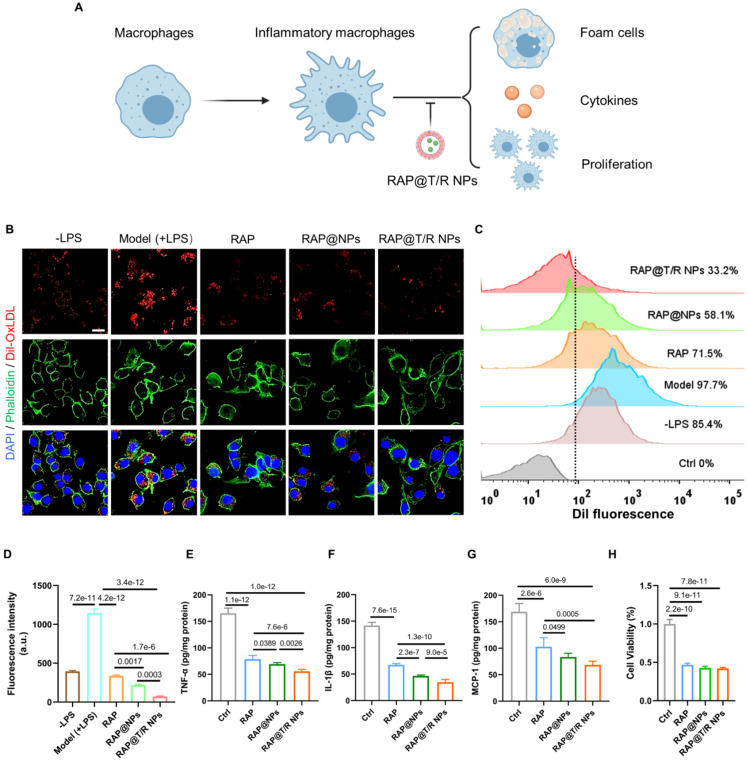
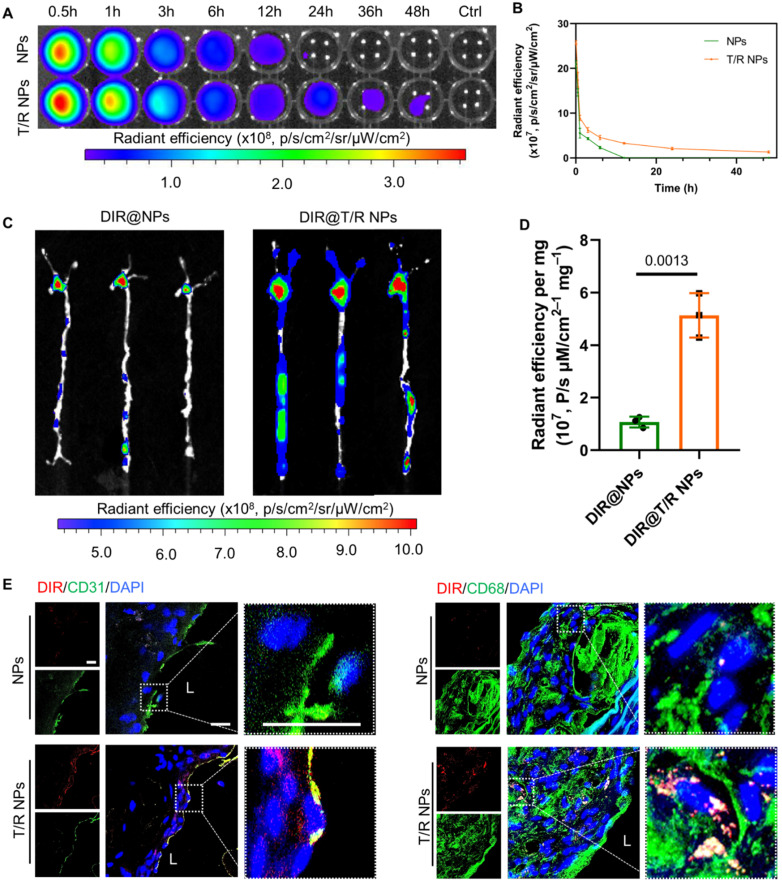
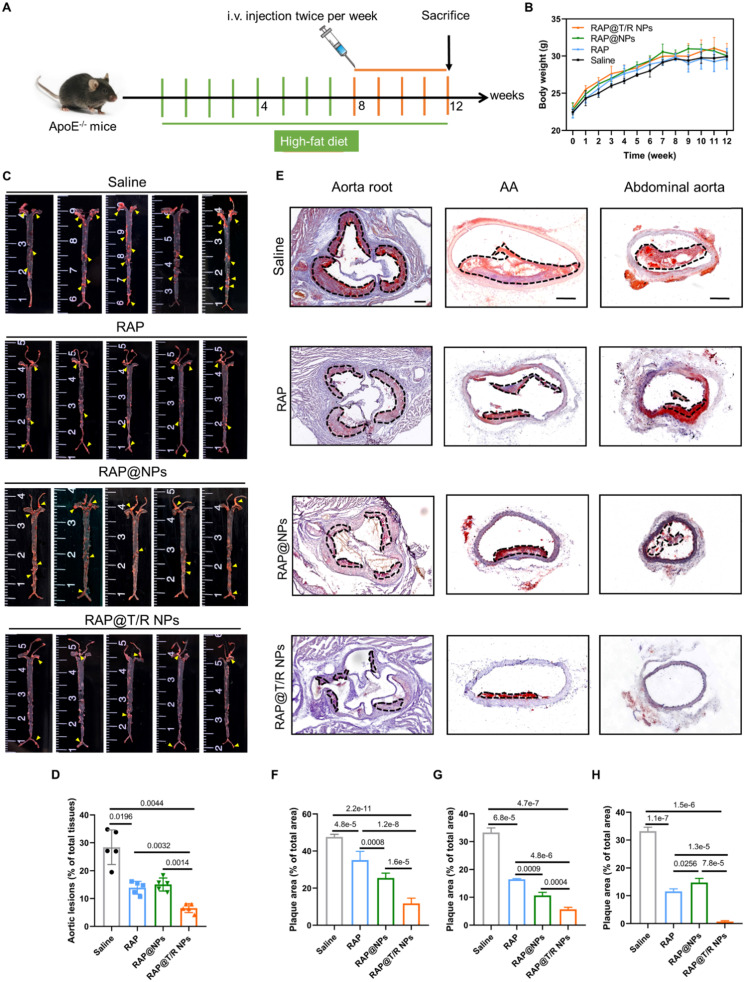
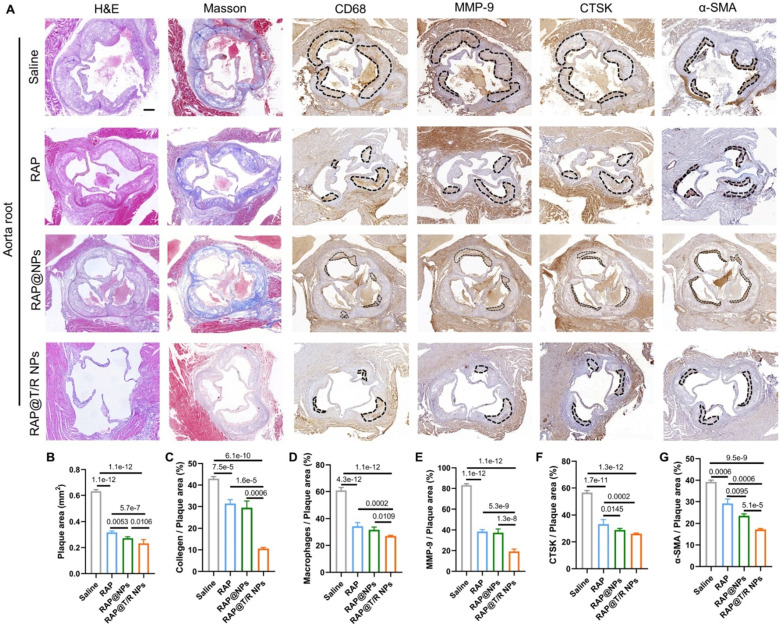
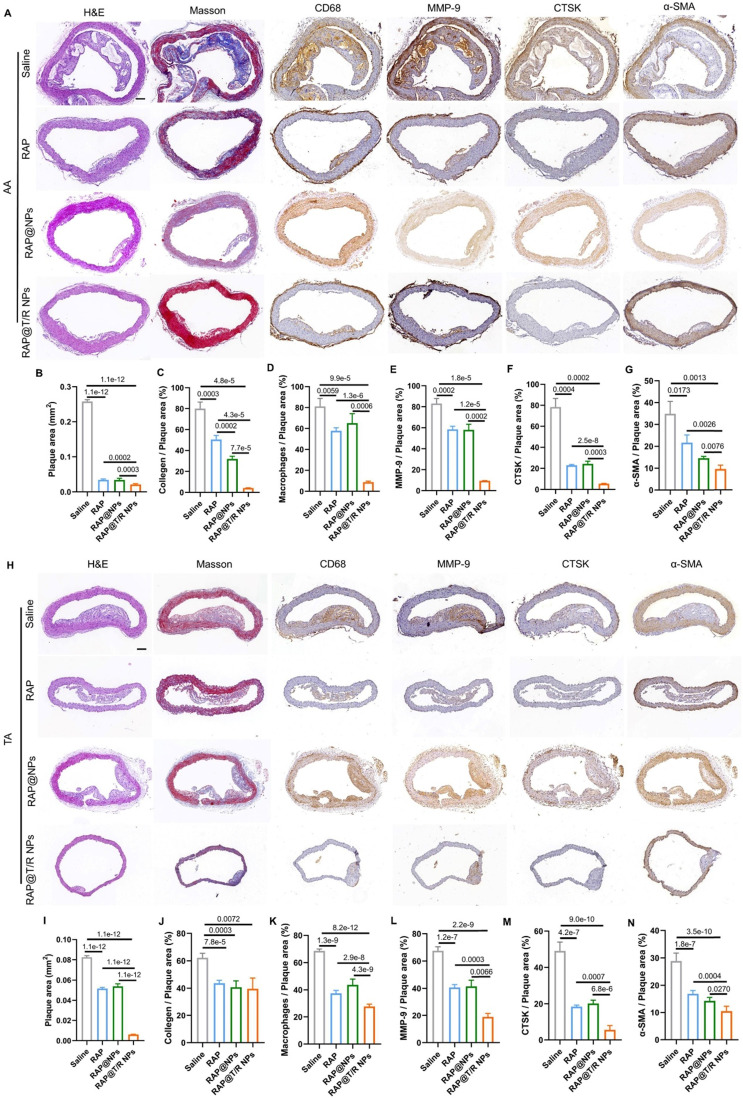
Rationale: Atherosclerosis is characterized by lipid accumulation, plaque formation, and artery stenosis. The pharmacological treatment is a promising therapy for atherosclerosis, but this approach faces major challenges such as targeted drug delivery, controlled release, and non-specific clearance. Methods: Based on the finding that the cathepsin k (CTSK) enzyme is enriched in atherosclerotic lesions, we constructed an integrin αvβ3 targeted and CTSK-responsive nanoparticle to control the release of rapamycin (RAP) locally. The targeted and responsive nanoparticles (T/R NPs) were engineered by the self-assembly of a targeting polymer PLGA-PEG-c(RGDfC) and a CTSK-sensitive polymer PLGA-Pep-PEG. PLGA-Pep-PEG was also modified with a pair of FRET probe to monitor the hydrolysis events. Results: Our results indicated that RAP@T/R NPs accelerated the release of RAP in response to CTSK stimulation in vitro, which significantly inhibited the phagocytosis of OxLDL and the release of cytokines by inflammatory macrophages. Additionally, T/R NPs had prolonged blood retention time and increased accumulation in the early and late stage of atherosclerosis lesions. RAP@T/R NPs significantly blocked the development of atherosclerosis and suppressed the systemic and local inflammation in ApoE-/- mice. Conclusions: RAP@T/R NPs hold a great promise as a drug delivery system for safer and more efficient therapy of atherosclerosis.

Keywords: atherosclerosis; cathepsin k; drug delivery; nanoparticles; rapamycin.


Conflict of interest statement

Competing Interests: The authors have declared that no competing interest exists.

Figures

Figure 1
Figure 1
Histological assays for CTSK and integrin αv in atherosclerosis. (A and D) Typical immunofluorescence image of CTSK and integrin αv in mouse aorta, respectively. (B and E) IHC images of CTSK and integrin αv in mouse aorta, respectively (Designated regions indicated by red square frames in Figures are enlarged to show the details). (C and F) Quantitative IHC analysis of CTSK and integrin αv positive area percentage, respectively (n = 3). Ctrl: control; AS: atherosclerosis.
Figure 2
Figure 2
Schematic of engineering of CTSK sensitive NPs and targeted therapy of atherosclerosis and characterization of nanoparticles. (A) Schematic diagram of the components of the RAP@T/R NPs and targeted delivery RAP to treat atherosclerosis in response to CTSK. (B) Typical TEM images of T/R NPs and RAP@T/R NPs (Scale bar: 500 nm). (C) Size distribution profile and zeta potential (D) of T/R NPs and RAP@T/R NPs were measured using DLS analysis (n = 3). (E) The fluorescence intensity profile of PLGA-Pep-PEG and T/R NPs being incubated with or without CTSK enzyme in vitro at pH 5.5 (Polymer: PLGA-Pep-PEG, Anti: CTSK antibody). (F) PLGA-Pep-PEG and T/R NPs incubated with CTSK enzyme for 8 hours increase the fluorescence intensity absorption (n = 3). (G) Variation of size of RAP@T/R NPs in FBS 10% during 72 hours (n = 3). (H) DSC spectrum of free RAP, T/R NPs, and RAP@T/R NPs. (I) In vitro drug release of RAP@T/R NPs in the presence or absence of CTSK enzyme (n = 3).
Figure 3
Figure 3
Cellular uptake of T/R NPs in HUVECs and trans-endothelial transport capacity of T/R NPs. (A) Confocal microscopy image of time-dependent cellular uptake of DIR@T/R NP (Scale bar: 20 µm). (B) Flow cytometry analysis of HUVECs uptake of DIR@T/R NPs. (C) Quantification of cellular uptake of DIR@T/R NPs in HUVECs at different time points (n = 3). (D) Cellular uptake of DIR@T/R NPs in HUVECs in the presence or absence of LPS as demonstrated by CLSM (Scale bar: 20 µm) and their mean fluorescence intensity (E) (n = 3). (F) Schematic illustration of the coculture model used. (G) Confocal microscopy images and mean fluorescence intensity (H) of DIR@T/R NPs in RAW264.7 cells in the bottom chamber (Scale bar: 20 µm) (n = 3).
Figure 4
Figure 4
The therapeutic effect of RAP@T/R NPs in vitro. (A) RAP@T/R NPs Inhibit the formation of foam cells, releasing cytokines, and proliferation of macrophages. (B) RAP@T/R NPs inhibit phagocytosis of Dil-OxLDL by inflammatory macrophages (Scale bar: 20 µm). (C) Characterization of RAP@T/R NPs inhibits phagocytosis of Dil-OxLDL by inflammatory macrophages by flow cytometry (control groups: RAW264.7 cells without any treatment). (D) Quantification of uptake of Dil-OxLDL in inflammatory macrophages by flow cytometry. (E-G) ELISA detected typical inflammatory cytokines TNF-α (D), IL-1β (E), and MCP-1 (F) secreted by LPS treated RAW264.7 cells. (H) The cell viability of RAW264.7 cells after treatment RAP@T/R NPs. Data in (D-H) are mean ± SD (n = 3).
Figure 5
Figure 5
In vivo circulation and targeting capability of T/R NPs in mice after i.v. administration. (A) Ex vivo image of whole blood collected at various time points after i.v. DIR@NPs and DIR@T/R NPs into C57BL/6 mice, and the fluorescence intensities quantification (B). (C) Ex vivo fluorescence images and (D) quantitative analysis of DIR fluorescence in aorta 6 hours after DIR@NPs and DIR@T/R NPs injection into established atherosclerotic mice. (E) CLSM analysis of the co-location of DIR@T/R NPs (red) and endothelial cells (green), or DIR@T/R NPs (red) and macrophages (green) in atherosclerotic plaques. Data in (B and D) are mean ± SD (n = 3).
Figure 6
Figure 6
Therapeutic effects of i.v. administration of RAP@T/R NPs in ApoE-/- mice. (A) Schematic illustration of the treatment protocols. (B) The body weight changes in ApoE-/- mice were treated with various formulations (n = 15). (C) En face ORO-staining of aortas from ApoE-/- mice after treatment with different formulations (saline, RAP, RAP@NPs, RAP@T/R NPs at a dose of 0.5 mg/kg RAP twice a week, n = 5, plaque lesions: yellow arrowheads). (D) Quantitative analysis of lesion area in aorta tissues (n = 5). (E) ORO-stained cryosections of the aortic root, AA, and abdominal aorta (plaque lesions: dotted frame, Scale bar: 200 µm, n = 5). (F-H) Quantitative analysis of the relative plaque area in sections of the aortic root (F), AA (G), and abdominal aorta (H) (n = 4-5).
Figure 7
Figure 7
Histochemistry analysis of aortic root sections from ApoE-/- mice after different treatments. (A) Representative photographs of aortic root sections from ApoE-/- mice after treatment with different formulations (saline, RAP, RAP@NPs, RAP@T/R NPs at a dose of 0.5 mg/kg RAP twice a week) stained with H&E, Masson's trichrome, antibody to CD68, antibody to MMP-9, CTSK, and antibody to α-SMA (positive arear: dotted frame, Scale bar: 200 µm, n = 5). (B-G) Quantitative analysis of plaque area (B), collagen area relative to plaque area (C), macrophage area relative to plaque area (D), MMP-9 area relative to plaque area (E), CTSK area relative to plaque area (F), and VSMCs area relative to plaque area (G) (n = 5).
Figure 8
Figure 8
Histochemistry analysis of AA and TA sections from ApoE-/- mice after different treatments. (A and H) Representative photographs of AA and TA sections from ApoE-/- mice after treatment with different formulations (saline, RAP, RAP@NPs, RAP@T/R NPs at a dose of 0.5 mg/kg RAP twice a week) stained with H&E, Masson's trichrome, antibody to CD68, antibody to MMP-9, CTSK, and antibody to α-SMA (Scale bar: 100 µm). (B-G, I-N) Quantitative analysis of plaque area (B and I), collagen area relative to plaque area (C and J), positive macrophage area relative to plaque area (D and K), MMP-9 area relative to plaque area (E and L), CTSK area relative to plaque area (F and M), and VSMCs area relative to plaque area (G and N) in AA and TA. Data in (B-G, I-N) are mean ± SD (n = 5).

References

    1. Wolf D, Ley K. Immunity and Inflammation in Atherosclerosis. Circ Res. 2019;124:315–327. - PMC - PubMed
    1. Abdel-Maksoud MS, El-Gamal MI, Benhalilou DR, Ashraf S, Mohammed SA, Oh CH. Mechanistic/mammalian target of rapamycin: Recent pathological aspects and inhibitors. Med Res Rev. 2019;39:631–664. - PubMed
    1. Thompson PD, Panza G, Zaleski A, Taylor B. Statin-Associated Side Effects. J Am Coll Cardiol. 2016;67:2395–2410. - PubMed
    1. Chen J, Zhang X, Millican R, Sherwood J, Martin S, Jo H. et al. Recent advances in nanomaterials for therapy and diagnosis for atherosclerosis. Adv Drug Deliver Rev. 2021;170:142–199. - PMC - PubMed
    1. Feng S, Hu Y, Peng S, Han S, Tao H, Zhang Q. et al. Nanoparticles responsive to the inflammatory microenvironment for targeted treatment of arterial restenosis. Biomaterials. 2016;105:167–184. - PubMed

Publication types