. 2022 May 16;12(9):4330-4347.
doi: 10.7150/thno.71763. eCollection 2022.

PTRF/Cavin-1 enhances chemo-resistance and promotes temozolomide efflux through extracellular vesicles in glioblastoma

Affiliations

PTRF/Cavin-1 enhances chemo-resistance and promotes temozolomide efflux through extracellular vesicles in glioblastoma

Eryan Yang et al. Theranostics. .

Abstract

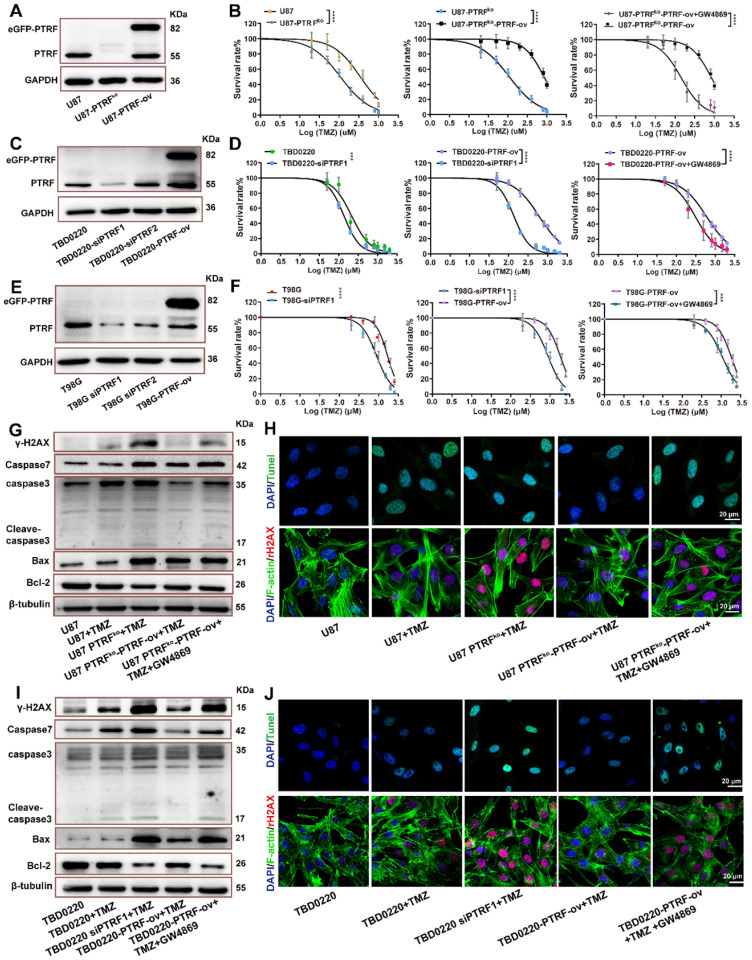
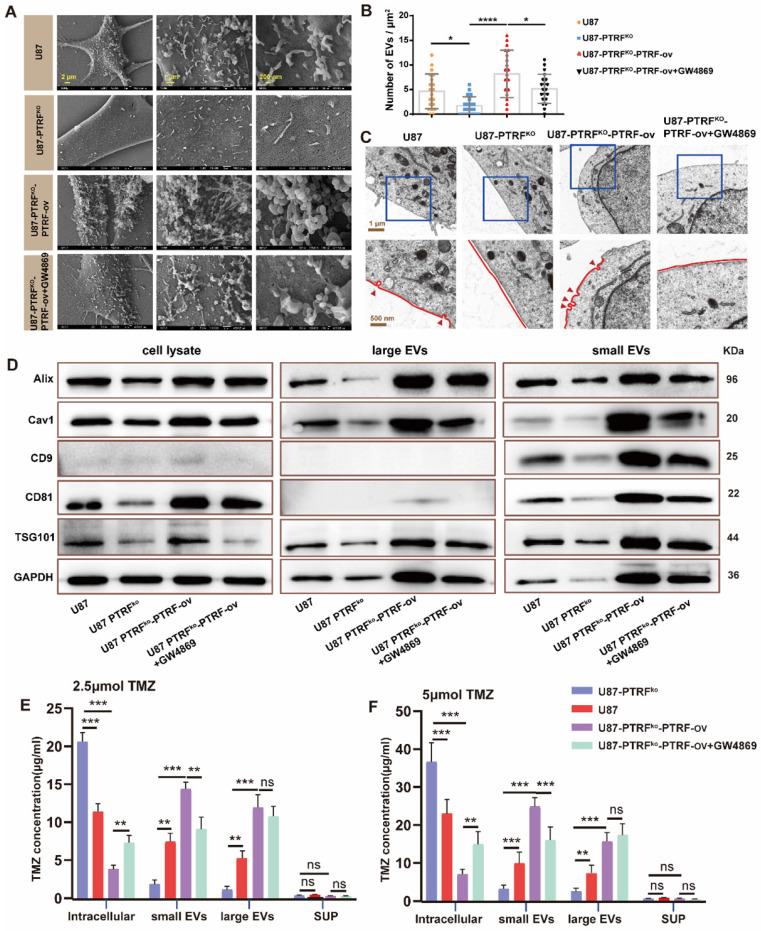
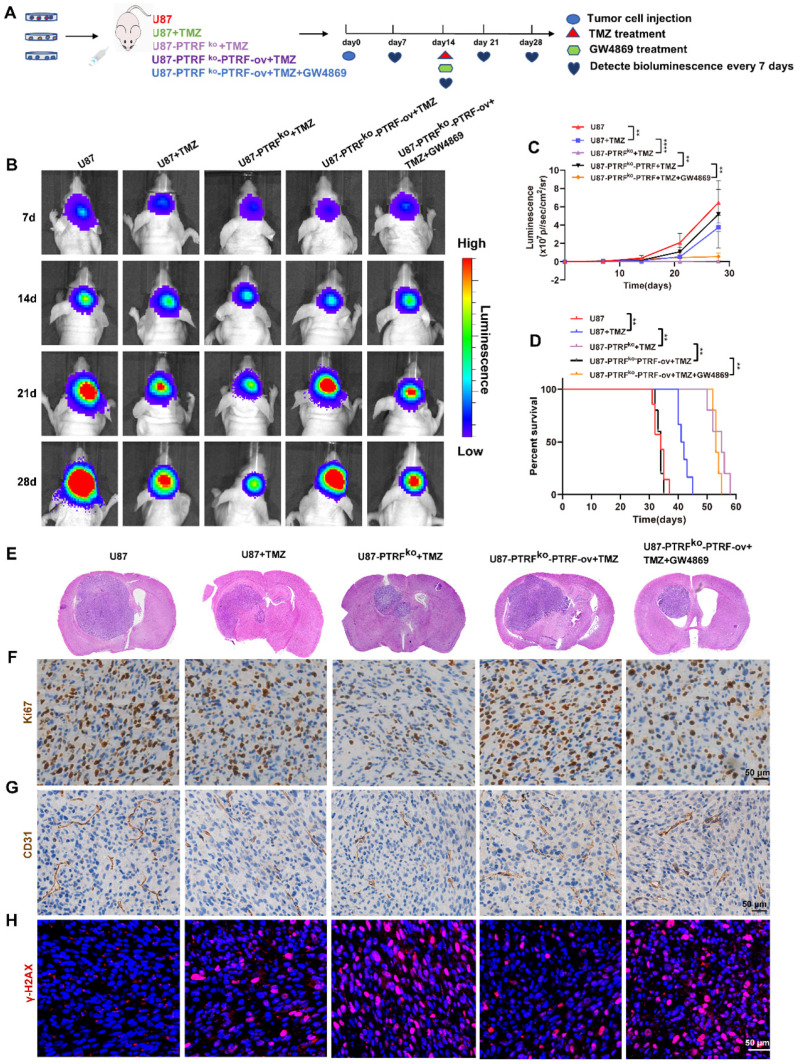
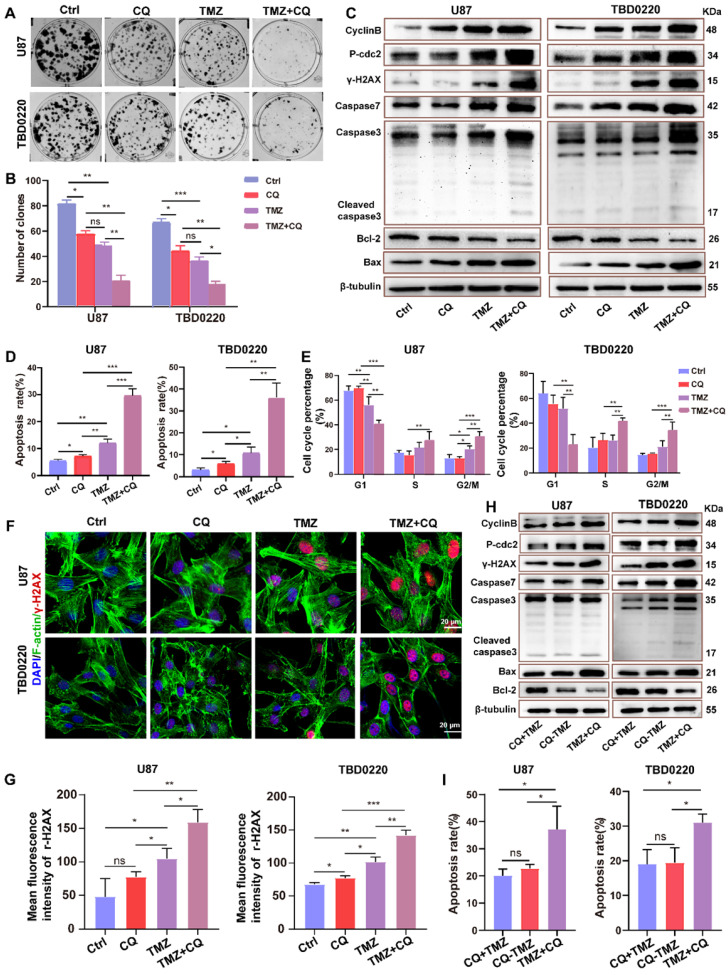
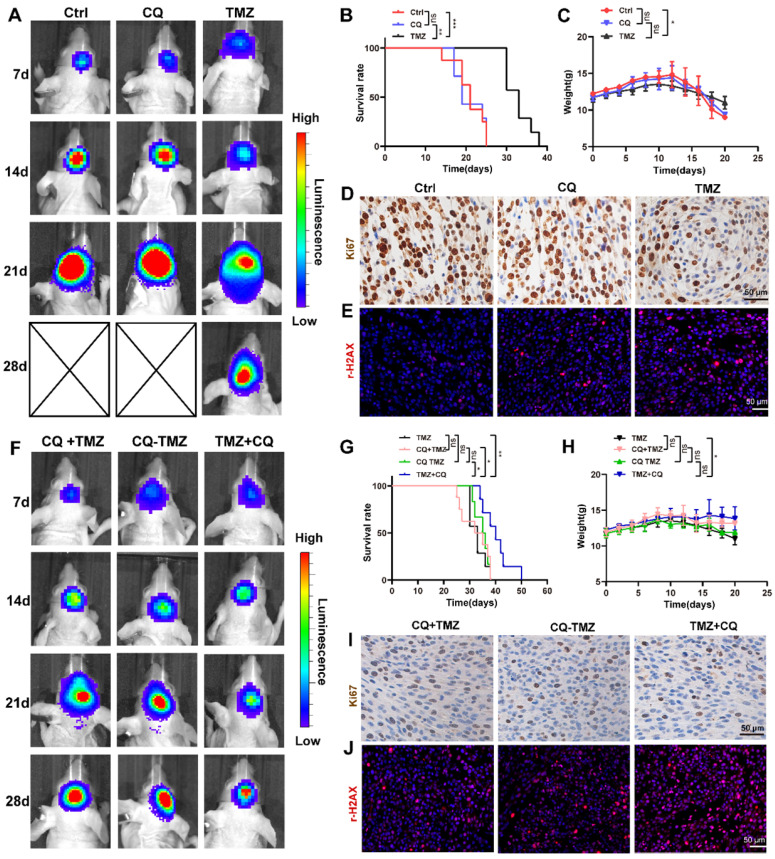
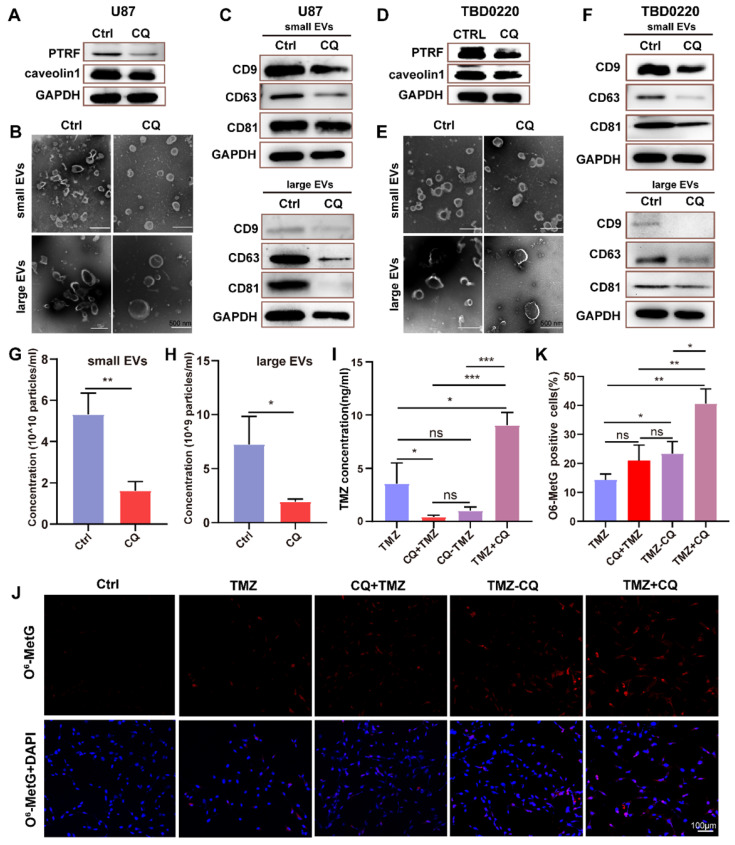
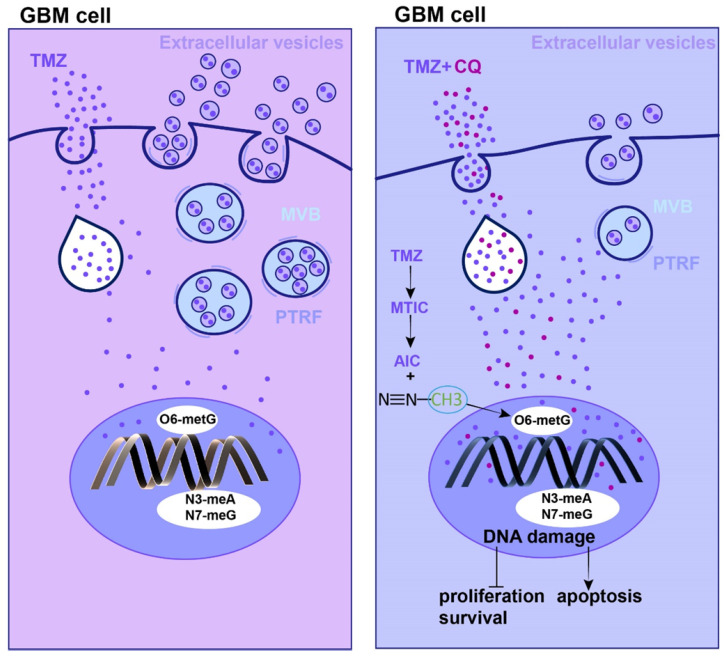
Background: The concentration and duration of intracellular drugs have always been the key factors for determining the efficacy of the treatment. Efflux of chemotherapeutic drugs or anticancer agents is a major reason for multidrug resistance generation in cancer cells. The high expression of polymerase I and transcript release factor (PTRF) is correlated with a worse prognosis in glioma patients. However, the importance of PTRF on temozolomide (TMZ) resistance in glioblastoma (GBM) is poorly understood. Methods: TCGA data analysis, CGGA data analysis, transmission electron microscopy (TEM), scanning electron microscopy (SEM), clone formation, cell counting kit-8 (cck-8), western blot (WB), immunofluorescence (IF), immunohistochemistry (IHC) and flow cytometry assays were performed to investigate the underlying mechanism and effect of PTRF on TMZ-resistance in a variety of GBM cell lines and GBM patient-derived xenograft (PDX) models. Clone formation, WB, IF, IHC and flow cytometry assays were performed to examine the efficacy of sequential therapy of TMZ followed by CQ in GBM cells and PDX models. Results: The prognosis of GBM patients treated with TMZ was negatively correlated with PTRF expression. Our results reveal that PTRF knockdown significantly decrease proliferation and increase apoptosis in GBM after TMZ treatment. Moreover, PTRF contribute to TMZ-resistance by increasing TMZ efflux through extracellular vesicles (EVs). Furthermore, our results demonstrate that sequential therapy of TMZ followed by CQ significantly promotes the TMZ efficacy against GBM by increasing intracellular TMZ concentration ([TMZ]i). Conclusion: This study highlights that PTRF can act as an independent biomarker to predict the prognosis of GBM patients after TMZ treatment and describes a new mechanism contributing to TMZ-resistance. In addition, this study may provide a novel idea for GBM therapy.

Keywords: Glioblastoma; PTRF; chloroquine; extracellular vesicles; temozolomide.


Conflict of interest statement

Competing Interests: The authors have declared that no competing interest exists.

Figures

Figure 1
Figure 1
High PTRF expression confers a worse prognosis of TMZ treatment in GBM patients. (A) Kaplan-Meier survival analysis of the expression levels of PTRF in GBM patients based on the microarray data. (B) Kaplan-Meier survival analysis of the expression levels of PTRF in TMZ-treated GBM patients based on the microarray data. (C) Kaplan-Meier survival analysis of GBM patients with unmethylated or methylated pMGMT with TMZ treatment based on the microarray data. (D-F) Kaplan-Meier survival analysis of the effect of PTRF expression level on MGMT unmethylated or methylated TMZ-treated GBM patients. (G-H) Univariate and multivariate analyses of the PTRF expression and other clinical information in relation to the overall survival in the TCGA GBM cohort.
Figure 2
Figure 2
PTRF enhances TMZ resistance. (A) Representative western blot images showing the expression of PTRF in U87, U87-PTRF-ov, and U87 PTRFko groups. (B) The cell survival rate was measured after TMZ treatment in U87, U87-PTRFko, U87-PTRFko-PTRF-ov, and U87-PTRFko-PTRF-ov+GW4869 groups. Data are represented as the mean ± SEM (n = 6). ****p < 0.0001. (C) Representative western blotting showing the expression of PTRF in TBD0220, TBD0220-siPTRF1 and TBD0220-PTRF-ov groups. (D) The cell survival rate was measured after TMZ treatment in TBD0220, TBD0220-siPTRF1, TBD0220-PTRF-ov, and TBD0220-PTRF-ov+GW4869 groups. Data are represented as the mean ± SEM (n = 6). ****p < 0.0001. (E) Representative western blotting showing the expression of PTRF in T98G, T98G-siPTRF and T98G-PTRF-ov groups. (F) The cell survival rate was measured after TMZ treatment in T98G, T98G-siPTRF1, T98G-PTRF-ov, and T98G-PTRF-ov+GW4869 groups. Data are represented as the mean ± SEM (n = 6). ***p < 0.001, ****p < 0.0001. (G) Western blot analysis showing the protein expression of bax, bcl-2, caspase 3, caspase 7, and γ-H2AX after TMZ treatment in U87, U87-PTRFko, U87-PTRFko-PTRF-ov, and U87-PTRFko-PTRF-ov+GW4869 groups. (H) IF showing the population of TUNEL and γ-H2AX positive cells after TMZ treatment in U87, U87-PTRFko, U87-PTRFko-PTRF-ov, and U87-PTRFko-PTRF-ov+GW4869 groups. Scale bar = 20 μm. (I) Representative western blotting showing the protein expression of bax, bcl-2, caspase 3, caspase 7, and γ-H2AX after TMZ treatment in TBD0220, TBD0220-siPTRF1, TBD0220-PTRF-ov, and TBD0220-PTRF-ov+GW4869 groups. (J) IF showing the population of TUNEL and γ-H2AX positive cells after TMZ treatment in TBD0220, TBD0220-siPTRF1, TBD0220-PTRF-ov, and TBD0220-PTRF-ov+GW4869 groups. Scale bar = 20 μm.
Figure 3
Figure 3
PTRF knockout increases intracellular TMZ concentration by decreasing the production of EVs. (A) SEM analysis of EVs produced from U87 cells. (B) The EV number was calculated in U87 cells. Data are represented as the mean ± SEM (n = 3). *p < 0.05, ****p < 0.0001. (C) TEM analysis of caveola in U87 cells. Red arrowheads represent caveolae. (D) Protein expression levels of Alix, CD81, CD9, cav1, TSG101 and GAPDH in EVs and cell lysate. (E) TMZ concentration in intracellular, small EVs, large EVs, and supernatant was analyzed by HPLC after 2.5 μmol TMZ treatment. Data are represented as the mean ± SEM (n = 3). **p < 0.01, ***p < 0.001, ns represents p > 0.05. (F) TMZ concentration in intracellular, small EVs, large EVs, and supernatant was analyzed by HPLC after 5 μmol TMZ treatment. Data are represented as the mean ± SEM (n = 3). **p < 0.01, ***p < 0.001, ns represents p > 0.05.
Figure 4
Figure 4
PTRF knockout enhances the efficacy of TMZ in orthotopic xenograft glioma mice. (A) Schematic illustration of the GBM orthotopic xenograft model. (B) Bioluminescence images of tumor growth after tumor implantation. n = 5-7 for each group. (C) Tumor growth curves by quantification of bioluminescent imaging signal intensities. Data are represented as the mean ± SEM (n = 5-7). **** p < 0.0001. (D) Kaplan-Meier survival curve of nude mice. Data are represented as the mean ± SEM (n = 5-7). **p < 0.01. (E) Representative images of H&E staining showing tumor volume in the nude mice. (F) IHC staining for Ki67 in brain tumor samples. Scale bar = 50 μm. (G) IHC of CD31 expression in the brain tumor. Scale bar = 50 μm. (H) IF of γH2AX expression in the brain tumor. Scale bar = 50 μm.
Figure 5
Figure 5
Sequential therapy of TMZ plus CQ promotes TMZ efficacy by increasing intracellular TMZ concentration. (A-B) A colony formation assay was performed in GBM cells. Data are represented as the mean ± SEM (n = 3). *p < 0.05, **p < 0.01, ***p < 0.001, ns represents p > 0.05. (C) Western blot analysis showing the protein expression of bax, bcl-2, caspase 3, caspase 7, cyclin B, p-cdc2, and γH2AX after TMZ and/or CQ treatment in GBM cells. (D) The apoptosis rate in GBM cells after TMZ and/or CQ treatment. Data are represented as the mean ± SEM (n = 3). *p < 0.05, **p < 0.01, ***p < 0.001. (E) Cell cycle distribution after exposure to TMZ and/or CQ in GBM cells. Data are represented as the mean ± SEM (n = 3). *p < 0.05, **p < 0.01, ***p < 0.001. (F-G) IF showing the population of γH2AX positive cells after treating with TMZ or CQ in GBM cells. Data are represented as the mean ± SEM (n = 3). *p < 0.05, **p < 0.01, ***p < 0.001, ns represents p > 0.05. (H) Protein levels of bax, bcl-2, caspase 3, caspase 7, γH2AX, p-cdc2 and cyclinB in CQ+TMZ, CQ-TMZ, and TMZ+CQ treatment groups. (I) Apoptosis rate in CQ+TMZ, CQ-TMZ, and TMZ+CQ treatment groups. Data are represented as the mean ± SEM (n = 3). *p < 0.05, ns represents p > 0.05.
Figure 6
Figure 6
Sequential therapy of TMZ followed by CQ in orthotopic xenograft glioma mice. (A) ude mice after treating with TMZ or CQ. Data are represented as the mean ± SEM (n = 6-7). **p < 0.01, ***p < 0.001, ns represents p > 0.05. (C) Bodyweight of mice after TMZ or CQ treatment over time. Data are represented as the mean ± SEM (n = 6-7). *p < 0.05, ns represents p > 0.05. (D) IHC staining for Ki67 in brain tumor samples following TMZ or CQ treatment. Scale bar = 50 μm. (E) IF of γH2AX expression in the brain tumor after treating with TMZ or CQ. Scale bar = 50 μm. (F) Bioluminescence images of tumor growth in CQ+TMZ, CQ-TMZ, and TMZ+CQ groups after tumor implantation. (G) Kaplan-Meier survival curve in CQ+TMZ, CQ-TMZ, and TMZ+CQ groups of nude mice. Data are represented as the mean ± SEM (n = 6-7). *p < 0.05, **p < 0.01, ns represents p > 0.05. (H) Bodyweight of mice in CQ+TMZ, CQ-TMZ, and TMZ+CQ groups. Data are represented as the mean ± SEM (n = 6). *p < 0.05, ns represents p > 0.05. (I) IHC staining of brain tumor samples for Ki67 in CQ+TMZ, CQ-TMZ, and TMZ+CQ groups. Scale bar = 50 μm. (J) IF of γH2AX expression in brain tumors in CQ+TMZ, CQ-TMZ, and TMZ+CQ groups. Scale bar = 50 μm.
Figure 7
Figure 7
Sequential therapy of TMZ plus CQ increases intracellular TMZ concentration. (A) The expression of PTRF and caveolin1 were analyzed in CQ-treated U87 cells. (B) The morphology of small EVs and large EVs in CQ-treated U87 cells was observed by TEM. (C) Protein levels of CD63, CD81, and CD9 analyzed from small EVs and large EVs in CQ-treated U87 cells. (D) The expressions of PTRF and caveolin1 were analyzed in CQ-treated TBD0220 cells. (E) The morphology of small EVs and large EVs in CQ-treated TBD0220 cells was observed by TEM. (F) Protein expression levels of CD63, CD81, and CD9 were analyzed from small EVs and large EVs in CQ-treated TBD0220 cells. (G-H) The concentration of small EVs and large EVs in CQ-treated U87 cells. Data are represented as the mean ± SEM (n = 3). *p < 0.05, **p < 0.01. (I) The intracellular TMZ concentration was measured by LC-MS in TMZ, CQ+TMZ, CQ-TMZ, and TMZ+CQ treatment groups. Data are represented as the mean ± SEM (n = 3). *p < 0.05, ***p < 0.001, ns represents p > 0.05. (J-K) IF showing the population of O6-MetG expression in Ctrl, TMZ, CQ+TMZ, CQ-TMZ, and TMZ+CQ treatment groups in U87 cells. Data are represented as the mean ± SEM (n = 3). *p < 0.05, **p < 0.01, ns represents p > 0.05.
Figure 8
Figure 8
The mechanism of TMZ resistance and sequential therapy of TMZ followed by CQ for decreasing TMZ resistance in glioblastoma.

Similar articles

Cited by

References

    1. Ostrom QT, Cioffi G, Waite K, Kruchko C, Barnholtz-Sloan JS. CBTRUS Statistical Report: Primary Brain and Other Central Nervous System Tumors Diagnosed in the United States in 2014-2018. Neuro-Oncol. 2021;23:iii1–iii105. - PMC - PubMed
    1. Back MF, Ang E, Ng W-H, See S-J, Lim C, Chan SP. et al. Improved median survival for glioblastoma multiforme following introduction of adjuvant temozolomide chemotherapy. Ann Acad Med Singap. 2007;36:338–42. - PubMed
    1. Stupp R. European Organisation for Research and Treatment of Cancer Brain Tumor and Radiotherapy Groups; National Cancer Institute of Canada Clinical Trials Group. Radiotherapy plus concomitant and adjuvant temozolomide for glioblastoma. N Engl J Med. 2005;352:987–96. - PubMed
    1. Mayor S, Chadda R. PTRF triggers a cave in. Cell. 2008;132:23–4. - PubMed
    1. Huang K, Fang C, Yi K, Liu X, Qi H, Tan Y. et al. The role of PTRF/Cavin1 as a biomarker in both glioma and serum exosomes. Theranostics. 2018;8:1540–57. - PMC - PubMed

Publication types

MeSH terms

Substances