. 2022 May 13;12(9):4147-4162.
doi: 10.7150/thno.72803. eCollection 2022.

Image-guided drug delivery of nanotheranostics for targeted lung cancer therapy

Affiliations

Image-guided drug delivery of nanotheranostics for targeted lung cancer therapy

Xiaoran Yin et al. Theranostics. .

Abstract

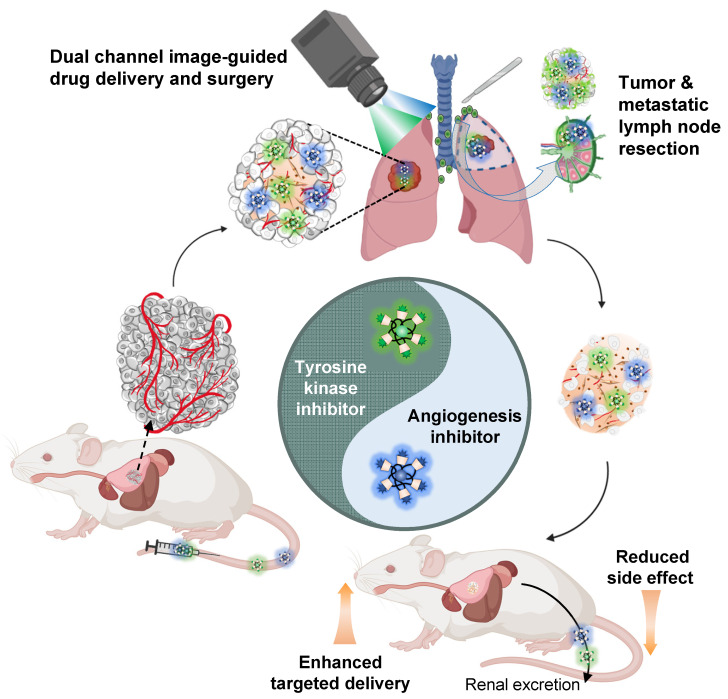
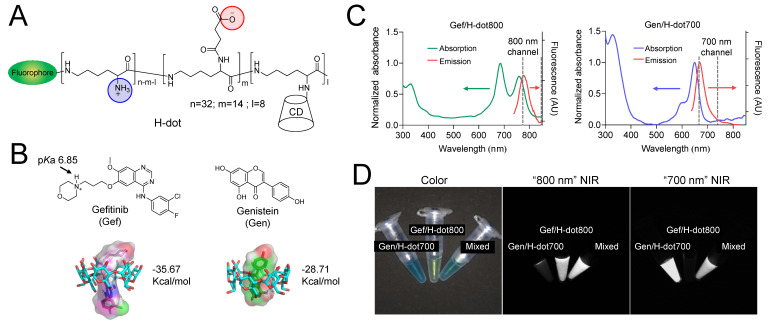
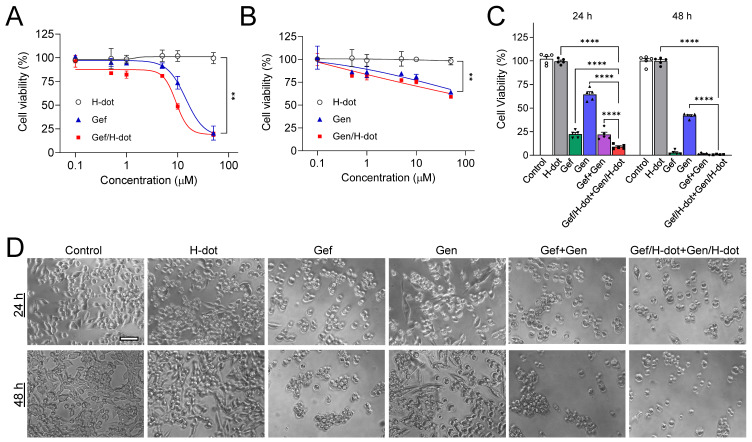
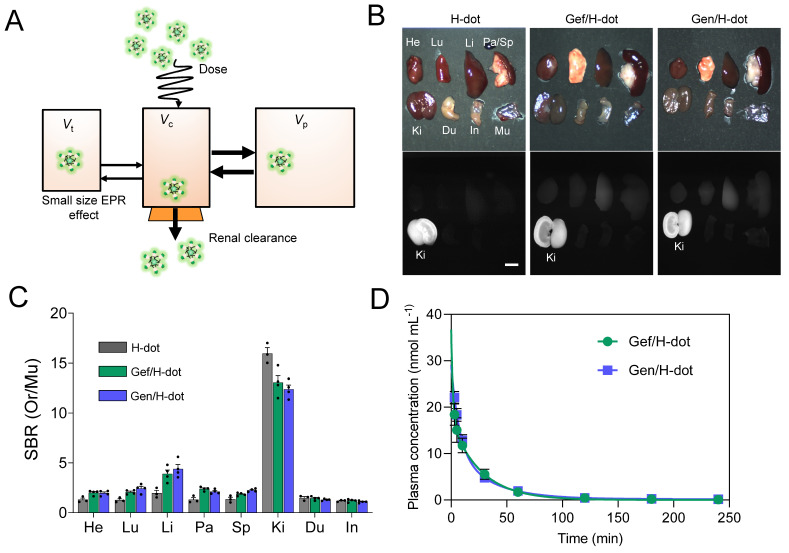
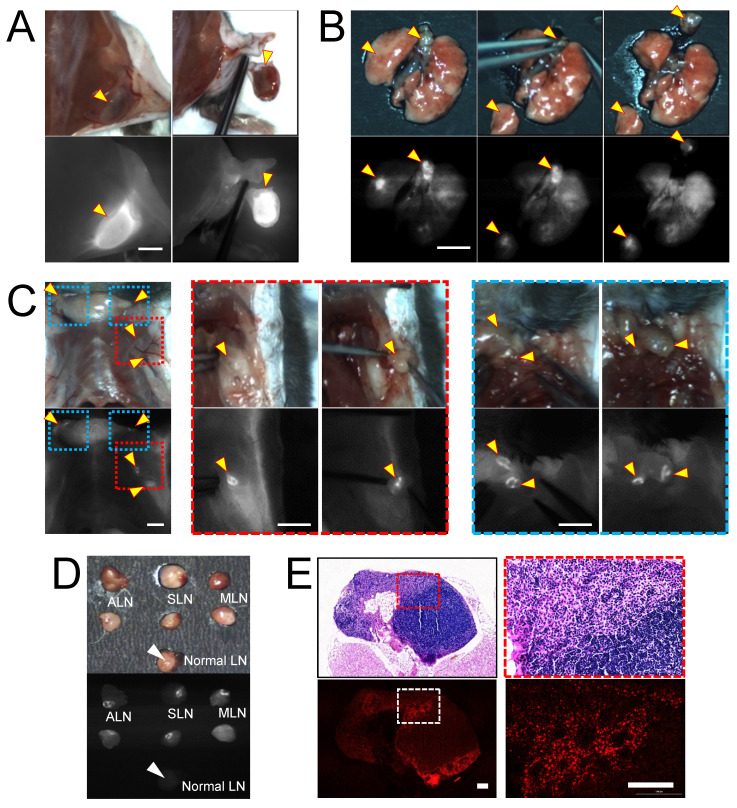
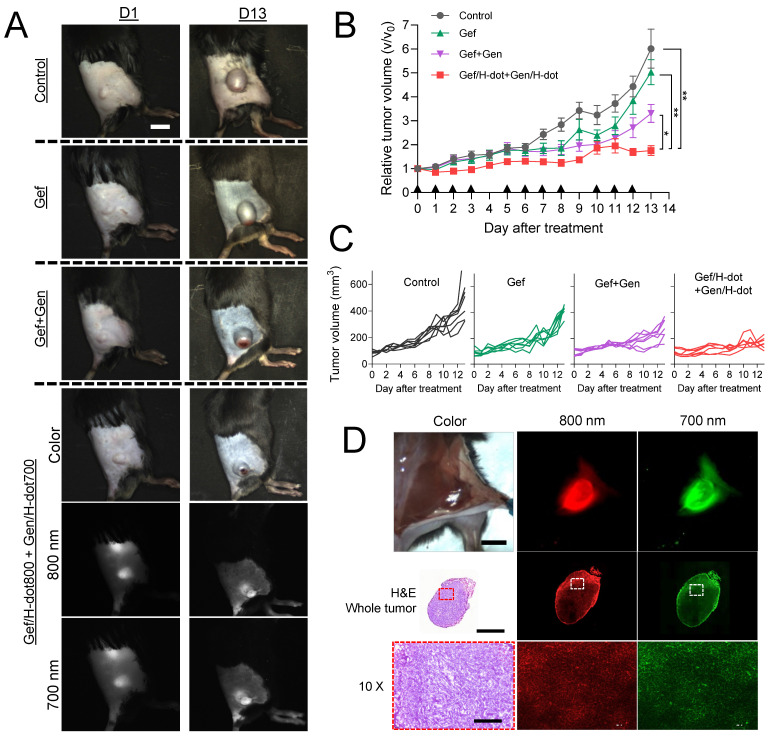
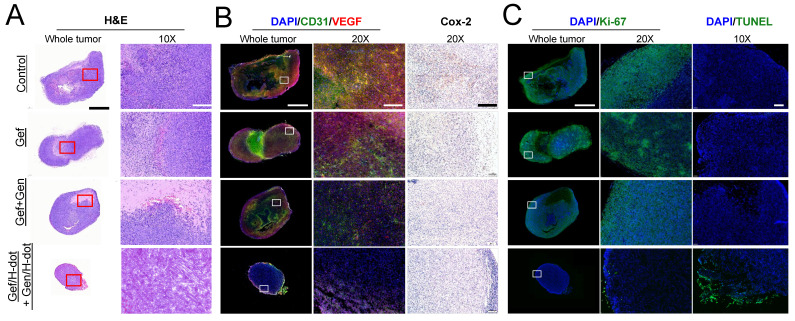
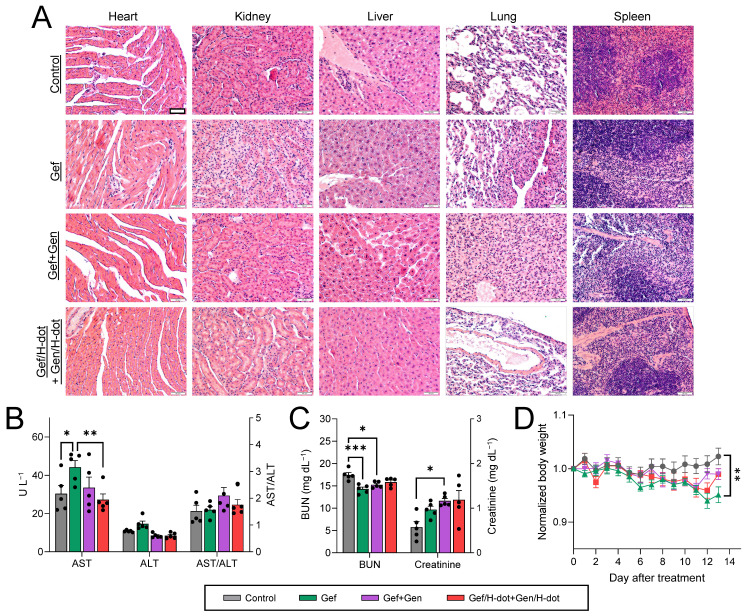
Enormous efforts have been made to integrate various therapeutic interventions into multifunctional nanoplatforms, resulting in the advance of nanomedicine. Image-guided drug delivery plays a pivotal role in this field by providing specific targeting as well as image navigation for disease prognosis. Methods: We demonstrate image-guided surgery and drug delivery for the treatment of lung cancer using nanotheranostic H-dots loaded with gefitinib and genistein. Results: The surgical margin for lung tumors is determined by image guidance for precise tumor resection, while targeted anti-cancer drugs function simultaneously for synergistic combination therapy. Compared to conventional chemotherapies, H-dot complexes could improve the therapeutic efficacy of drugs while reducing the risk of adverse effects and drug resistance owing to their ideal biodistribution profiles, high targetability, low nonspecific tissue uptake, and fast renal excretion. Conclusions: These H-dot complexes have unlocked a unique framework for integrating multiple therapeutic and diagnostic modalities into one nanoplatform.

Keywords: Cancer therapy; Combination therapy; Image-guided surgery; Renal clearance; Theranostics.


Conflict of interest statement

Competing Interests: The authors have declared that no competing interest exists.

Figures

Scheme 1
Scheme 1
Combination therapy of EGFR-tyrosine kinase inhibitor (EGFR-TKI) and angiogenesis inhibitor (AI) incorporated in nanotherapeutic H-dot. The multifunctional H-dot complexes with TKI and AI enable dual-channel NIR fluorescence image-guided surgical intervention in real-time as well as transportation of targeted drugs (i.e., TKI and AI) for synergistic combination therapy. The H-dot-based targeted drug delivery system is renal clearable and nonsticky, which reduces the side effects of anti-cancer target drugs while improving therapeutic efficacy. This is a new strategy for synthesizing multifunctional theranostic agents as one nanoplatform for precise diagnosis and targeted therapy of lung cancer.
Figure 1
Figure 1
Physicochemical properties of theranostic H-dot complexes. (A) Chemical structure of H-dot. (B) Chemical structures of Gen and Gef and their inclusion complexes with beta-cyclodextrin (CD). The numbers indicate binding energies using the CDOCKER protocol in Discovery Studio 3.0 software. (C) Absorption and fluorescence emission spectra of Gen/H-dot700 and Gef/H-dot800 complexes. (D) Dual-channel NIR fluorescence images (700 nm and 800 nm channels) of the Gen/H-dot700, Gef/H-dot800, and their mixture.
Figure 2
Figure 2
In vitro therapeutic efficacy test of Gef/H-dot and Gen/H-dot complexes. (A) LLC cell growth inhibitory effects at 24 h with different concentrations of H-dot, Gef, and Gef/H-dot complex, and (B) H-dot, Gen, and Gen/H-dot complex treatment group at 24 h. (n = 5, mean ± s.e.m.). (C) LLC cell growth inhibitory effect with H-dot800 (40 µM) +H-dot700 (30 µM), Gef (40 µM), Gen (30 µM), Gef+Gen (40 µM + 30 µM), and Gef/H-dot (40 µM) with Gen/H-dot (30 µM) at 24 h and 48 h (n = 5, mean ± s.e.m.). p values < 0.05 were considered significant: **p < 0.01 and ****p < 0.0001. (D) phase-contrast microscope images (×20) to compare the morphology and confluency of LLC cells after treatment with H-dot, Gef, Gen, Gef+Gen, and Gef/H-dot+Gen/H-dot for 24 h and 48 h. Scale bar: 200 µm.
Figure 3
Figure 3
Biodistribution and pharmacokinetics for Gef/H-dot and Gen/H-dot. Drug/H-dot complexes were injected into CD-1 mice, and NIR imaging was carried out at 4 h post-injection. (A) Schematic diagram for pharmacokinetics/dynamics, distribution, and clearance of renal clearable H-dot. Vt, Vc, and Vp stand for volume of the tumor, volume of the central compartment, and volume of the peripheral compartment, respectively. (B) Color and NIR fluorescence images of resected organs. Abbreviations used are: Du, duodenum; He, heart; In, intestine; Ki, kidneys; Li, liver; Lu, lungs; Mu, muscle; Pa, pancreas; Sp, spleen. Scale bar: 5 mm. (C) Signal to background ratio (SBR) of each resected organ from mice injected with H-dot, Gef/H-dot, and Gen/H-dot. (n = 3-4 per group, mean ± s.e.m.) (D) Plasma concentration decay curve of Gef/H-dot and Gen/H-dot. Blood samples from Gef/H-dot and Gen/H-dot injected mice were collected at time points: 1, 3, 5, 10, 30, 60, 120, 180, and 240 min. (n = 4 per group, mean ± s.e.m.)
Figure 4
Figure 4
In vivo real-time image-guided surgical intervention and NIR fluorescence-guided histopathology test. NIR fluorescence imaging of LLC lung tumor-bearing mice at 24 h post-injection of Gef/H-dot. (A) NIR fluorescence image-guided surgery of subcutaneous tumor, (B) orthotopic lung tumor and mediastinal metastatic lymph nodes, and (C) regional/distant metastatic lymph nodes including axillary (red dotted square outline) and supraclavicular (blue dotted square outline) lymph nodes metastases. Scale bar: 5 mm. Yellow arrowheads indicate tumors and metastatic lymph nodes which were removed under real-time image guidance. (D) Resected metastatic lymph nodes compared to normal lymph nodes under the guidance of intraoperative fluorescence imaging, (E) postoperative histopathological examination; H&E staining images (upper panel) and NIR fluorescence microscopic images (lower panel). LLC tumor cells were able to be distinguished from lymphocytes. Scale bar: 100 µm.
Figure 5
Figure 5
In vivo therapeutic efficacy of combination treatment with theranostic Gef/H-dot and Gen/H-dot compared to saline, Gef, and Gef+Gen groups for D13 treatment (n = 7 per each group). Black arrowheads indicate the day of injections. (A) Representative color and NIR images of each treatment group on D1 and D13. Scale bar: 5 mm. (B) Tumor growth curves for the mice of the four different treatment groups. p values < 0.05 were considered significant: *p < 0.05 and **p < 0.01. (C) Individual tumor volume for each treatment group. (D) Intraoperative NIR fluorescence and microscope images of a resected tumor after treatment with the combination of Gef/H-dot800 and Gen/H-dot700. Scale bar: 5 mm, 2 µm, and 200 µm for intraoperative imaging, whole tumor, and 10× microscope images, respectively.
Figure 6
Figure 6
Histopathological examination of LLC tumors for synergistic therapeutic efficacy of Gef/H-dot+Gen/H-dot group compared to saline, Gef, and Gef+Gen treatment groups. (A) H&E staining for observation of tumor's histopathological changes. (B) CD31 and VEGF staining images for detecting expression and distribution of tumor-associated angiogenesis, and cyclooxygenase-2 (COX-2) staining images for detecting the changes in inflammatory factors in tumor tissues. (C) Ki-67 staining and terminal deoxynucleotidyl transferase dUTP nick end labeling (TUNEL) images of resected tumor tissues. Ki-67 staining was used to determine tumor proliferation indexes, and TUNEL was used for observation of tumor cell apoptosis. Scale bar: 2 µm for whole tumor images and 200 µm for the others.
Figure 7
Figure 7
In vivo toxicity test in LLC tumor-bearing mice treated with saline, Gef, Gef+Gen, and Gef/H-dot+Gen/H-dot, respectively, for 14 d (n= 7 per each group). (A) H&E staining images (20×) of heart, liver, spleen, lung, and kidney in each treatment group. Scale bar: 200 µm. (B) Serum aspartate transferase (AST), alanine transferase (ALT), and AST/ALT ratio. (C) Blood urea nitrogen (BUN) and creatinine. (D) Body weights of mice for 14 d during the treatments. p values < 0.05 were considered significant: *p < 0.05 and **p < 0.01.

Similar articles

Cited by

References

    1. Edwards BK, Noone AM, Mariotto AB, Simard EP, Boscoe FP, Henley SJ. et al. Annual Report to the Nation on the status of cancer, 1975-2010, featuring prevalence of comorbidity and impact on survival among persons with lung, colorectal, breast, or prostate cancer. Cancer. 2014;120:1290–314. - PMC - PubMed
    1. Arbour KC, Riely GJ. Systemic therapy for locally advanced and metastatic non-small cell lung cancer: a review. JAMA. 2019;322:764–74. - PubMed
    1. Sekine I, Aida Y, Suzuki H. Induction systemic therapy followed by surgery for stages II-III non-small cell lung cancer: steady efforts. J Thorac Dis. 2018;10:S3942. - PMC - PubMed
    1. Horita N, Woo T, Miyazawa N, Kaneko T. Preoperative chemotherapy for non-small cell lung carcinoma. Transl Lung Cancer Res. 2014;4:8–14. - PMC - PubMed
    1. Siegel RL, Miller KD, Jemal A. Cancer statistics, 2019. CA Cancer J Clin. 2019;69:7–34. - PubMed

Publication types

Substances