. 2021:4:172.
doi: 10.1038/s42004-021-00605-z. Epub 2021 Dec 10.

Decrypting a Cryptic Allosteric Pocket in H. pylori Glutamate Racemase

Affiliations

Decrypting a Cryptic Allosteric Pocket in H. pylori Glutamate Racemase

Pratik Rajesh Chheda et al. Commun Chem. 2021.

Abstract

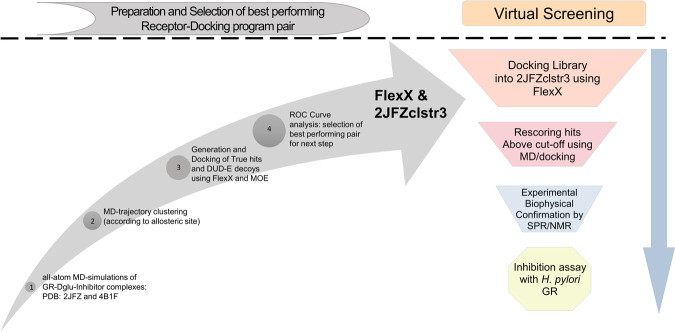
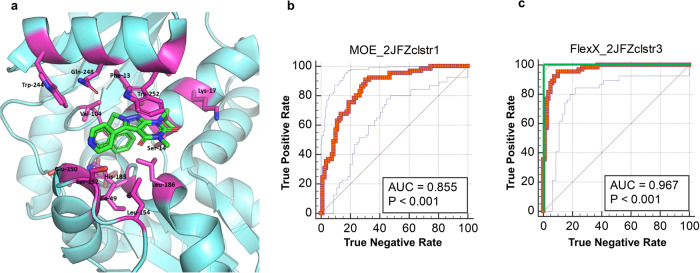
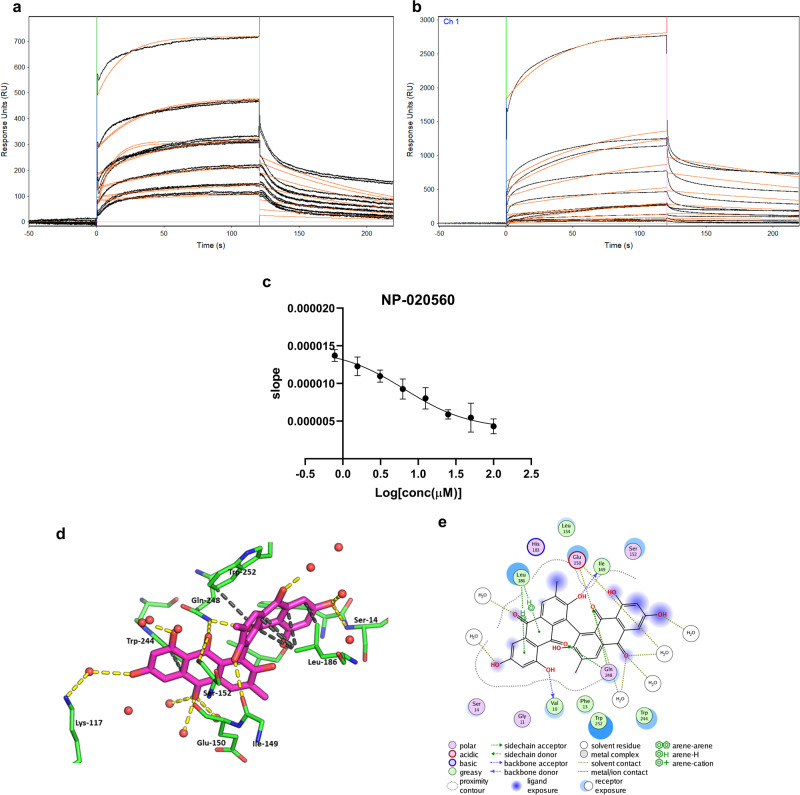
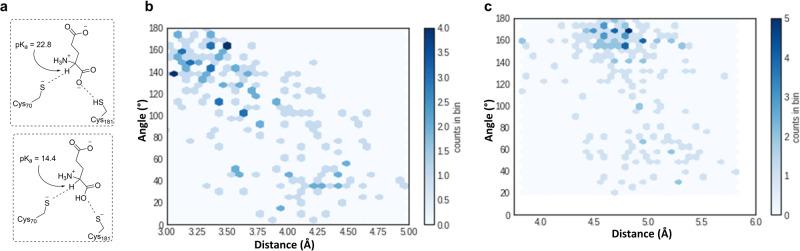
One of our greatest challenges in drug design is targeting cryptic allosteric pockets in enzyme targets. Drug leads that do bind to these cryptic pockets are often discovered during HTS campaigns, and the mechanisms of action are rarely understood. Nevertheless, it is often the case that the allosteric pocket provides the best option for drug development against a given target. In the current studies we present a successful way forward in rationally exploiting the cryptic allosteric pocket of H. pylori glutamate racemase, an essential enzyme in this pathogen's life cycle. A wide range of computational and experimental methods are employed in a workflow leading to the discovery of a series of natural product allosteric inhibitors which occupy the allosteric pocket of this essential racemase. The confluence of these studies reveals a fascinating source of the allosteric inhibition, which centers on the abolition of essential monomer-monomer coupled motion networks.


Conflict of interest statement

Competing interests The authors declare no competing interests.

Figures

Fig. 1
Fig. 1. H. pylori GR dimer structure bound to D-Glu (substrate) and Compound A (allosteric inhibitor).
H. pylori GR exists as an obligate dimer, with the active sites of each monomer facing one another (D-Glu is shown in the center of each monomer in blue and red). Structure PDB 2JFZ (brown ribbons) bound to Compound A (shown in green) bound to the allosteric pocket is superposed onto the inhibitor free form of the enzyme PDB 2JFX (yellow ribbons). Mechanistically, these structures alone are not sufficient to understand allosteric inhibition in this system, which is largely driveni by dynamics, as discussed in the text.
Fig. 2
Fig. 2. Biphasic workflow for natural product inhibitor discovery targeting the allosteric cryptic pocket of H. pylori GR.
The graph is divided into two phases, depicted on the left and the right, respectively. On the left half of the chart, we describe the selection of the best receptor and docking protocol combination; snapshots from MD simulations of ~800 ns were clustered and centroids were examined for their ROC performance (ability to discriminate between decoys and known hits). The best performing pair was “2JFZclstr3” as the receptor (derived from the PDB structure 2JFZ, as described in the Methods section) and docking was performed with FlexX (BiosolveIT), as described in the Methods section. The flowchart on the right-hand side is the actual virtual screening protocol that employs the validated 2JFZclstr3-FlexX (receptor and docking protocol) pair, including the experimental biophysical hit validation using SPR. The screening library employed was AnalytiCon’s MEGx natural products library.
Fig. 3
Fig. 3. Use of the ROC method for identifying the best docking-receptor pair.
Clustering MD snapshots based on allosteric pocket geometries and use of these receptors in the Receiver Operator Characteristic (ROC) statistical procedure for identifying the best combination of receptor and docking protocol for the resolution of true hits and decoys. a MD snapshots were clustered based on the structure of the residues in the allosteric pocket (shown in magenta; see Computational Methods for details). 2JFZ provided 6 clusters and 4B1F provided 4 clusters in addition to average and low energy forms for each. b, c The ROC distributions for the best performing MD cluster for the MOE (b) and FlexX (c) docking protocols, respectively. The curve measures the ability of the docking procedure to resolve true positives and true negatives. The fraction of true positives that score above a user defined threshold (sensitivity) is plotted on the y-axis and the fraction of true negatives (specificity) that score above the threshold is shown on the x-axis. The theoretically perfect curve is shown in green, while the average score for both the MOE and FlexX protocols with cluster ‘2JFZclstr1’ and ‘2JFZclstr3’ is shown in red, respectively. The dotted lines show the standard deviation for the fit.
Fig. 4
Fig. 4. Experimental validation and characterization of the binding of natural product hits obtained from the in-silico screening to H. pylori GR.
a, b Compounds were injected onto the sensor in increasing concentration using a dilution series ranging from 500 µM to 7.81 µM (7 concentrations for each natural product hit). Using a Langmuir 1:1 binding model, the Kd for the samples were obtained as listed in Table 2. Compound A used as control had a Kd of 80 µM while the two most potent natural product hits NP-020560 and NP-000205 had Kd of 54.7 ± 0.3 µM and 80 ± 0.6 µM, respectively (a, b, Table 2). The binding affinity of the rest of the three compounds is as listed in Table 2 and the SPR graphs are as shown in Supplementary Fig. 3. These binding experiments indicate that compound A and our hits from virtual screening bind to H. pylori GR stoichiometrically in the absence of the substrate (D-Glu). c Evaluation of inhibitory activity of NP-020560 against H. pylori GR employing a previously established coupled-enzyme assay. Four of the five tested compounds inhibited the enzyme to different extents with NP-020560 being the most potent, having an IC50 of 6.6 ± 3.1 µM (which is roughly equivalent to the IC50 for compound A, see Table 2), while the other compounds had IC50 values in the high micromolar range (Table 2). Values represent mean ± SE, n = 3. d, e NP-020560 fits into the allosteric pocket making several polar and hydrophobic interactions. One of the anthracenedione ring of the biantracene ring system in NP-020560 is inserted into the inner pocket making the key π-stacking interaction with Trp-252 (a key recognition feature of Compound A as well) along with forming several hydrophobic interactions with the side chain of Leu-186. The second anthracenedione ring forms an edge to face π-stacking interaction with Trp-244. The hydroxyl and ketone moieties on NP-020560 form several hydrogen bonding interactions with several pocket residues including Ser14, Ile-149, Ser-152, and Gln-248.
Fig. 5
Fig. 5. Trends in changes between inhibited and uninhibited GR structures.
a Heat map of crystallographic B-factors show high B-factor values in the C-terminal α-helix. The left-hand side of the figure shows superpose of the H. pylori GR dimer with (2JFZ-blue) and without Compound A (2JFX-purple) bound. The position of Compound A is shown in space filing blue spheres, which highlights the importance of the C-terminal α-helix position in the allosteric site architecture. The half blue and half purple spheres represent D-Glu in both crystal structures. The diameter of the cartoon tubes represents magnitude of the crystallographic B-factor value and the thicker the tubing of the cartoon structure. The C-terminal α-helix of only 2JFX (GR without Compound A bound) has a very large B-factor (wider tube diameter) relative to 2JFZ (Compound A-bound structure). On the right-hand side of the figure, the light purple cartoon structure represents the neighboring unit of 2JFZ and the teal structure is the neighboring unit of 2JFX. An analysis of these neighboring asymmetric units shows no clashes that could account for these selective large differences in B-factors in the C-terminal region, suggesting that dynamics may be an important factor. b, c A juxtaposition between computational (MD simulations) and experimental (X-ray crystallography) data. In panel b, the changes in RMSF (Å) between the inhibitor-bound system (GR-D-Glu-NP-020560) and the inhibitor-free system (GR-D-Glu) are shown for MD simulations as a function of the residue number. In c, the changes in normalized B-factors between the inhibitor-bound structure (2JFZ: GR-D-Glu-Compound-A) and the inhibitor-free system (2JFX: GR-D-Glu) are plotted as a function of residue number. In both cases, b and c, the data are derived from subtracting the uninhibited data from the inhibited data (Supplementary Fig. 6).
Fig. 6
Fig. 6. The structural consequences of complexation with NP-020560 on H. pylori GR dynamics.
a Acidification of Cα carbon of glutamate substrate due to protonation of Cα-carboxylate oxygen by catalytic Cys-181. This has been shown in previous studies to be an important dynamical element in H. pylori GR. b Plot of near attack geometries for Cα deprotonation for MD simulation with H. pylori GR bound D-Glu (Cys-S-----H---Cα angle, and Cys-S------Cα distance). c Plot of near attack geometries for Cα deprotonation for MD simulation with H. pylori GR bound to NP-020560 and D-Glu (Cys-S-----H---Ca angle, and Cys-S------Cα distance).
Fig. 7
Fig. 7. Topology map of the difference between the DCCM for the uninhibited system (GR-D-Glu) and the inhibited system (GR-D-Glu-NP-020560).
ΔDCCM = DCCM-Uninhibited – DCCMInhibited. The original DCCM plots are shown in Supplementary Fig. 8. Panel a shows that most coupled motions are not different between the two systems, except for a strong region of positive changes in coupled motion are seen at precisely the interaction of subunit A’s C-terminal α-helix (residues 235–255) and a number of structural elements of subunit B; this salient loss of coupled motion is represented in the striking “L-shaped” pattern, which corresponds to an interaction between monomers, which is surprising and unprecedented in the GR enzyme family. The affected areas include large portions of the active site, which encompasses the catalytic Cys181, which is responsible for the substrate acidification. Panel b shows this key coupled motion, which is lost upon complexation with the allosteric inhibitor, mapped onto the dimeric structure, in which the C-terminal α-helix is shown in green and the regions it is coupled to are shown in red.

Similar articles

References

    1. Hooi JKY, et al. Global prevalence of Helicobacter pylori infection: systematic review and meta-analysis. Gastroenterology. 2017;153:420–429. doi: 10.1053/j.gastro.2017.04.022. - DOI - PubMed
    1. Brown LM. Helicobacter pylori: epidemiology and routes of transmission. Epidemiol. Rev. 2000;22:283–297. doi: 10.1093/oxfordjournals.epirev.a018040. - DOI - PubMed
    1. Bornschein J, et al. H. pylori infection is a key risk factor for proximal gastric cancer. Dig. Dis. Sci. 2010;55:3124–3131. doi: 10.1007/s10620-010-1351-x. - DOI - PubMed
    1. Kim SS, Ruiz VE, Carroll JD, Moss SF. Helicobacter pylori in the pathogenesis of gastric cancer and gastric lymphoma. Cancer Lett. 2011;305:228–238. doi: 10.1016/j.canlet.2010.07.014. - DOI - PMC - PubMed
    1. Suerbaum S, Michetti P. Helicobacter pylori infection. N. Engl. J. Med. 2002;347:1175–1186. doi: 10.1056/NEJMra020542. - DOI - PubMed