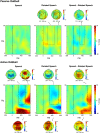
Formant-invariant voice and pitch representations are pre-attentively formed from constantly varying speech and non-speech stimuli
- PMID: 35673798
- PMCID: PMC9545905
- DOI: 10.1111/ejn.15730
Formant-invariant voice and pitch representations are pre-attentively formed from constantly varying speech and non-speech stimuli
Abstract
The present study investigated whether listeners can form abstract voice representations while ignoring constantly changing phonological information and if they can use the resulting information to facilitate voice change detection. Further, the study aimed at understanding whether the use of abstraction is restricted to the speech domain or can be deployed also in non-speech contexts. We ran an electroencephalogram (EEG) experiment including one passive and one active oddball task, each featuring a speech and a rotated speech condition. In the speech condition, participants heard constantly changing vowels uttered by a male speaker (standard stimuli) which were infrequently replaced by vowels uttered by a female speaker with higher pitch (deviant stimuli). In the rotated speech condition, participants heard rotated vowels, in which the natural formant structure of speech was disrupted. In the passive task, the mismatch negativity was elicited after the presentation of the deviant voice in both conditions, indicating that listeners could successfully group together different stimuli into a formant-invariant voice representation. In the active task, participants showed shorter reaction times (RTs), higher accuracy and a larger P3b in the speech condition with respect to the rotated speech condition. Results showed that whereas at a pre-attentive level the cognitive system can track pitch regularities while presumably ignoring constantly changing formant information both in speech and in rotated speech, at an attentive level the use of such information is facilitated for speech. This facilitation was also testified by a stronger synchronisation in the theta band (4-7 Hz), potentially pointing towards differences in encoding/retrieval processes.
Keywords: MMN; P3b; Theta; speech perception; voice representation.
© 2022 The Authors. European Journal of Neuroscience published by Federation of European Neuroscience Societies and John Wiley & Sons Ltd.
Conflict of interest statement
The authors declare that they have no known competing financial interests or personal relationships that could have appeared to influence the work reported in this paper.
Figures


Similar articles
-
Pre-attentive perception of vowel phonemes from variable speech stimuli.Psychophysiology. 2004 Jul;41(4):654-9. doi: 10.1111/1469-8986.2004.00175.x. Psychophysiology. 2004. PMID: 15189488 Clinical Trial.
-
Pre-attentive and attentive processing of French vowels.Brain Res. 2010 Dec 17;1366:149-61. doi: 10.1016/j.brainres.2010.09.104. Epub 2010 Oct 30. Brain Res. 2010. PMID: 20920484
-
Body Perception From Connected Speech: Speaker Height Discrimination from Natural Sentences and Sine-Wave Replicas with and without Pitch.Percept Mot Skills. 2023 Aug;130(4):1353-1365. doi: 10.1177/00315125231173581. Percept Mot Skills. 2023. PMID: 37477268
-
Preattentive cortical-evoked responses to pure tones, harmonic tones, and speech: influence of music training.Ear Hear. 2009 Aug;30(4):432-46. doi: 10.1097/AUD.0b013e3181a61bf2. Ear Hear. 2009. PMID: 19494778
-
Stimulus-dependent activations and attention-related modulations in the auditory cortex: a meta-analysis of fMRI studies.Hear Res. 2014 Jan;307:29-41. doi: 10.1016/j.heares.2013.08.001. Epub 2013 Aug 11. Hear Res. 2014. PMID: 23938208 Review.
Cited by
-
Distinct Neural Resource Involvements but Similar Hemispheric Lateralization Patterns in Pre-Attentive Processing of Speaker's Identity and Linguistic Information.Brain Sci. 2023 Jan 23;13(2):192. doi: 10.3390/brainsci13020192. Brain Sci. 2023. PMID: 36831735 Free PMC article.
-
Vowel perception in multilingual speakers: ERP evidence from Polish, English and Norwegian.Front Psychol. 2023 Oct 12;14:1270743. doi: 10.3389/fpsyg.2023.1270743. eCollection 2023. Front Psychol. 2023. PMID: 37901081 Free PMC article.
References
-
- Aaltonen, O. , Eerola, O. , Lang, A. H. , Uusipaikka, E. , & Tuomainen, J. (1994). Automatic discrimination of phonetically relevant and irrelevant vowel parameters as reflected by mismatch negativity. The Journal of the Acoustical Society of America, 96(3), 1489–1493. 10.1121/1.410291 - DOI - PubMed
Publication types
MeSH terms
LinkOut - more resources
Full Text Sources
Miscellaneous

