

Influence of visual background on discrimination of signal-relevant colours in zebra finches (Taeniopygia guttata)
- PMID: 35673868
- PMCID: PMC9174715
- DOI: 10.1098/rspb.2022.0756
Influence of visual background on discrimination of signal-relevant colours in zebra finches (Taeniopygia guttata)
Abstract
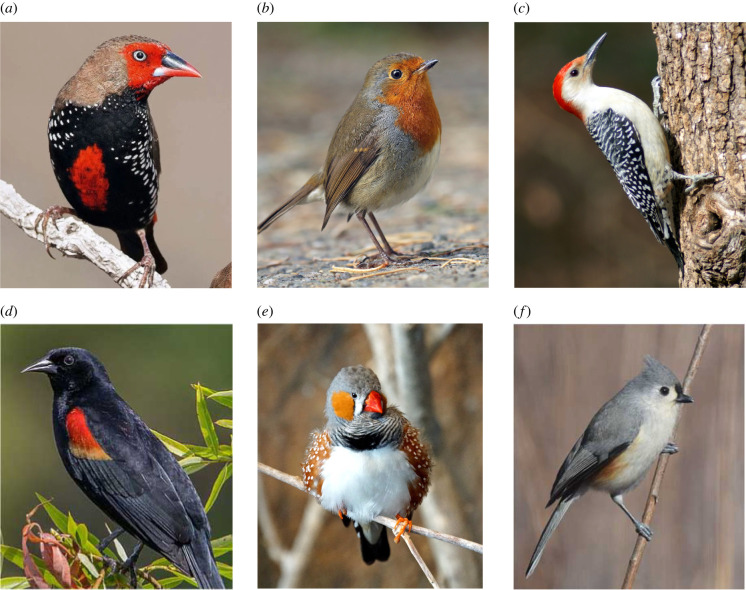
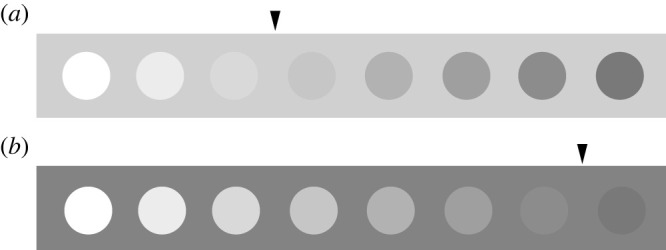
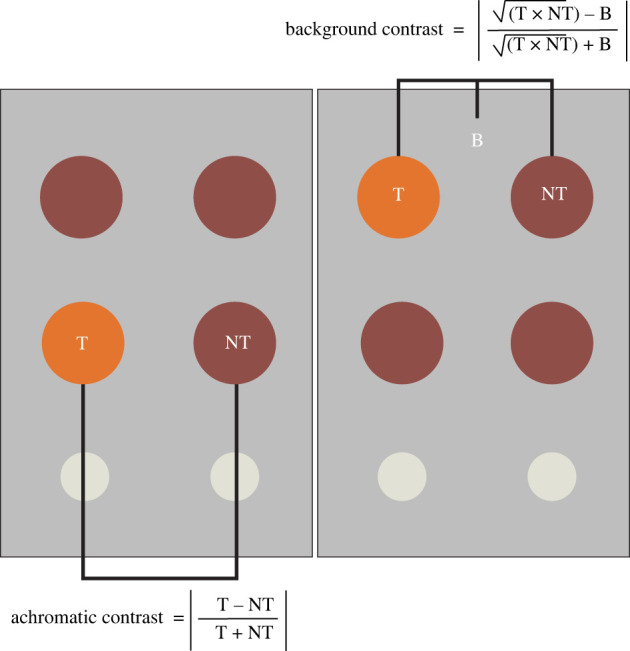
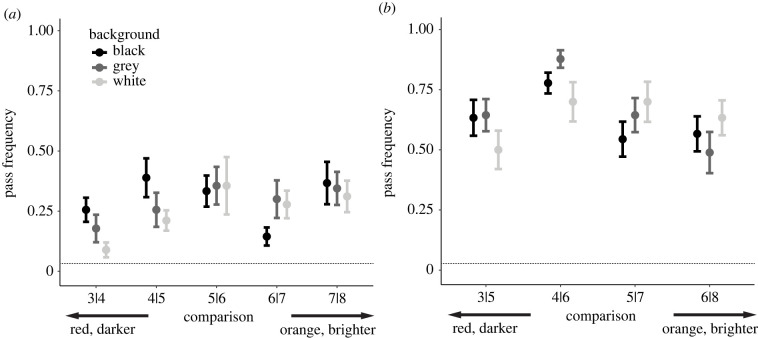
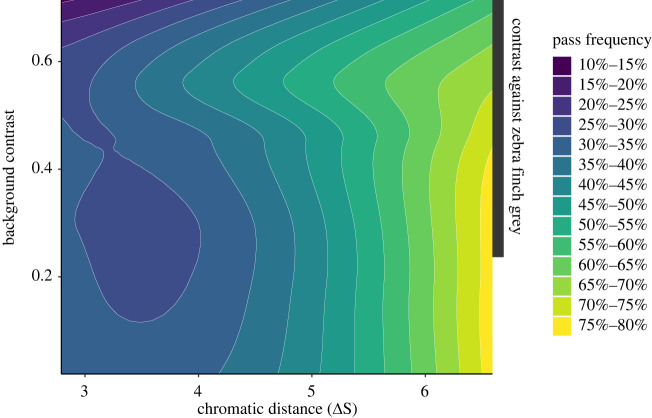
Colour signals of many animals are surrounded by a high-contrast achromatic background, but little is known about the possible function of this arrangement. For both humans and non-human animals, the background colour surrounding a colour stimulus affects the perception of that stimulus, an effect that can influence detection and discrimination of colour signals. Specifically, high colour contrast between the background and two given colour stimuli makes discrimination more difficult. However, it remains unclear how achromatic background contrast affects signal discrimination in non-human animals. Here, we test whether achromatic contrast between signal-relevant colours and an achromatic background affects the ability of zebra finches to discriminate between those colours. Using an odd-one-out paradigm and generalized linear mixed models, we found that higher achromatic contrast with the background, whether positive or negative, decreases the ability of zebra finches to discriminate between target and non-target stimuli. This effect is particularly strong when colour distances are small (less than 4 ΔS) and Michelson achromatic contrast with the background is high (greater than 0.5). We suggest that researchers should consider focal colour patches and their backgrounds as collectively comprising a signal, rather than focusing on solely the focal colour patch itself.
Keywords: background; chromatic; contrast; distance; frequency; model.
Conflict of interest statement
We declare we have no competing interests.
Figures
Similar articles
-
Categorical perception of colour signals in a songbird.Nature. 2018 Aug;560(7718):365-367. doi: 10.1038/s41586-018-0377-7. Epub 2018 Aug 1. Nature. 2018. PMID: 30069042
-
Chicken colour discrimination depends on background colour.J Exp Biol. 2020 Dec 15;223(Pt 24):jeb209429. doi: 10.1242/jeb.209429. J Exp Biol. 2020. PMID: 33097569
-
Colour vision and background adaptation in a passerine bird, the zebra finch (Taeniopygia guttata).R Soc Open Sci. 2016 Sep 14;3(9):160383. doi: 10.1098/rsos.160383. eCollection 2016 Sep. R Soc Open Sci. 2016. PMID: 27703702 Free PMC article.
-
Alternative use of chromatic and achromatic cues in a hawkmoth.Proc Biol Sci. 2005 Oct 22;272(1577):2143-7. doi: 10.1098/rspb.2005.3207. Proc Biol Sci. 2005. PMID: 16191627 Free PMC article.
-
Backgrounds and the evolution of visual signals.Trends Ecol Evol. 2024 Feb;39(2):188-198. doi: 10.1016/j.tree.2023.09.006. Epub 2023 Oct 4. Trends Ecol Evol. 2024. PMID: 37802667 Review.
Cited by
-
The perceptual effects of signal components: black sword margins are crucial for signal size discrimination in green swordtails Xiphophorus hellerii.Proc Biol Sci. 2025 Jan;292(2039):20242137. doi: 10.1098/rspb.2024.2137. Epub 2025 Jan 29. Proc Biol Sci. 2025. PMID: 39876733 Free PMC article.
References
-
- Aronsson M, Gamberale-Stille G. 2008. Domestic chicks primarily attend to colour, not pattern, when learning an aposematic coloration. Anim. Behav. 75, 417-423. (10.1016/j.anbehav.2007.05.006) - DOI
-
- Barton K. 2009. MuMIn: multi-model inference, R package version 0.12. 0. See http://r-forge.r-project.org/projects/mumin/.
-
- Bates D, Mächler M, Bolker B, Walker S. 2015. Fitting linear mixed-effects models using lme4. J. Stat. Soft. 67, 1-48. (10.18637/jss.v067.i01) - DOI
-
- Birkhead TR, Fletcher F, Pellatt EJ. 1998. Sexual selection in the zebra finch Taeniopygia guttata: condition, sex traits and immune capacity. Behav. Ecol. Sociobiol. 44, 179-191. (10.1007/s002650050530) - DOI
Publication types
MeSH terms
LinkOut - more resources
Full Text Sources
