. 2022 Aug;9(24):e2200822.
doi: 10.1002/advs.202200822. Epub 2022 Jun 8.

Quantifying Wetting Dynamics with Triboelectrification

Affiliations

Quantifying Wetting Dynamics with Triboelectrification

Xiaolong Zhang et al. Adv Sci (Weinh). 2022 Aug.

Abstract

Wetting is often perceived as an intrinsic surface property of materials, but determining its evolution is complicated by its complex dependence on roughness across the scales. The Wenzel (W) state, where liquids have intimate contact with the rough surfaces, and the Cassie-Baxter (CB) state, where liquids sit onto air pockets formed between asperities, are only two states among the plethora of wetting behaviors. Furthermore, transitions from the CB to the Wenzel state dictate completely different surface performance, such as anti-contamination, anti-icing, drag reduction etc.; however, little is known about how transition occurs during time between the several wetting modes. In this paper, wetting dynamics can be accurately quantified and tracked using solid-liquid triboelectrification. Theoretical underpinning reveals how surface micro-/nano-geometries regulate stability/infiltration, also demonstrating the generality of the authors' theoretical approach in understanding wetting transitions. It can clarify the functioning behavior of materials in real environment.

Keywords: TENG; Wetting dynamics; hierarchical topography; infiltration dynamics; super-hydrophobicity; theory; triboelectricity.


Conflict of interest statement

The authors declare no conflict of interest.

Figures

Figure 1
Figure 1
Schematic representation of tribocharging and triboelectricity processes, for a generically rough dielectric (polypropylene [PP] in the figure, with copper backplane) in multiple wetting/dewetting contacts with a water droplet. The total amount of tribocharges, thus the tribocurrent, is linearly proportional to the dewetted area during the generic contact cycle.
Figure 2
Figure 2
Real and virtual prototypes. The different surface roughness obtained on PP substrate after the hot molding process (A.1), including FESEM images of the nanotextured PP (A.2), with corresponding virtual prototypes (A.3 and A.4). All the virtual prototypes have periodicity along the x‐ and y‐direction.
Figure 3
Figure 3
Real and virtual prototypes. FESEM image of the random distribution of microcubes (A.1) observed at length scale ≈100 µm, and magnified acquisitions of the (A.2‐right) microtextured PP and (A.2‐left) hierarchical PP, with corresponding virtual prototypes (A.3 and A.4). All the virtual prototypes have periodicity along the x‐ and y‐direction.
Figure 4
Figure 4
Theoretical results. A.1) Wet contact mechanics from simulations for the hierarchical surface, A.2) effective contact angle and contact area as a function of the squeezing pressure for the hierarchical and micro‐textured surface.
Figure 5
Figure 5
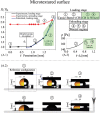
Experimental and simulation results of macroscopic dynamic wetting properties, under quasi‐static kinematics, for the microtextured surface. In the droplet simulations, the effective contact angle as a function of the droplet relative pressure is taken from the simulations results of Figure 4 dynamic (quasi‐static) wetting properties for the microtextured surface. A.1) Measured relative contact radius R/R 0 as a function of the penetration during loading ((1) to (4), black curve) and unloading ((4) to (6), red curve) stages. The blue curve (only loading stage) is the theoretical prediction, whereas the green area represents the range of pressure and penetration at which the Cassie–Baxter to Wenzel transition occurs. (A.2) shows the comparison between the predicted and measured droplet shapes at the varying squeezing pressure. (A.3) shows the calculated contact pressure as a function of the penetration. Note the neat curve bending occurring during the CB to W transition, which occurs for a range of water squeezing pressure of ≈180 Pa.
Figure 6
Figure 6
Experimental and simulation results of macroscopic static and dynamic wetting properties, under quasi‐static kinematics, for the hierarchical surface. In the droplet simulations, the effective contact angle as a function of the droplet relative pressure is taken from the simulations results of Figure 4 dynamic (quasi‐static) wetting properties for the hierarchical surface. A.1) Measured relative contact radius R/R 0 as a function of the penetration during loading ((1) to (4), black curve) and unloading ((4) to (6), red curve) stage. The blue curve (loading/unloading stage) is the theoretical prediction, characterized by a stable Cassie–Baxter regime. (A.2) shows the comparison between the predicted and measured droplet shapes at the varying squeezing pressure. (A.3) shows the calculated contact pressure as a function of the penetration. R 0 is the droplet radius in the sessile contact configuration. Note that the differences between (A.3) and Figure 5A.3, in particular for the hierarchical case the curve slope is monotonically increasing with the penetration.
Figure 7
Figure 7
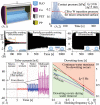
Theoretical and experimental results. A.1) Our TENG device, A.2) typical TENG sloshing pressure, and B) tribocurrent as a function of time. C.1) Steady‐state tribocurrents and C.2) drag‐out dewetting map.
Figure 8
Figure 8
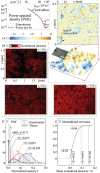
Experimental and simulation results. A.1) Space‐of‐lengths and spectral description of the microstructured surface. B.1) Epifluorescence images of the doped water infiltrated in the microtextured surfaces upon multiple sloshing cycles. C.1) Probability density function of the doped water infiltrated thickness field from experiments and theory (F(q 1) is set to 9E‐4 to fit data). C.2) Evolution of wetted area as a function of the mean infiltrated water volume.

References

    1. Feng L., Li S., Li Y., Li H., Zhang L., Zhai J., Song Y., Liu B., Jiang L., Adv. Mater. 2002, 14, 1857.
    1. Wang D., Sun Q., Hokkanen M. J., Zhang C., Lin F. Y., Liu Q., Zhu S. P., Zhou T., Chang Q., He B., Zhou Q., Chen L., Wang Z., Ras R. H. A., Deng X., Nature 2020, 582, 55. - PubMed
    1. Liu M., Wang S., Jiang L., Nat. Rev. Mater. 2017, 2, 17036.
    1. Liu M., Jiang L., Adv. Funct. Mater. 2010, 20, 3753.
    1. Su B., Tian Y., Jiang L., J. Am. Chem. Soc. 2016, 138, 1727. - PubMed

LinkOut - more resources