. 2022 Aug 5;12(8):1984-2005.
doi: 10.1158/2159-8290.CD-21-1672.

Stress Granules Determine the Development of Obesity-Associated Pancreatic Cancer

Affiliations

Stress Granules Determine the Development of Obesity-Associated Pancreatic Cancer

Guillaume Fonteneau et al. Cancer Discov. .

Abstract

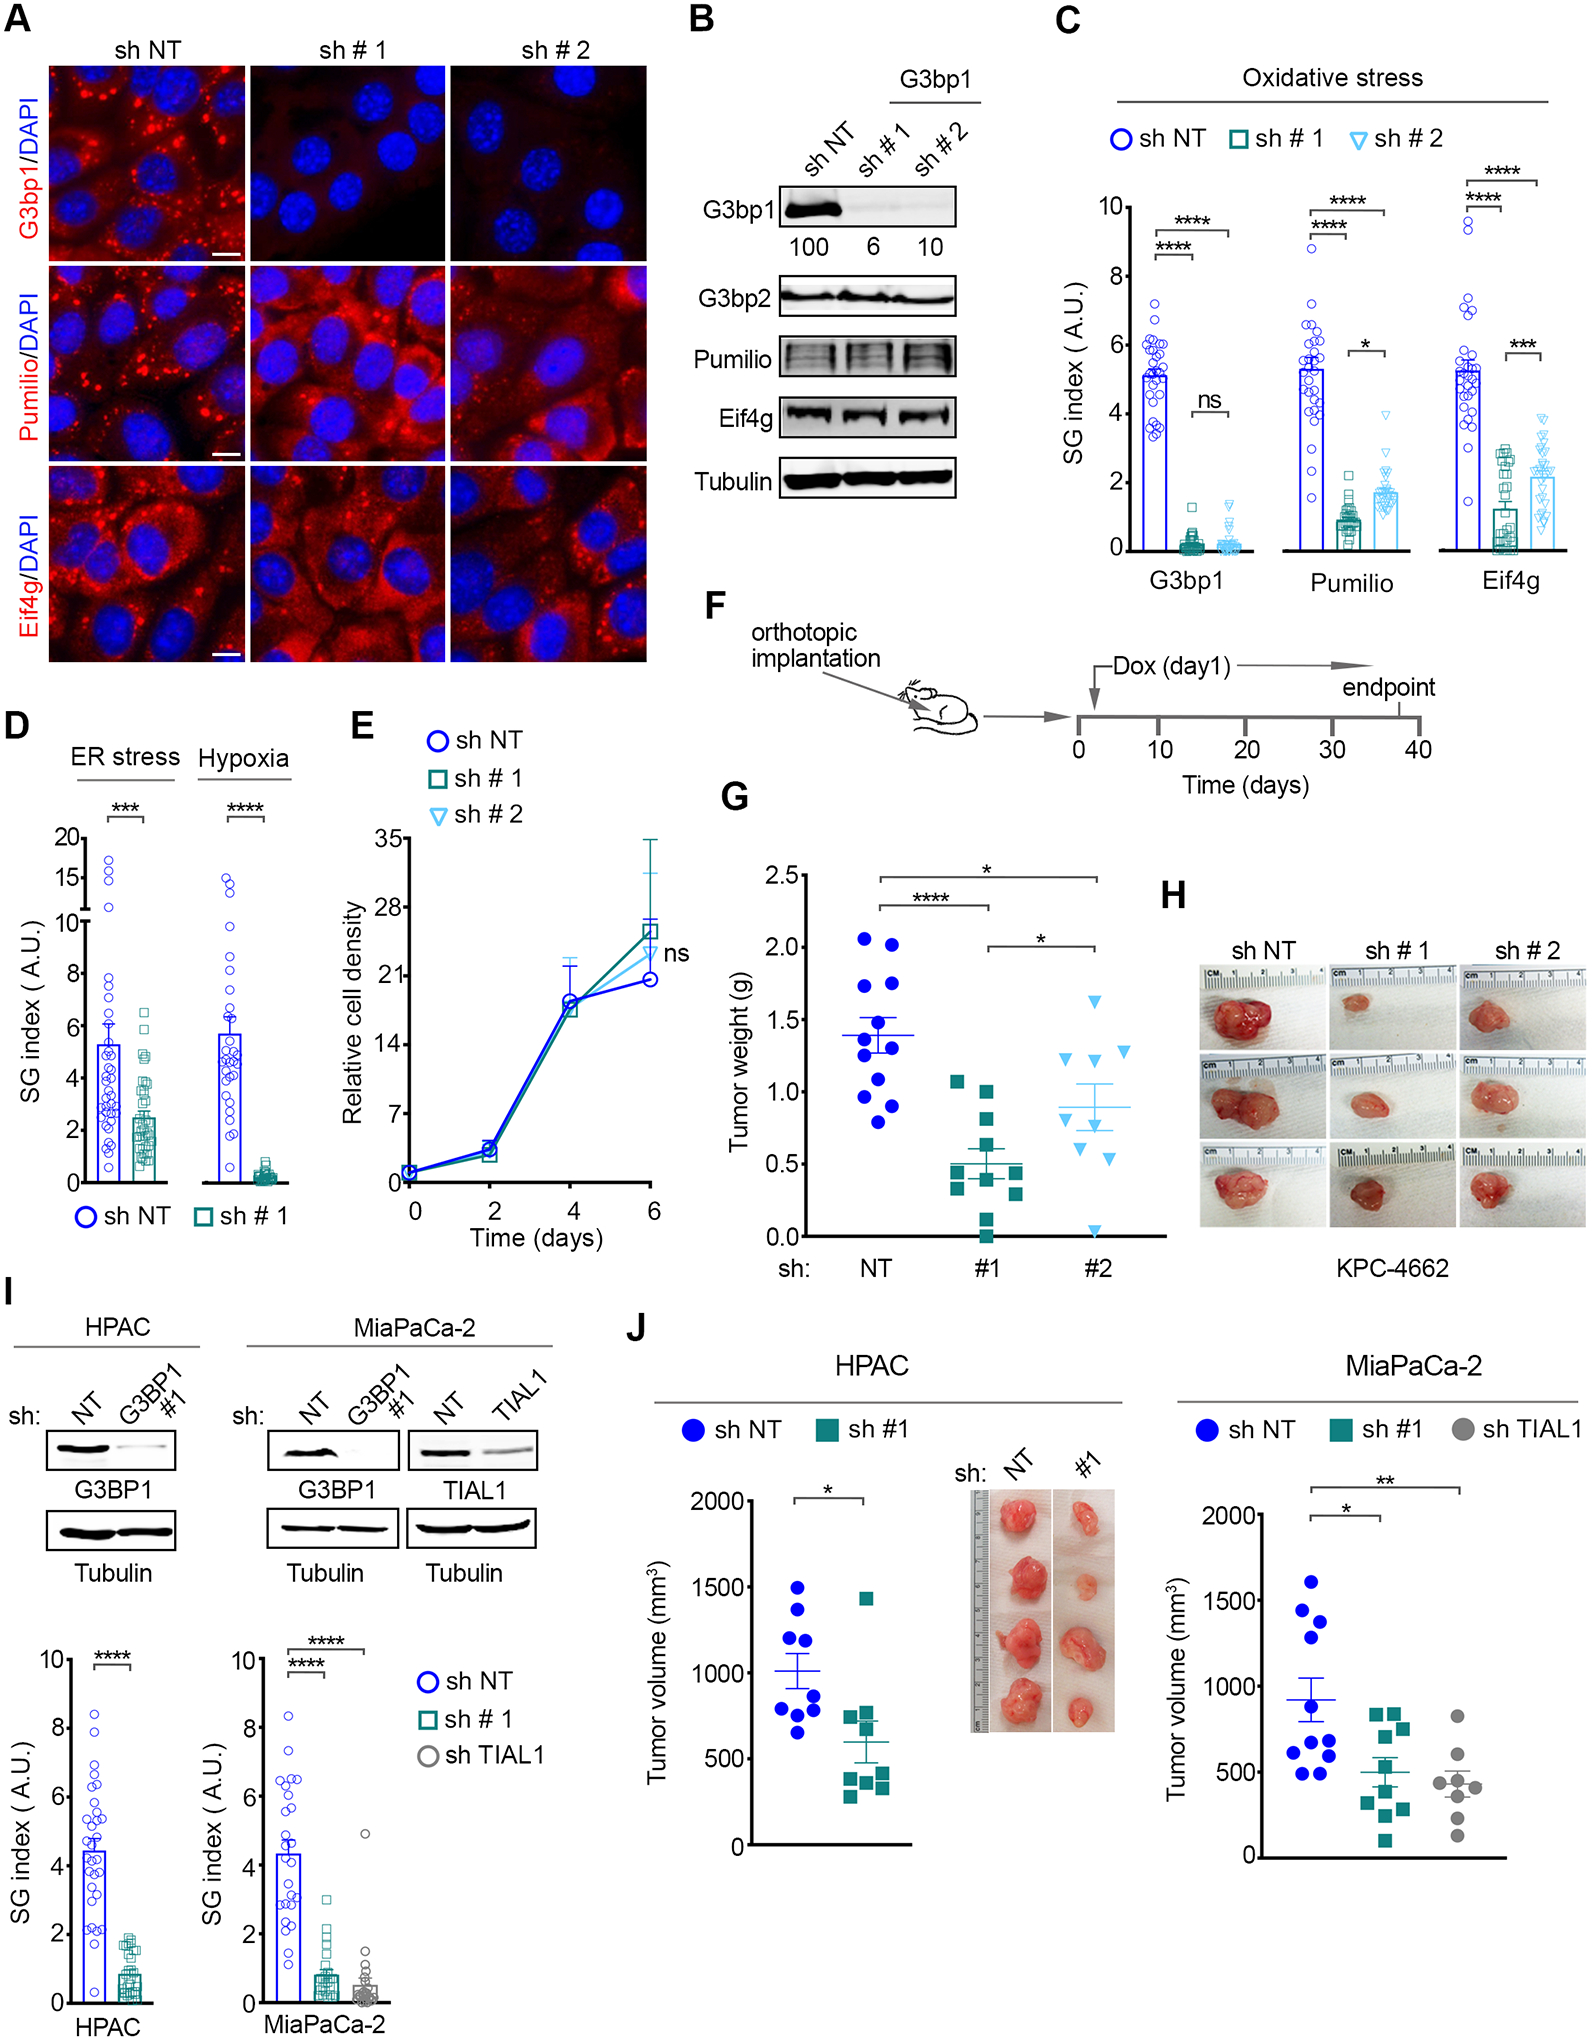
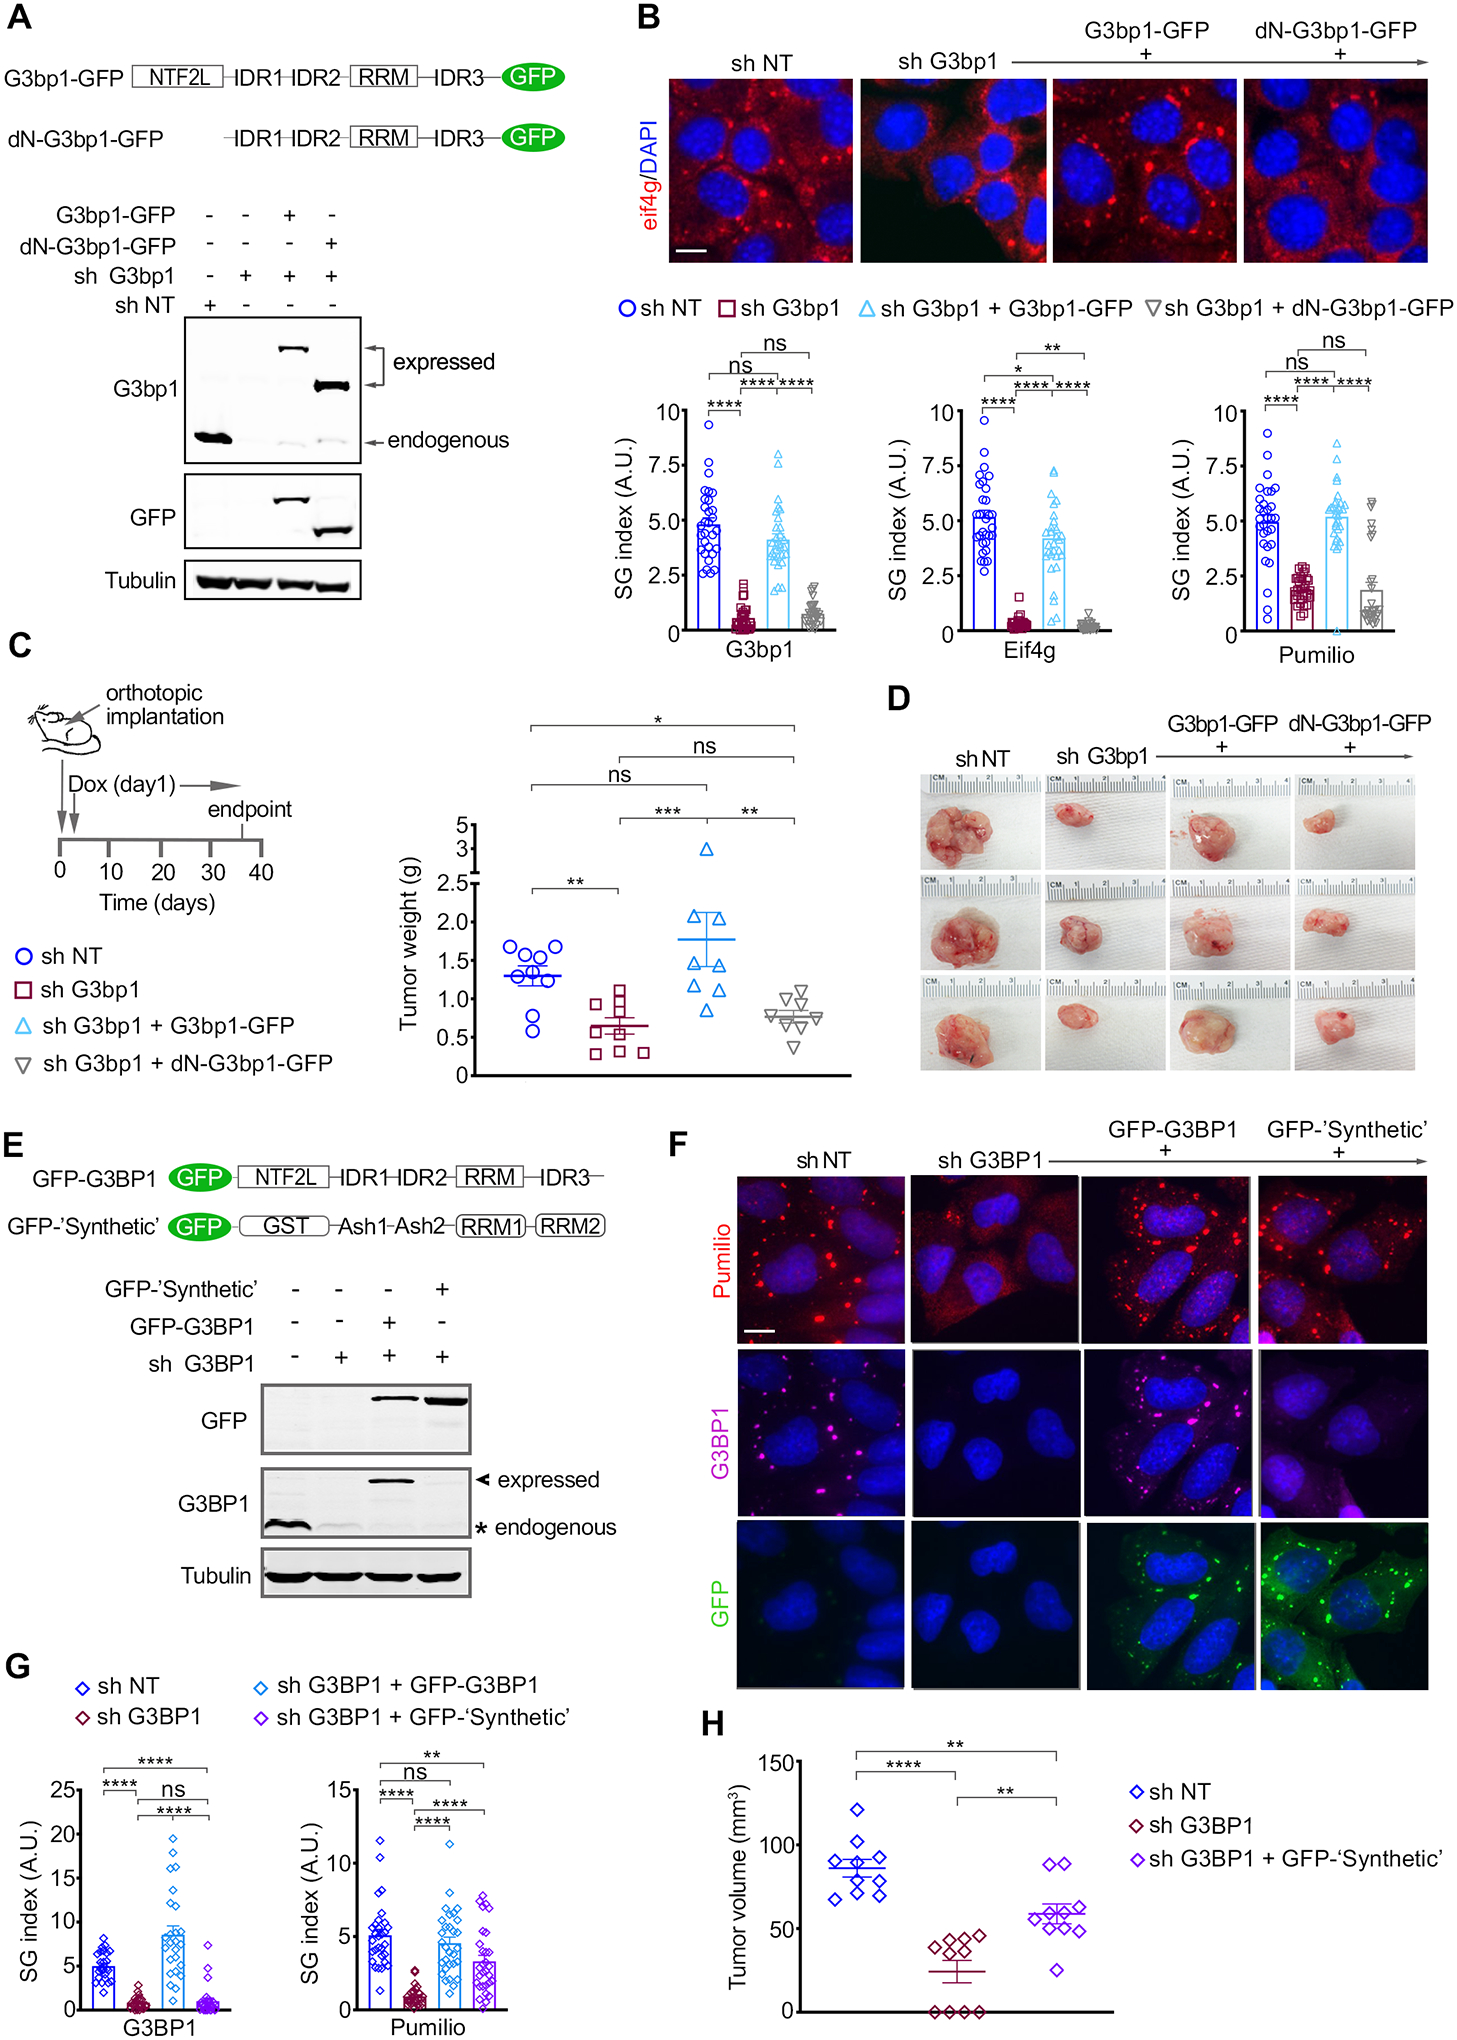
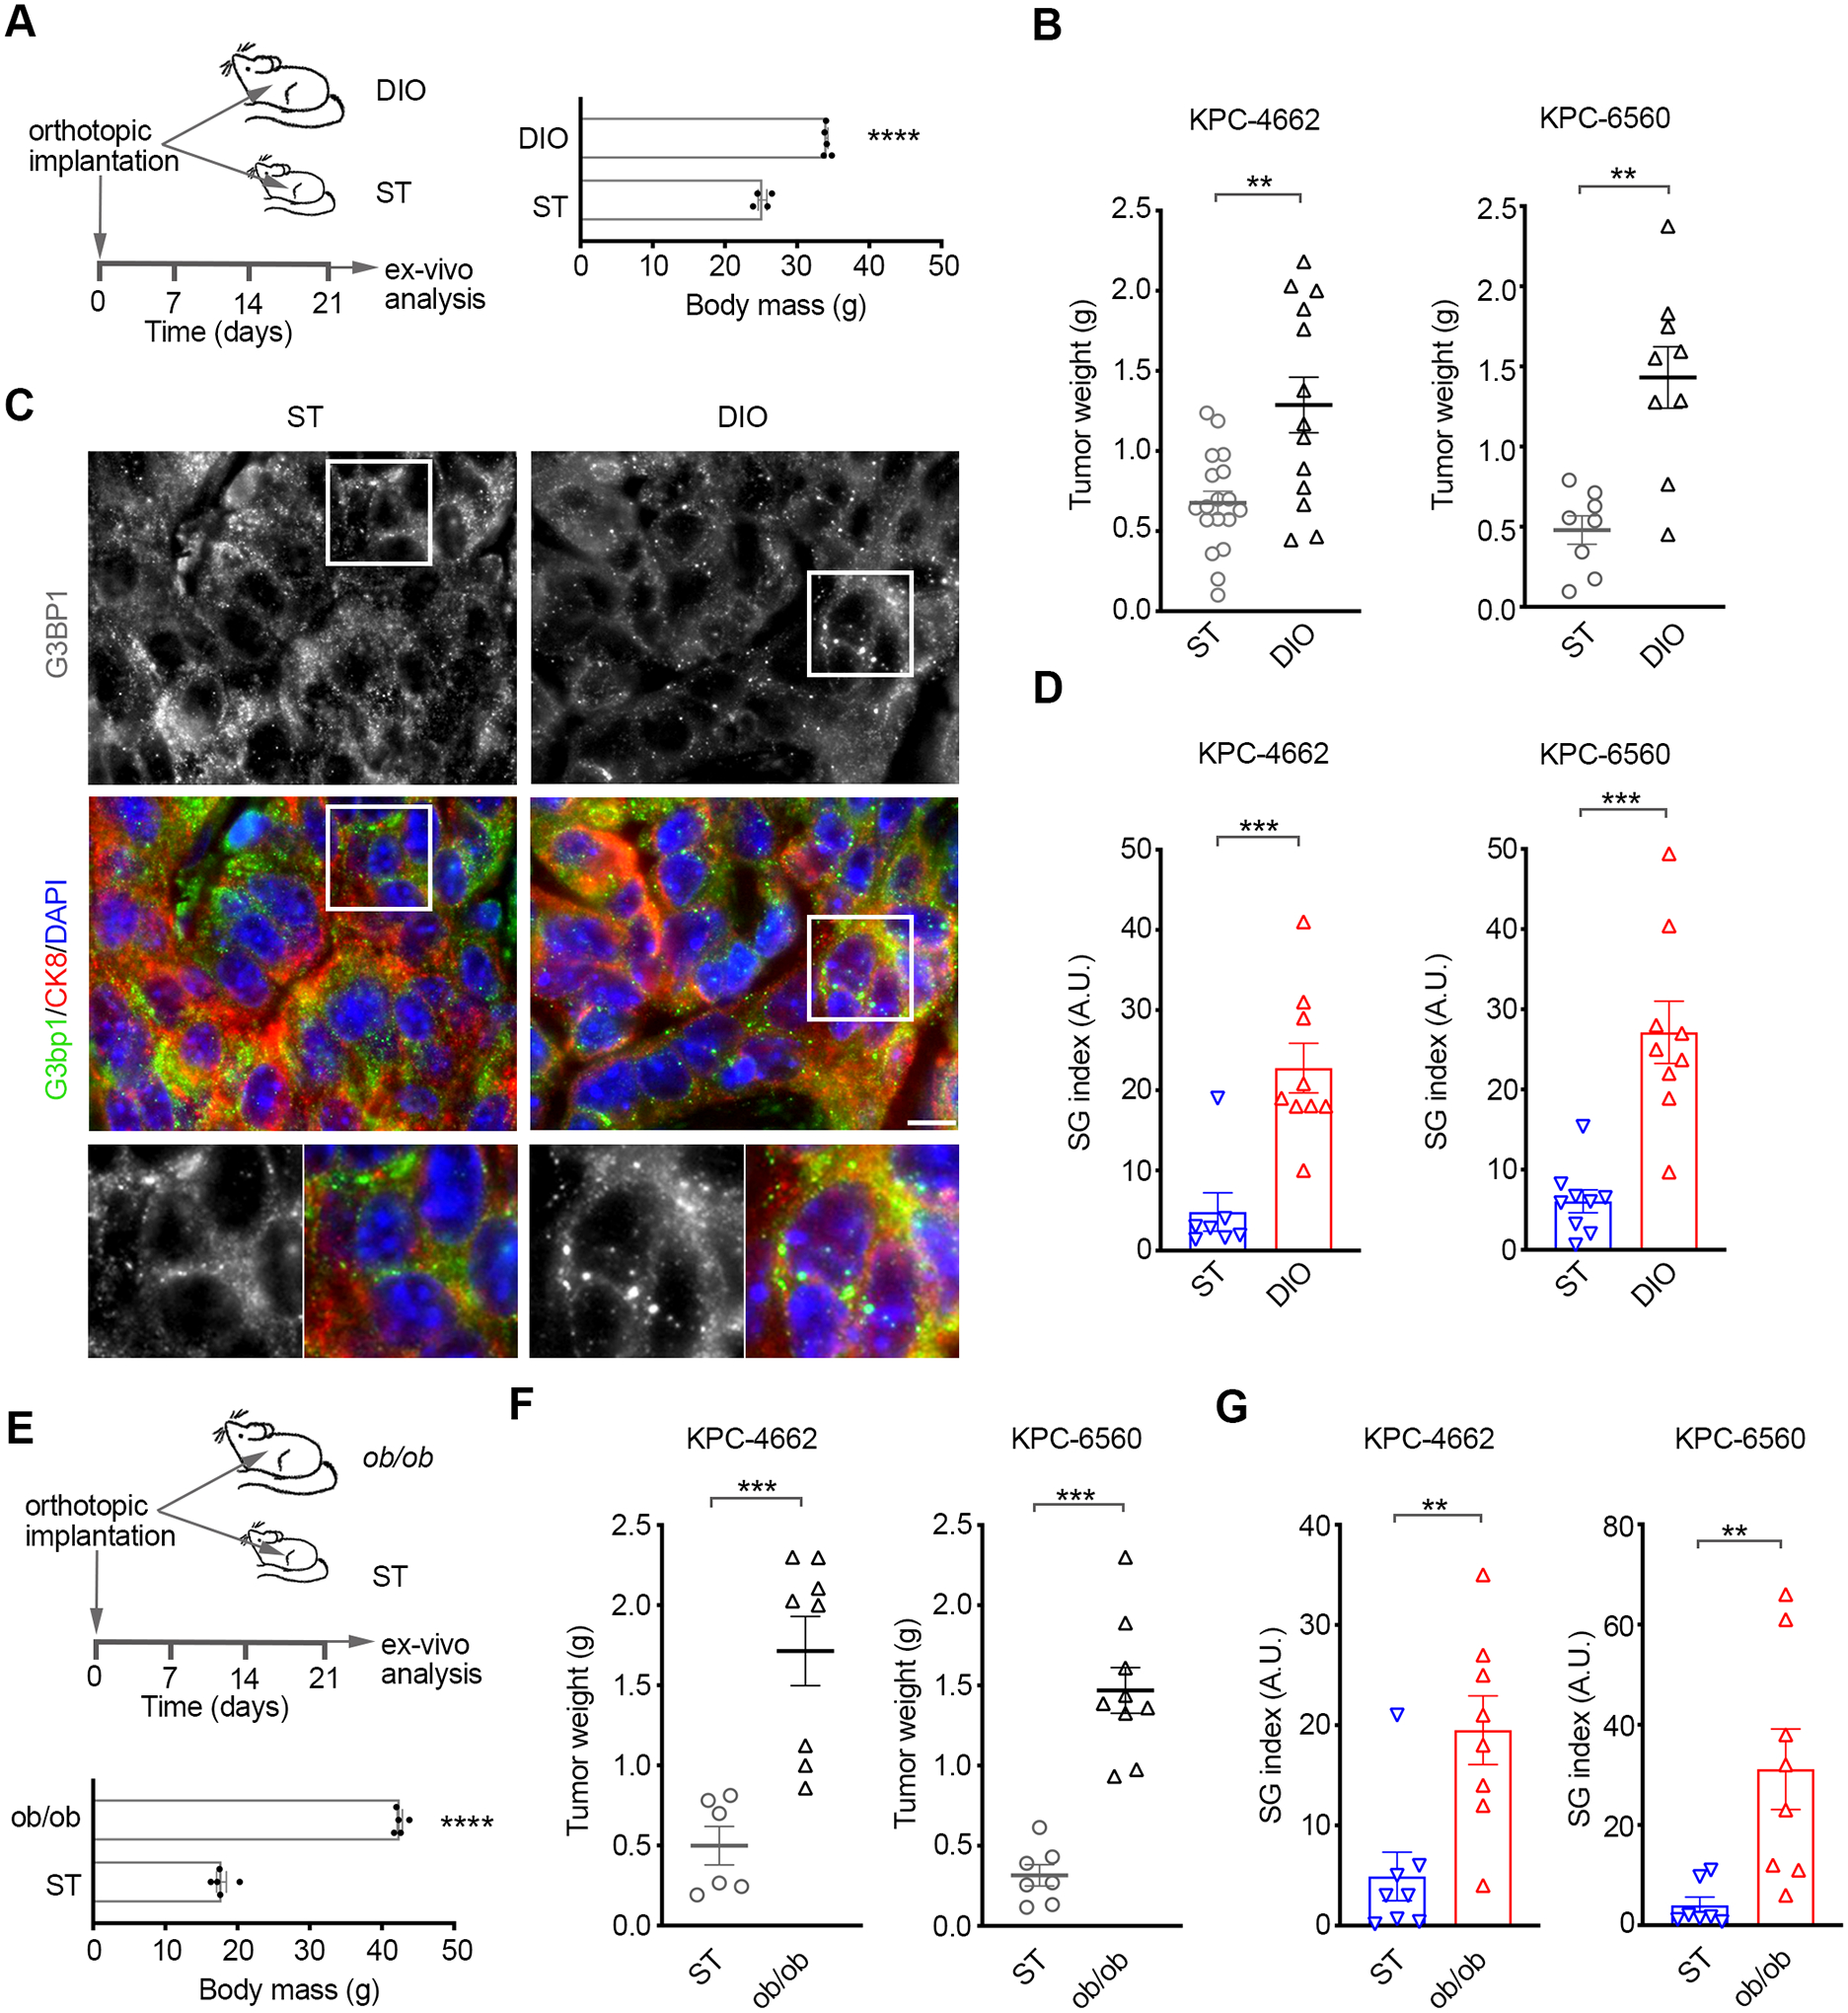
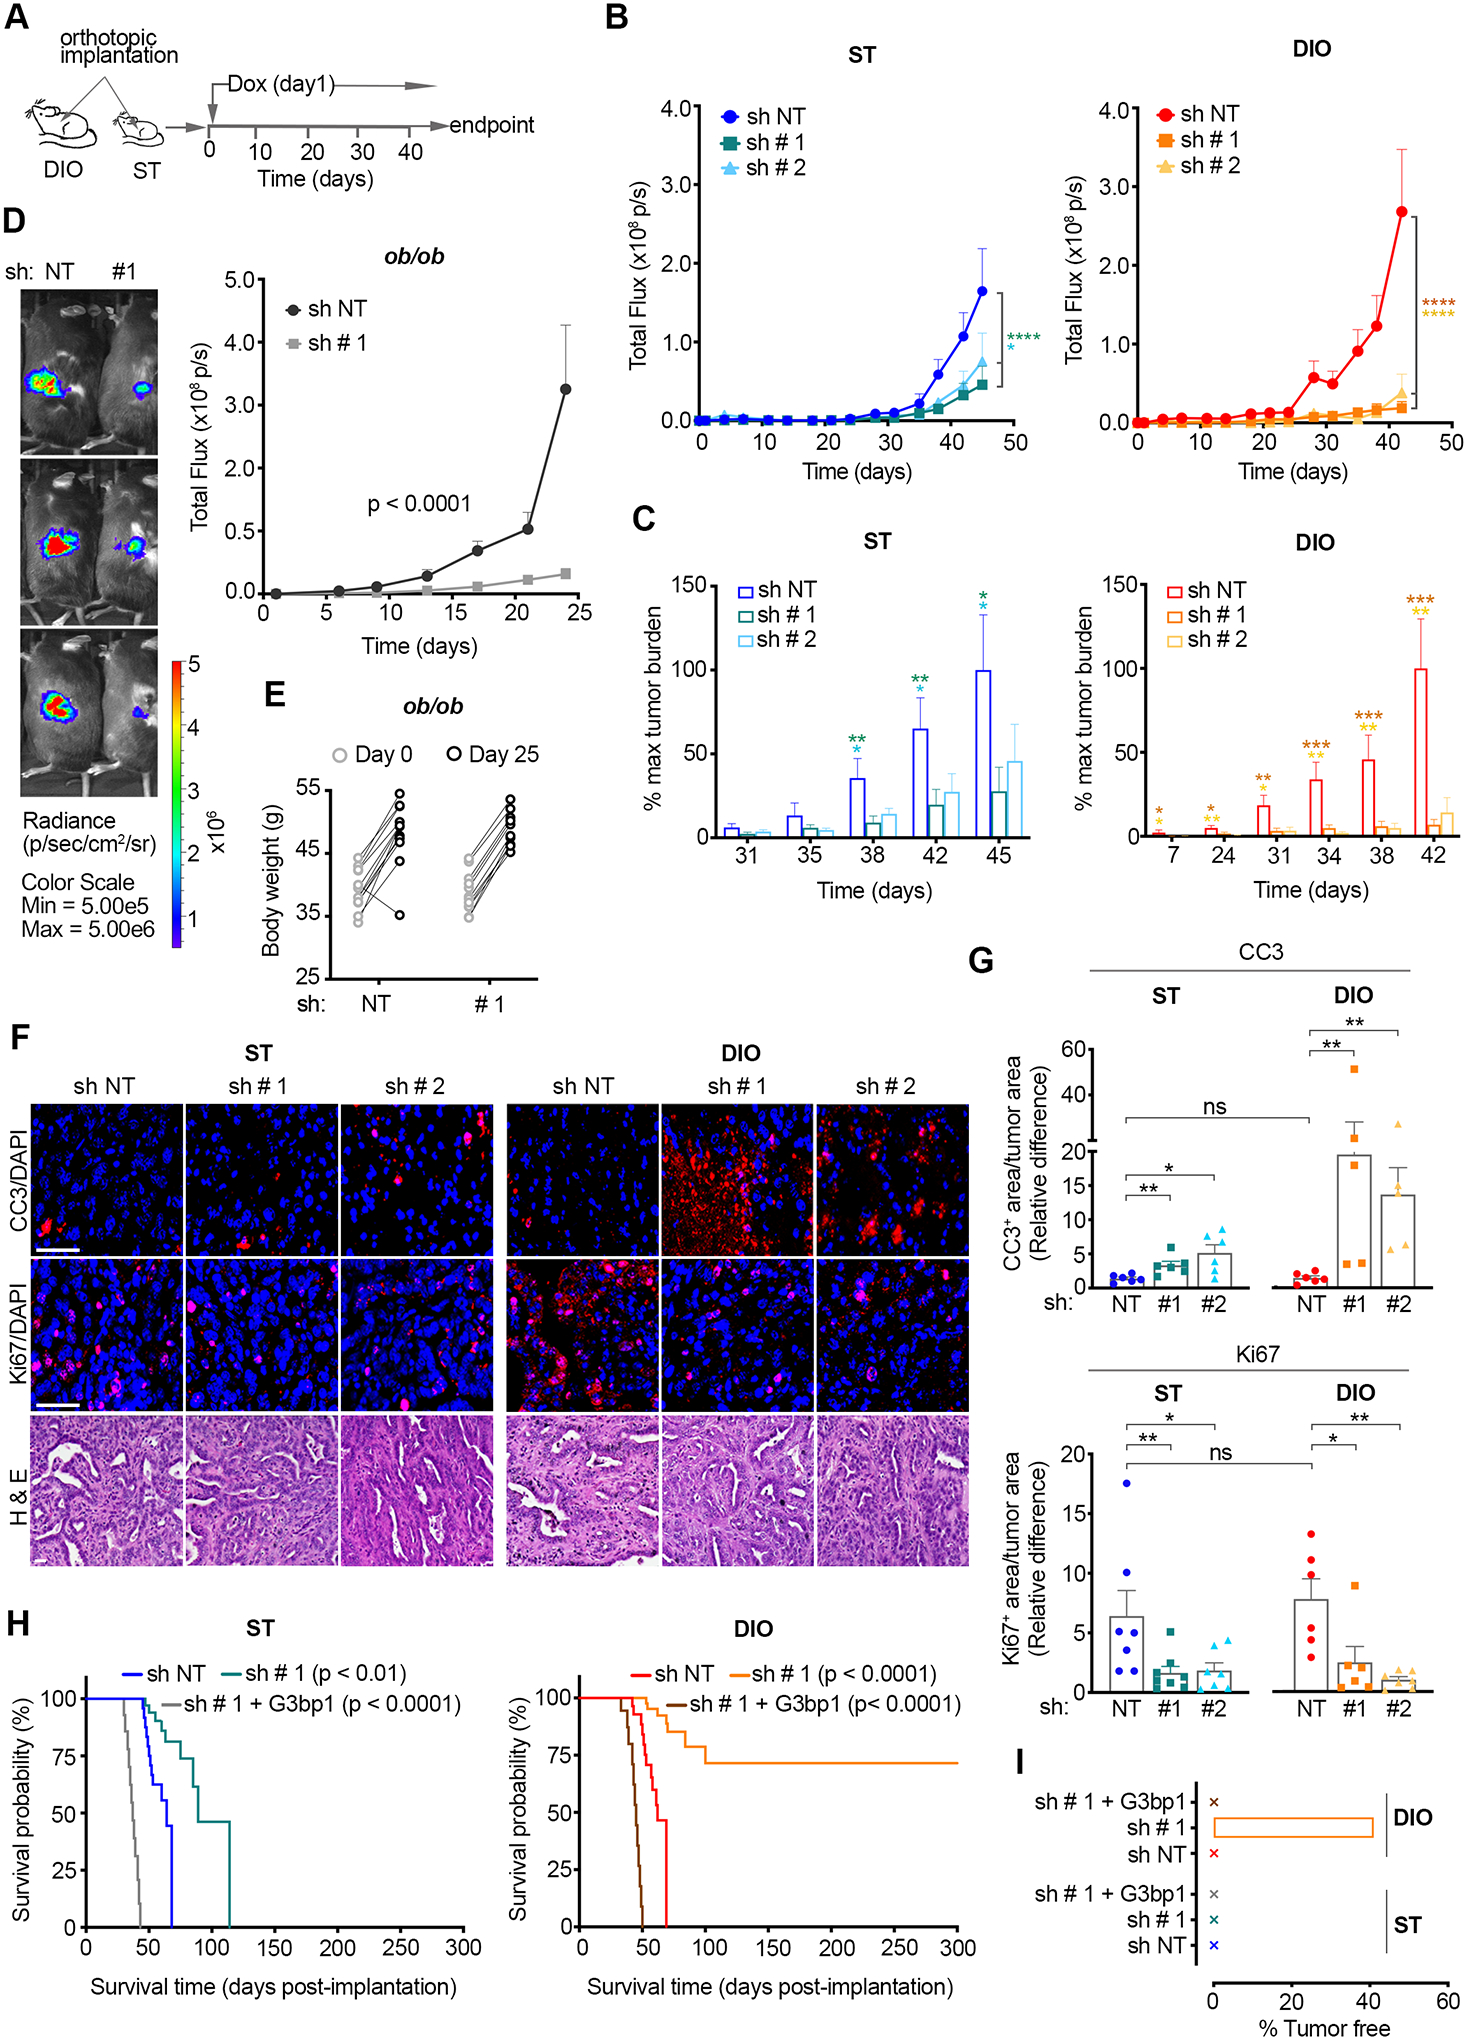
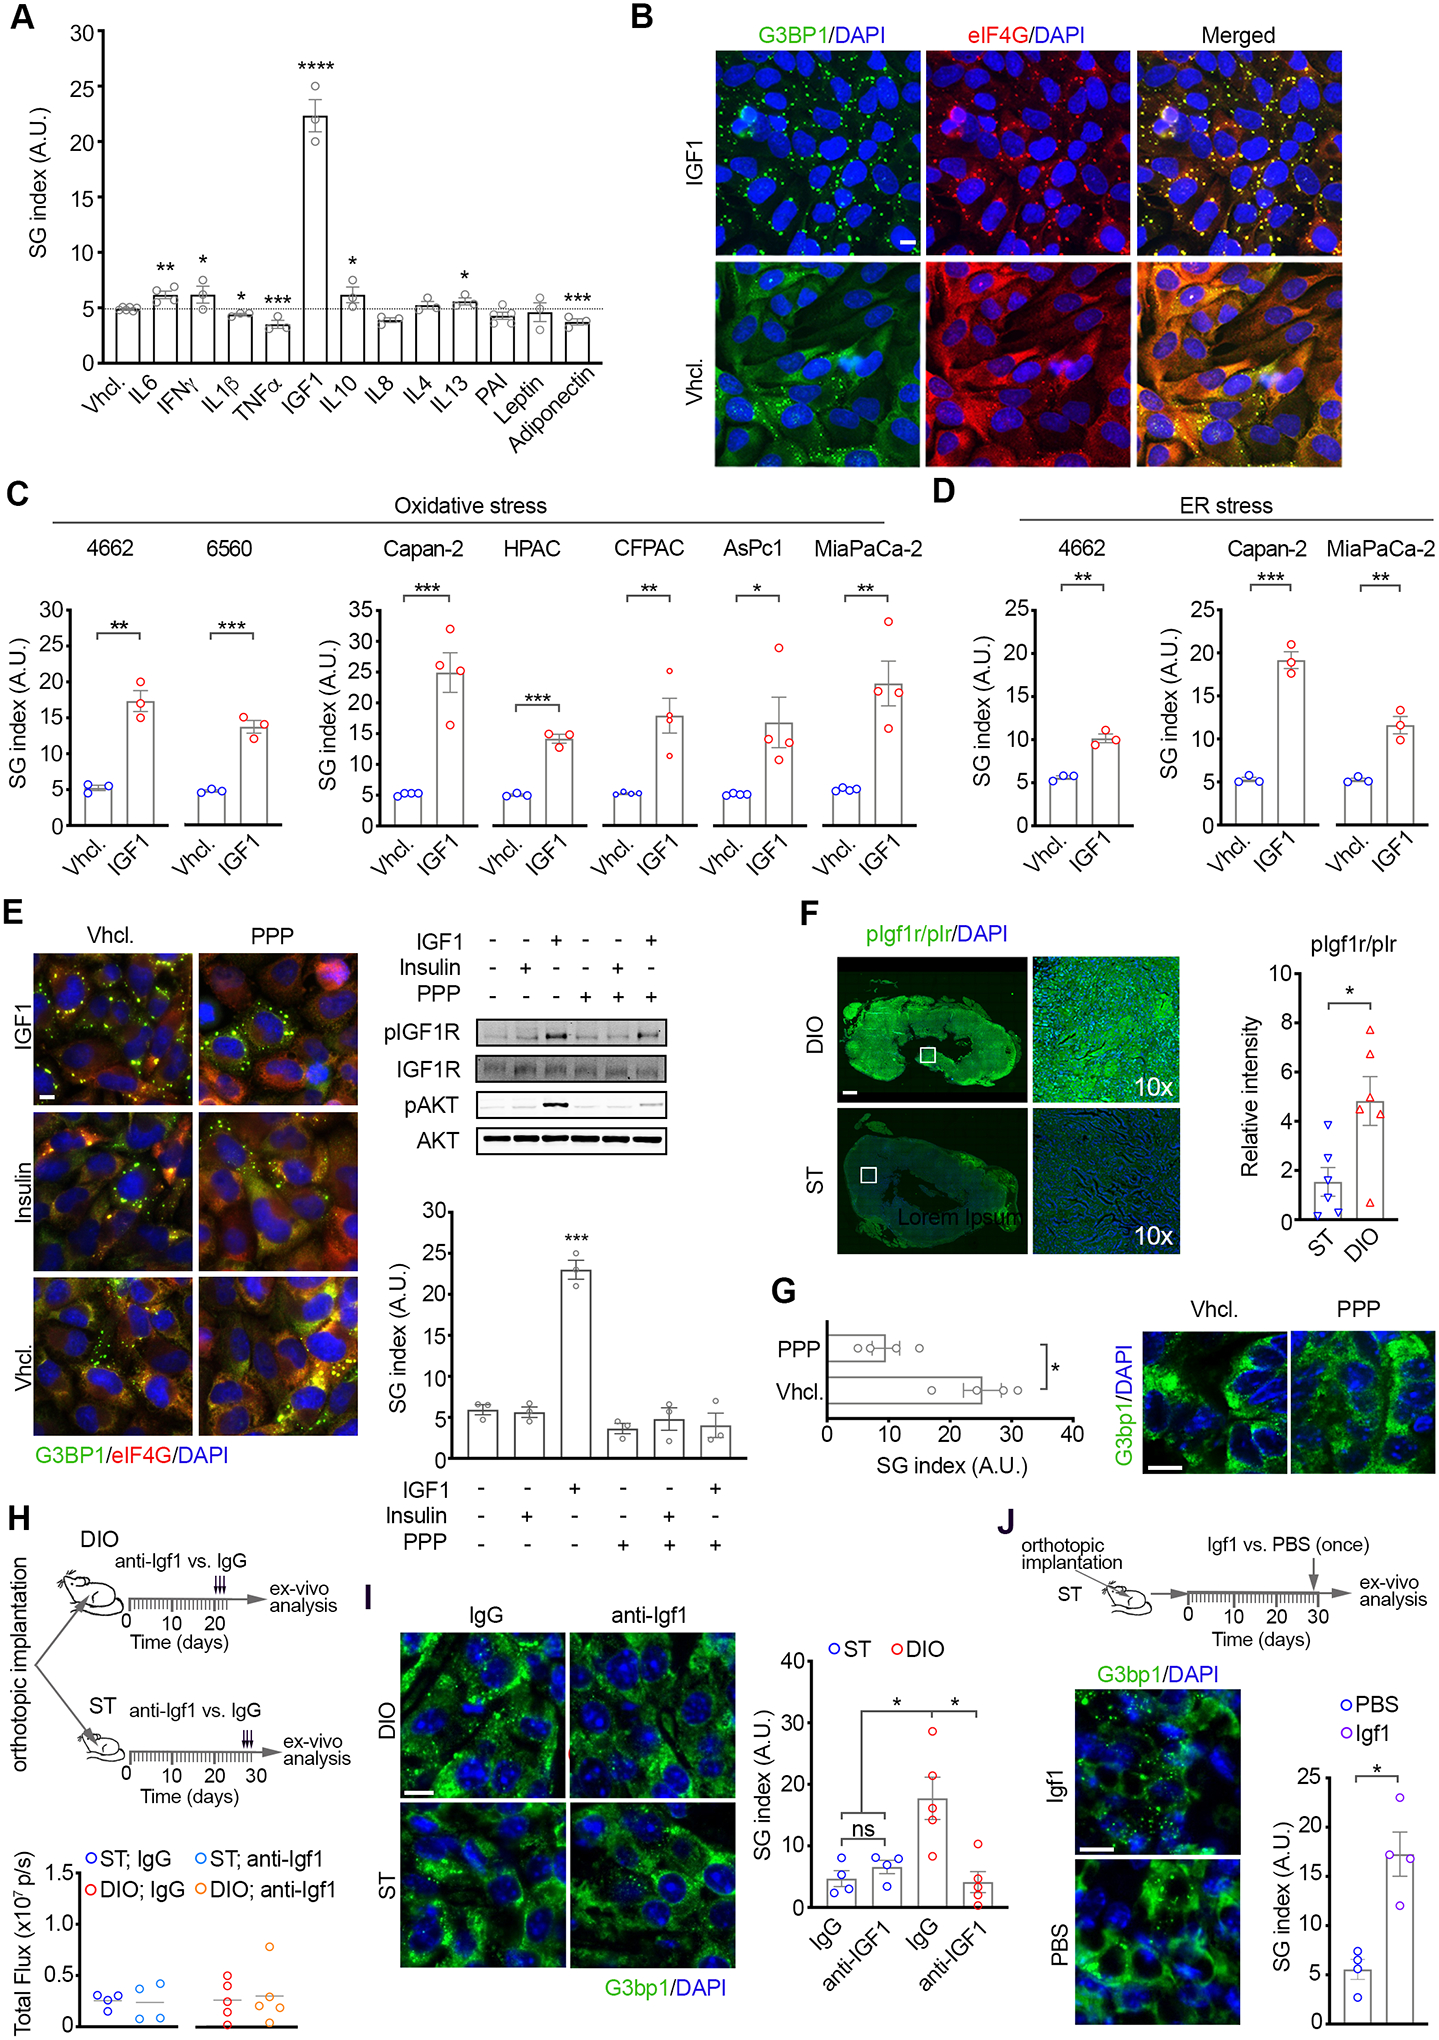
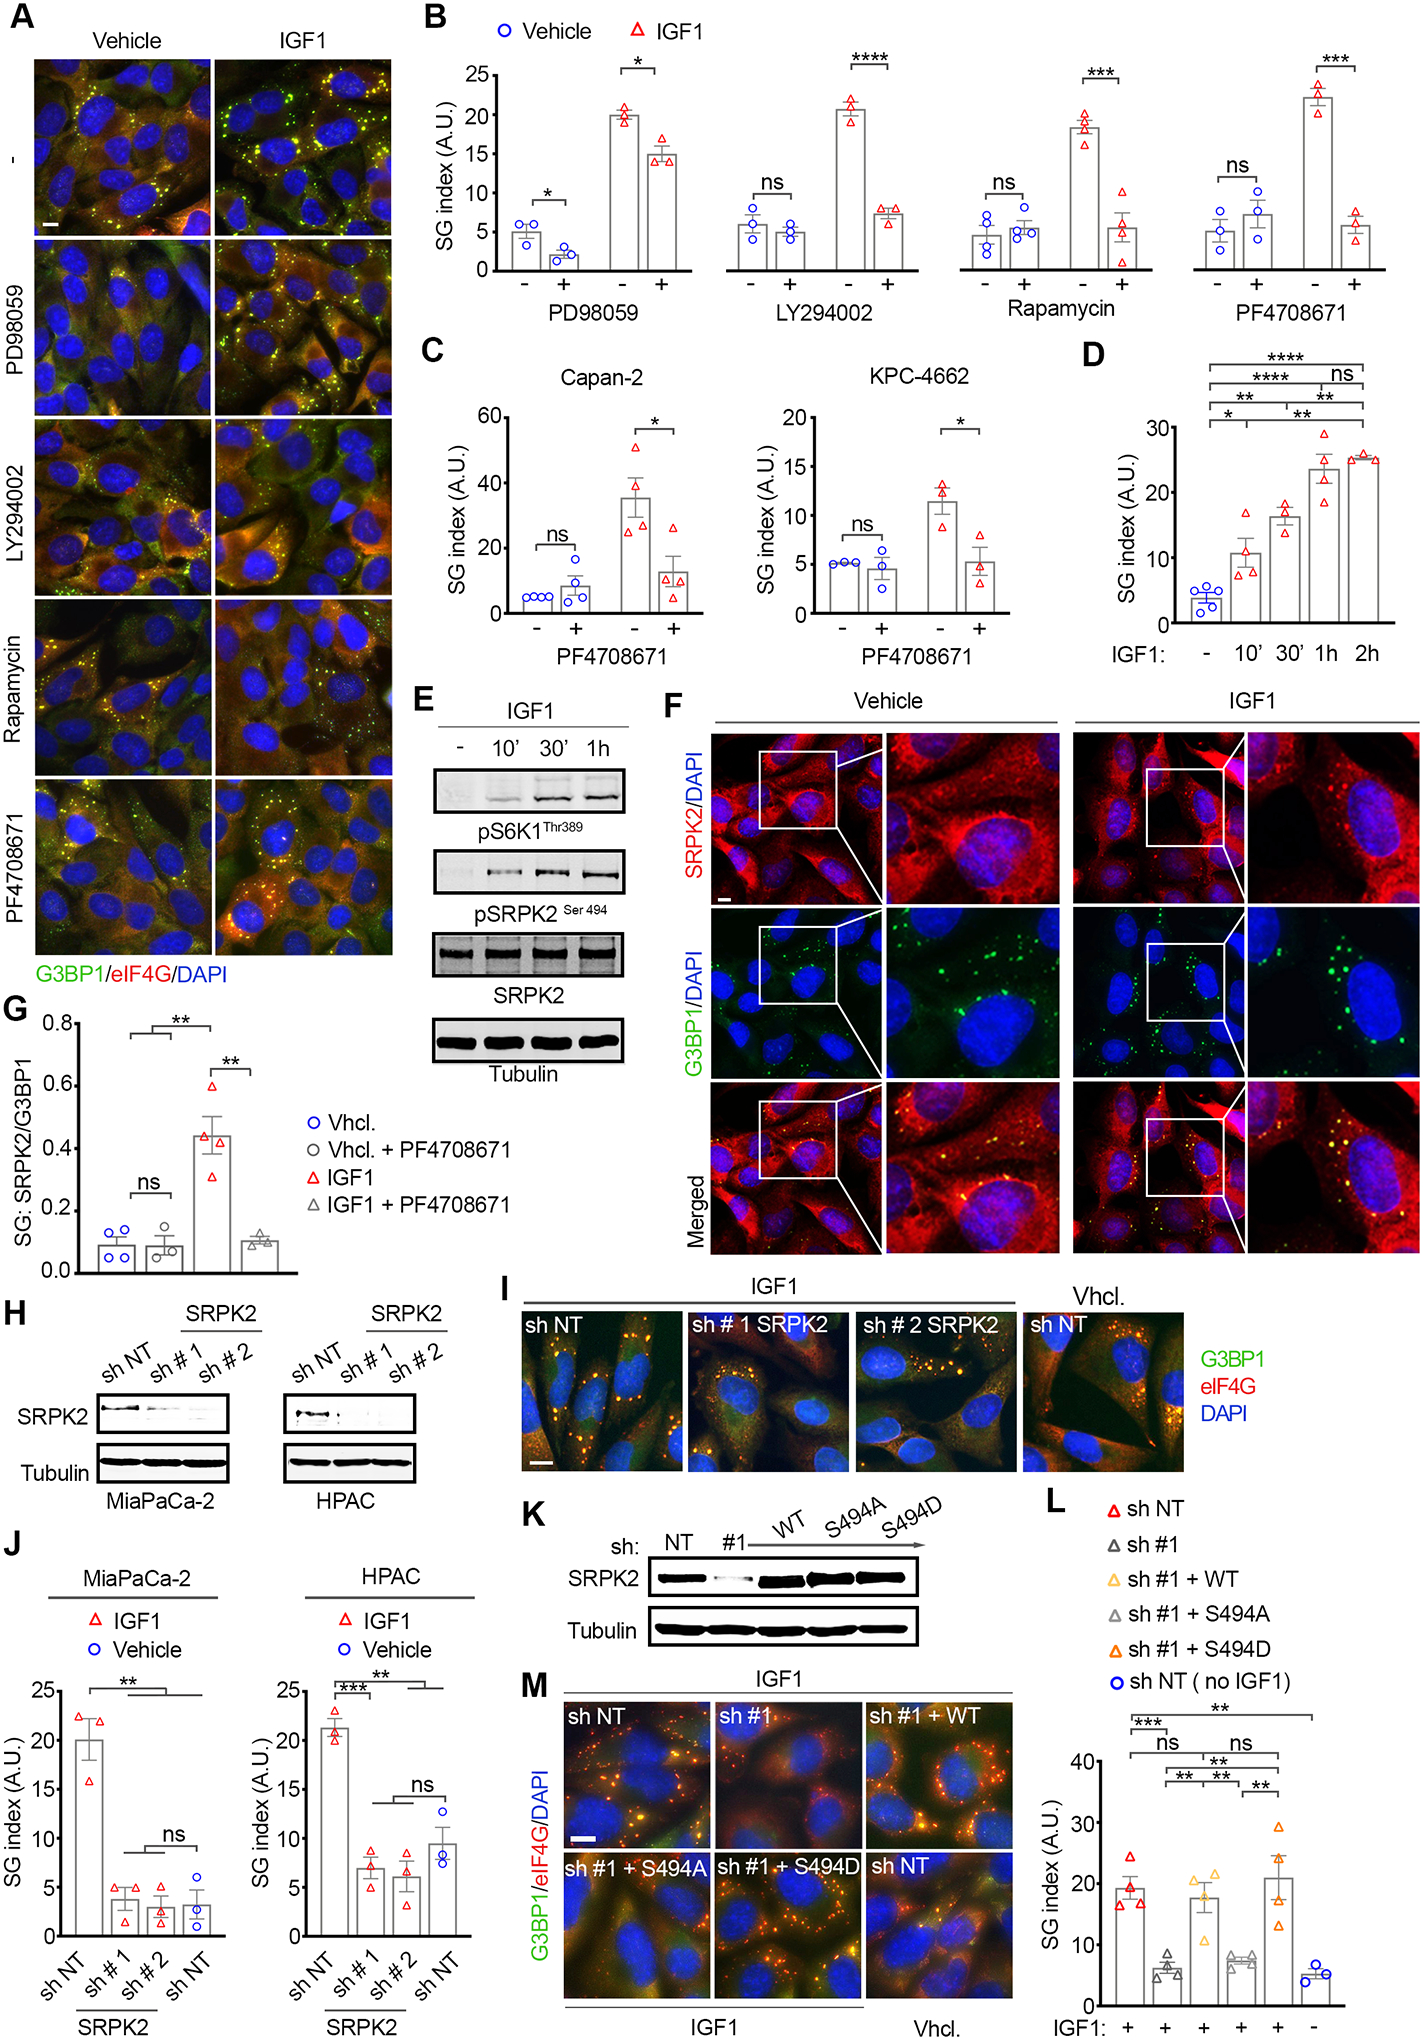
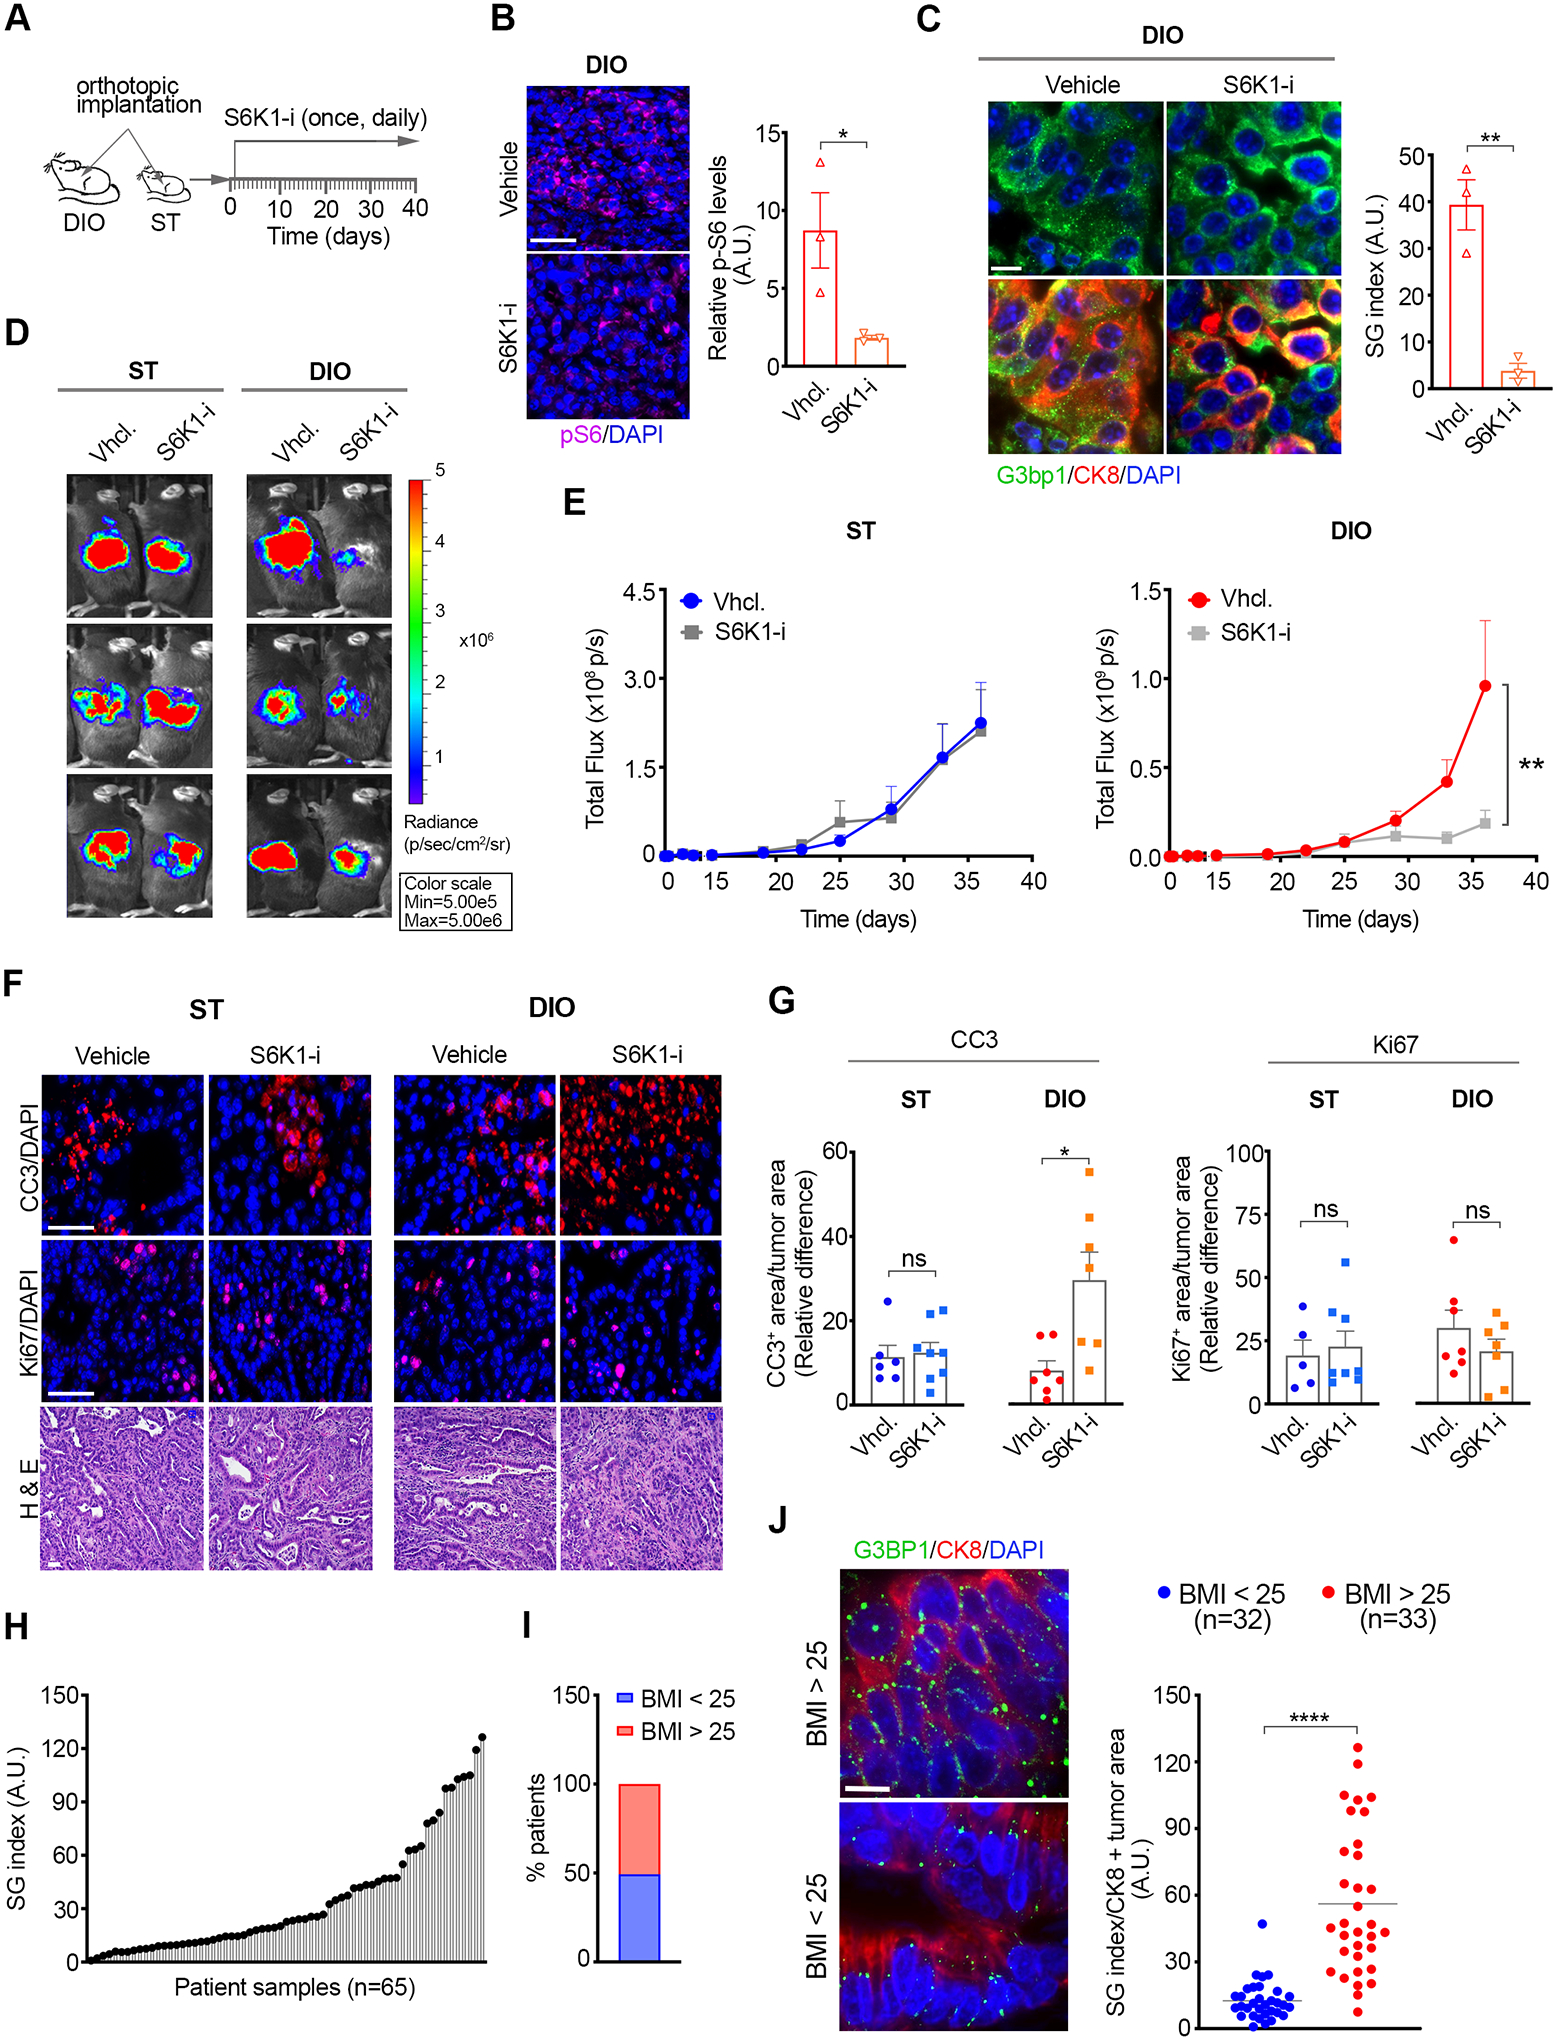
Obesity is a global epidemic and a major predisposing factor for cancer. Increasing evidence shows that obesity-associated stress is a key driver of cancer risk and progression. Previous work has identified the phase-separation organelles, stress granules (SG), as mutant KRAS-dependent mediators of stress adaptation. However, the dependence of tumorigenesis on these organelles is unknown. Here, we establish a causal link between SGs and pancreatic ductal adenocarcinoma (PDAC). Importantly, we uncover that dependence on SGs is drastically heightened in obesity-associated PDAC. Furthermore, we identify a previously unknown regulator and component of SGs, namely, the serine/arginine protein kinase 2 (SRPK2), as a specific determinant of SG formation in obesity-associated PDAC. We show that SRPK2-mediated SG formation in obesity-associated PDAC is driven by hyperactivation of the IGF1/PI3K/mTOR/S6K1 pathway and that S6K1 inhibition selectively attenuates SGs and impairs obesity-associated PDAC development.

Significance: : We show that stress adaptation via the phase-separation organelles SGs mediates PDAC development. Moreover, preexisting stress conditions such as obesity are a driving force behind tumor SG dependence, and enhanced SG levels are key determinants and a chemopreventive target for obesity-associated PDAC. This article is highlighted in the In This Issue feature, p. 1825.


Conflict of interest statement

Conflict of Interest Statement: The authors declare no potential conflicts of interest.

Figures

Figure 1.
Figure 1.. G3BP1 knockdown impairs SG formation and pancreatic cancer growth.
(A) Representative immunostaining of the SG markers G3bp1, Pumilio, Eif4g and DAPI in KPC-4662 expressing a Dox-induced non-targeting shRNA (sh NT) and two shRNAs for G3bp1 (sh # 1, sh # 2) and subjected to oxidative stress. Oxidative stress was induced via treatment with 200 μM sodium arsenate (SA) for 1hr. Scale bar, 10 μm. (B) Western Blot (WB) of lysates from KPC-4662 cells expressing the indicated shRNAs as in A. (C) Quantification of SG index as detected by G3bp1, Pumilio, and Eif4g, in KPC-4662 cells as in A. Data from a representative experiment are shown in arbitrary units (a.u.) for each marker and as mean +/− SEM for 30 non-overlapping fields of view (FOV) imaged at 20x. The individual values for each FOV are also shown. ****p<0.0001 by unpaired t-test. See also Figure S1A. (D) Quantification of SG index in the indicated KPC-4662 cells subjected to ER stress (Thapsigargin, 25 μM, 6 hr) or hypoxia (0.5% O2, 24 hr) as detected by Eif4G and Pumilio, respectively. Measurements from a representative experiment as in C are shown. ***p<0.001, ****p<0.0001 by unpaired t-test. (E) Relative cell density of KPC-4662 cells expressing the indicated shRNAs measured using a Syto60 stain. Data is mean +/− SD, n=3. ns = non-significant by unpaired t-test. (F) Schematic of the experimental approach used to assess the impact of G3bp1 knockdown on mPDAC growth. KPC-4662 cells were implanted orthotopically in the pancreas. shRNA expression was induced 24 hr after implantation through Dox administration via drinking water which was changed every 3 days. (G-H) mPDAC tumor growth at experimental endpoint on day 37 post orthotopic implantation of KPC-4662 cells expressing the indicated shRNAs as in F. (G) Mean mPDAC tumor weight at endpoint +/− SEM and individual tumor weights for each mouse. (H) Representative orthotopic tumors. sh NT n=12, sh # 1 G3bp1 n=11, sh # 2 G3bp1 n=11. *p<0.05, **** p<0.0001 by Mann Whitney t-test. (I) Top Panel-WB of lysates from human PDAC cell lines MiaPaCa-2 and HPAC expressing the indicated Dox-inducible shRNAs. Bottom panel-Quantification of SG index as detected by eIF4G in cells under oxidative stress (SA, 100 μM, 1 hr). Measurements from a representative experiment as in C are shown. ****p<0.0001 by unpaired t-test. See also Figure S1D–E. (J) Xenografts of human PDAC cell lines expressing the indicated shRNAs. HPAC and MiaPaCa-2 cells were subcutaneously implanted in athymic nude mice. shRNA expression was induced as in F. Data is endpoint mean tumor volume +/− SEM. The individual tumor volumes for each mouse are shown. HPAC sh NT n=9, sh # 1 G3BP1 n=9; MiaPaCa-2 sh NT n=10, sh #1 G3BP1 n=10, TIAL1 sh n=8. *p<0.05, ** p<0.01 by Mann Whitney t-test.
Figure 2.
Figure 2.. SGs promote pancreatic tumorigenesis.
(A) Schematic of G3bp1 expression constructs and WB of lysates of KPC-4662 cells expressing the indicated Dox-inducible shRNA and shRNA-resistant G3bp1 constructs. (B) Top Panel-Representative immunostaining of Eif4g and DAPI in KPC-4662 cells expressing the indicated constructs as in A and stressed as in 1A. Scale bar, 10 μm. Bottom Panel-Quantification of SG index as detected by G3bp1, Pumilio, and Eif4g. Measurements as in 1C are shown. *p<0.05, ** p<0.01, ****p<0.0001 by unpaired t-test. See also Figure S2A–C. (C) Left Panel-Schematic of the experimental approach used to assess the impact of SG inhibition on mPDAC growth. KPC-4662 cells were implanted and induced to express the indicated shRNA and shRNA-resistant constructs as in 1F. Right Panel-Mean mPDAC tumor weight at endpoint +/− SEM and individual tumor weights. sh NT n=9, sh # 3 G3bp1 n=9, sh # 3 G3bp1+ G3bp1-GFP n=8, sh # 3 G3bp1+ dN-G3bp1-GFP n=8. *p<0.05, ** p<0.01, *** p<0.001 by Mann Whitney t-test. (D) Representative mPDAC tumors from mice implanted with the KPC-4662 cell lines in C. (E) Schematic of expression constructs and WB of lysates of MiaPaCa-2 cells expressing the indicated Dox-inducible shRNAs, and shRNA-resistant G3BP1 and ‘synthetic’ constructs. (F) Representative immunostaining of G3BP1 and Pumilio in MiaPaCa-2 cells expressing the indicated constructs and stressed as in 1I. Scale bar, 10 μm. (G) Quantification of SG index as detected by G3BP1 and Pumilio in MiaPaca-2 cells in F. Measurements as in 1C are shown. **p<0.01, ****p<0.0001 by unpaired t-test. See also Figure S2. (H) Xenografts of MiaPaCa-2 cells expressing the indicated shRNAs and ‘synthetic’ construct. Cell implantation and induction of shRNA expression was performed as in 1J. Data are endpoint mean tumor volume +/− SEM and the individual tumor volumes for each mouse. MiaPaCa-2 sh NT n=10, sh # 2 G3BP1 n=10, sh # 2 G3BP1+ GFP- ‘Synthetic’ n=10. **p<0.01, ****p<0.0001 by Mann Whitney t-test.
Figure 3.
Figure 3.. SGs are upregulated in obesity-associated pancreatic cancer.
(A) Left Panel-Schematic of the experimental approach used to assess the effect of diet induced obesity (DIO) on mPDAC growth and SG levels. Right Panel-Body weight of age-matched (11–13 weeks) mice fed a standard diet (ST) and high-fat diet (DIO) at implantation of KPC cells. ****p<0.0001 by unpaired t-test. (B) mPDAC tumor growth at experimental endpoint on day 21 post orthotopic implantation of KPC-4662 and KPC-6560 cells in mice as in A. Data are mean tumor weight at endpoint +/− SEM and individual tumor weights for each mouse. KPC-4662 ST n=18, KPC-4662 DIO n=13, KPC-6560 ST n=8, KPC-6560 DIO n=9, ** p<0.01 by Mann Whitney t-test. C) Representative immunostaining of G3bp1 and DAPI in KPC-4662 orthotopic tumors in B. Scale bar, 10 μm. Lower panels are 2x zoom-in of boxed regions. (D) Quantification of SG index in sections from tumors in B as detected by G3bp1. Data are mean SG index +/− SEM and individual values for each tumor. The SG index for each tumor section is the average of 30 non-overlapping FOV imaged at 40x. *** p<0.001 by Mann Whitney t-test. (E) Schematic of the experimental approach used to assess mPDAC growth and SG levels in ob/ob mice. Body weight of age-matched (7 weeks) of ST and ob/ob mice at implantation. ****p<0.0001 by unpaired t-test. (F) mPDAC tumor growth at experimental endpoint on day 21 post orthotopic implantation of KPC-4662 and KPC-6560 cells in ST and ob/ob mice. Data are mean tumor weight at endpoint +/− SEM and individual tumor weights for each mouse. KPC-4662 ST n=6, KPC-4662 ob/ob n=8, KPC-6560 ST n=7, KPC-6560 ob/ob n=9, *** p<0.001 by Mann Whitney t-test. (G) Quantification of SG index in sections from tumors in F as detected by G3bp1. Data was derived and shown as in D. ** p<0.01 by Mann Whitney t-test.
Figure 4.
Figure 4.. Dependence of obesity-associated pancreatic cancer on SGs.
(A) Schematic of the experimental approach used to assess the impact of SG inhibition on mPDAC growth in DIO and ST immunocompetent mice. Luciferase expressing KPC-4662 cells were implanted orthotopically and expression of the indicated shRNAs was induced as in 1F. (B) Quantification of tumor bioluminescent signal (total flux p per second) over time post orthotopic implantation of KPC-4662 cells in ST and DIO mice as in A. Data are mean signal +/− SEM of individual tumors in each group; ST (sh NT n=12, sh # 1 G3bp1 n=13, sh # 2 G3bp1 n=13), DIO (sh NT n=12, sh # 1 G3bp1 n=14, sh # 2 G3bp1 n=9). *p<0.05, ****p<0.0001 by two-way ANOVA. (C) Quantification of tumor growth over time as percent of mean bioluminescent signal at endpoint in B. Data are mean +/− SEM of individual mice in each group as in B. *p<0.05, **p<0.01, ***p<0.001 by Mann Whitney t-test. (D) Left Panel - Representative bioluminescent images. Images taken on day 24 post orthotopic implantation of the indicated KPC-4662 cells in ob/ob immunocompetent mice are shown. The scale indicates radiance expressed as p/sec/cm2/sr. Right Panel - Quantification of bioluminescent signal over time post orthotopic implantation of KPC-4662 cells expressing the indicated shRNAs. Data are presented as mean +/− SEM of individual mice in each group. ob/ob (sh NT n=12, sh # 1 G3bp1 n=12). ****p<0.0001 by two-way ANOVA. (E) Body weight of ob/ob mice on day 0 and 25 post orthotopic implantation of KPC-4662 cell lines expressing the indicated shRNAs as in D. (F) Representative immunostaining of cleaved caspase 3 (CC3), Ki67, DAPI, and H&E in sections from KPC-4662 orthotopic tumors in A-C. Scale bar, 50 μm. (G) Quantification of CC3 or Ki67 positive (+) areas in tumors in A-C. Data are mean caspase 3 area, or Ki67 area, over total tumor area +/− SEM of individual tumors in mice in each group of A-C. The values for each tumor represent the average of non-overlapping FOV imaged at 20x and covering ~50% of each section. * p<0.05, ** p<0.01 by Mann Whitney t-test. (H) Kaplan-Meier survival curves for ST and DIO mice implanted with KPC-4662 cells and induced to express the indicated shRNA and shRNA-resistant constructs. ST (sh NT n=12, sh # 1 G3bp1 n=9, sh # 1 G3bp1 + G3bp1 WT n=12), DIO (sh NT n=12, sh # 1 G3bp1 n=12, sh # 1 G3bp1 + G3bp1 WT n=12). p-values by log-rank (Mantel-Cox) t-test are shown. (I) Percent tumor-free mice as in F on day 300.
Figure 5.
Figure 5.. Obesity-associated IGF1 and hyperactivation of IGF1R mediates SG upregulation in obesity-associated pancreatic cancer.
A) Quantification of SG index as detected by G3BP1 in MiaPaCa-2 cells treated with the indicated obesity-associated factors for 2 hr followed by oxidative stress (SA, 100 μM, 1 hr). Data are mean SG index +/− SEM, n=3, and individual values for each experiment. *p<0.05, **p<0.01, ***p<0.001, ****p<0.0001 by unpaired t-test. (B) Representative immunostaining of G3BP1, eIF4g and DAPI in MiaPaCa-2 cells pre-treated with IGF1 (100 ng/ml, 2 hr) and stressed as in A. Scale bar, 10 μm. (C) Quantification of SG index as detected by G3BP1 in a panel of mouse (KPC-4662, KPC-6560) and human (Capan-2, HPAC, MiaPaCa-2, CFPAC, and AsPc-1) PDAC cells pretreated with murine or human IGF1 (100 ng/ml, 2 hr) accordingly, and stressed as in A. See also S5. (D) Quantification of SG index as detected by G3BP1 in cells treated with IGF1 as in B and subjected to ER stress (Thapsigargin). (C-D) Data are mean SG index +/− SEM, n=3, and individual values for each experiment. *p<0.05, **p<0.01, ***p<0.001 by unpaired t-test. (E) Left Panel-Representative immunostaining of G3BP1, eIF4G, and DAPI in MiaPaCa-2 cells stressed in the presence of IGF1 (100 ng/ml, 2 hr), Insulin (5 ng/ml, 2 hr), or vehicle and Picropodophyllin (PPP, 0.5 μM). Scale bar, 10 μm. Right Panel- WB of lysates from MiaPaCa-2 cells treated as indicated. Quantification of SG index as detected by G3BP1 in MiaPaCa-2 cells treated as in the left panel from at least 3 independent experiments. Data are mean SG index +/− SEM, ****p<0.0001 by unpaired t-test. (F) Representative immunostaining of pIGF1R/pIr and DAPI in tissue sections from KPC-4662 tumors in ST and DIO mice as in 3B. Scale bar, 50 μm. Right panels are 10x-zoom in of boxed regions. Graph shows mean immunofluorescence intensity +/− SEM and values for each tumor. The value for each tumor is the average of non-overlapping FOV covering ~50% of each section imaged at 20x. *** p<0.001 by Mann Whitney t-test. (G) Left Panel-SG index in KPC-4662 tumors in DIO mice as in 3A-C. Two weeks post implantation mice were treated with 20 mg/kg PPP every 12 hr by i.p. injection for a total of 48 hr. Quantification of SG index in tumor sections was performed as in 3D. Data are mean SG index +/− SEM, and individual values for each tumor, *** p<0.05 by Mann Whitney t-test. Right Panel- Representative immunostaining of G3bp1 and DAPI in sections from tumors treated as indicated. Scale bar, 10 μm. (H) Top Panel - Schematic of the experimental approach used to assess the impact of an Igf1-neutralizing antibody and IgG control on SGs in mPDAC in DIO and ST immunocompetent mice. Luciferase expressing KPC-4662 cells were implanted orthotopically. On ~day 20 and 27 post implantation in DIO and ST mice respectively, 0.1 μg/g of anti-Igf1 or IgG was administered every 24 hr by i.p. injection for a total of 72 hr. Bottom Panel - Bioluminescence measurements of orthotopic implants of KPC-4662 cells in DIO and ST mice on day of first anti-Igf1 or IgG administration showing equivalent tumor size. (I) Representative immunostaining of G3BP1 and DAPI and quantification of SG index in KPC-4662 tumor sections from DIO and ST mice in H. Scale bar, 10 μm. (J) Top Panel - Schematic of the experimental approach used to assess the impact of Igf1 on SGs in mPDAC in ST immunocompetent mice. Luciferase expressing KPC-4662 cells were implanted orthotopically in the pancreata of ST mice. Recombinant Igf1 was administered by i.p. injection (once) at 100 ng/mouse. Bottom Panel - Representative immunostaining of G3BP1 and DAPI and quantification of SG index in KPC-4662 tumor sections from ST mice treated as indicated. Scale bar, 10 μm. (I-J) Data are mean SG index +/− SEM, and individual values for each tumor, *p<0.05 by Mann Whitney t-test.
Figure 6.
Figure 6.. IGF1 promotes SG formation in PDAC cells by modulating S6K1-mediated partitioning of SRPK2 to SGs and activation.
(A) Representative immunostaining of G3BP1, eIF4G, and DAPI in MiaPaCa-2 cells stressed in the presence or absence of IGF1 as in 5A-C, and the MEK (PD98059) AKT, (LY294002), mTOR (Rapamycin), and S6K1 (PF4708671) inhibitors. Scale bar, 10 μm. See also S7A. (B) Quantification of SG index as detected by G3BP1 in MiaPaCa-2 cells in A. (C) Quantification of impact of S6K1 inhibition on SG index in mouse (KPC-4662) and human (Capan-2) cells treated as in A. (D) Quantification of SG index in MiaPaCa-2 cells pre-treated with IGF1 for the indicated time points and followed by oxidative stress (SA, 100 μM, 1 hr.) (B-D) Data are mean SG index +/− SEM, n=3, *p<0.05, ***p<0.001, ***p<0.0001 by unpaired t-test. (E) WB of MiaPaCa-2 cells treated with IGF1 as in D. (F) Representative immunostaining of SRPK2, G3BP1, and DAPI in MiaPaCa-2 cells treated as in A. Scale bar, 10 μm. Right panels for vehicle and IGF1 treated are 2x-zoom in of boxed regions. (G) Quantification of the partitioning of SRPK2 to SGs relative to G3BP1. Graph shows the ratio of SRPK2-SG area over G3BP1-SG area. Data are mean +/− SEM, n=3, and values for each experiment. At least 300 SG positive cells per condition were analyzed in each experiment. **p<0.01 by unpaired t-test. (H) WB of lysates from MiaPaCa-2 and HPAC cells expressing the indicated shRNAs. (I) Representative immunostaining of G3BP1 and DAPI in MiaPaCa-2 cells expressing the indicated shRNAs and treated as in A. Scale bar, 10 μm. (J) Quantification of SG index as detected by G3BP1 in MiaPaCa-2 cells in I. Data are mean +/− SEM, n=3, and values for each experiment. **p<0.01, ***p<0.001 by unpaired t-test. (K) WB of lysates from MiaPaCa-2 induced to express the indicated shRNAs and shRNA resistant constructs. (L) Quantification of SG index as detected by G3BP1 in MiaPaCa-2 cells in K. Data are mean +/− SEM, n=4, and values for each experiment. **p<0.01, ***p<0.001, ns = non-significant by unpaired t-test. (M) Representative images and quantification of SG index as detected by G3BP1 in MiaPaCa-2 cells expressing the indicated shRNAs and constructs. Data are mean +/− SEM, n=4, and values for each experiment. **p<0.01, ***p<0.001, ns = non-significant by unpaired t-test.
Figure 7.
Figure 7.. Selective dependence of obesity-associated PDAC on S6K1 for SG formation and tumor growth.
(A) Schematic of the experimental approach used to assess the impact of PF4708671 on mPDAC growth in ST and DIO mice. Vehicle or PF4708671 (50 mg/kg) were administered by i.p. injection once per day starting on Day 1 post-implantation of KPC-4662 and KPC-6560 cells expressing luciferase. (B) Representative immunostaining of pS6 and DAPI in KPC-4662 tumor sections from DIO mice treated with PF4708671 for 3 days. Graph shows pS6 mean immunofluorescence intensity +/− SEM and values for each tumor. The intensity value for each tumor is the average of non-overlapping FOV covering ~50% of each section imaged at 20x. Scale bar, 50 μm. * p<0.05 by Mann Whitney t-test. (C) Representative images and quantification of SG index in sections from tumors in B as detected by G3bp1. Data are mean SG index +/− SEM and individual values for each tumor. The SG index for each tumor section is the average of 30 non-overlapping FOV imaged at 40x. ** p<0.01 by Mann Whitney t-test. Scale bar, 10 μm. (D) Representative bioluminescent images of ST and DIO mice implanted with KPC-4662 cells and treated as in A. The scale indicates radiance expressed as p/sec/cm2/sr. (E) Quantification of tumor bioluminescent signal over time post orthotopic implantation of KPC-4662 cells in ST and DIO mice treated with vehicle or PF4708671 as in A. Data are mean signal +/− SEM of individual tumors in each group; ST (vehicle n=9, PF4708671 n=9), DIO (vehicle n=13, PF4708671 n=12). **p<0.01 by two-way ANOVA. (F) Representative immunostaining of CC3, Ki67, and DAPI, H&E in sections from orthotopic tumors in E. Scale bar, 50 μm. (G) Quantification of CC3 or Ki67 positive areas in tumors in E. Data was derived and quantified as in 4F-G. * p<0.05 by Mann Whitney t-test. (H) Distribution of SG index in PDAC patient samples (n=65) (I) Patient distribution according to Body Mass Index (BMI) (J) Representative immunostaining of G3BP1, CK8, and DAPI, and SG index in tumor sections of PDAC patients as in H, segregated by BMI. Data are mean SG index of CK8 positive (+) tumor areas +/− SEM, and individual values for each tumor. The SG index for each tumor is the average of 2 sections, 15 non-overlapping FOV for each section, imaged at 40x.**** p<0.0001 by Mann Whitney t-test. Scale bar, 10 μm.

Similar articles

Cited by

References

    1. Luo J, Solimini NL, Elledge SJ. Principles of cancer therapy: oncogene and non-oncogene addiction. Cell 2009;136(5):823–37 doi 10.1016/j.cell.2009.02.024. - DOI - PMC - PubMed
    1. Vanzo R, Bartkova J, Merchut-Maya JM, Hall A, Bouchal J, Dyrskjot L, et al. Autophagy role(s) in response to oncogenes and DNA replication stress. Cell Death Differ 2020;27(3):1134–53 doi 10.1038/s41418-019-0403-9. - DOI - PMC - PubMed
    1. Commisso C, Davidson SM, Soydaner-Azeloglu RG, Parker SJ, Kamphorst JJ, Hackett S, et al. Macropinocytosis of protein is an amino acid supply route in Ras-transformed cells. Nature 2013;497(7451):633–7 doi 10.1038/nature12138. - DOI - PMC - PubMed
    1. Ma Y, Hendershot LM. The role of the unfolded protein response in tumour development: friend or foe? Nat Rev Cancer 2004;4(12):966–77 doi 10.1038/nrc1505. - DOI - PubMed
    1. Kedersha NL, Gupta M, Li W, Miller I, Anderson P. RNA-binding proteins TIA-1 and TIAR link the phosphorylation of eIF-2 alpha to the assembly of mammalian stress granules. J Cell Biol 1999;147(7):1431–42 doi 10.1083/jcb.147.7.1431. - DOI - PMC - PubMed

Publication types

MeSH terms

Substances