. 2022 Jul 13;96(13):e0012222.
doi: 10.1128/jvi.00122-22. Epub 2022 Jun 8.

Deep Sequencing Analysis of Individual HIV-1 Proviruses Reveals Frequent Asymmetric Long Terminal Repeats

Affiliations

Deep Sequencing Analysis of Individual HIV-1 Proviruses Reveals Frequent Asymmetric Long Terminal Repeats

Kevin W Joseph et al. J Virol. .

Abstract

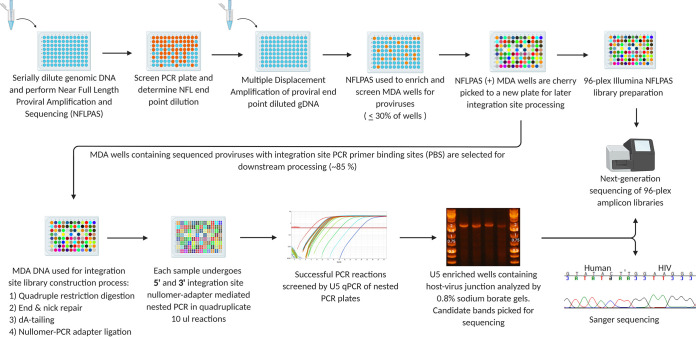
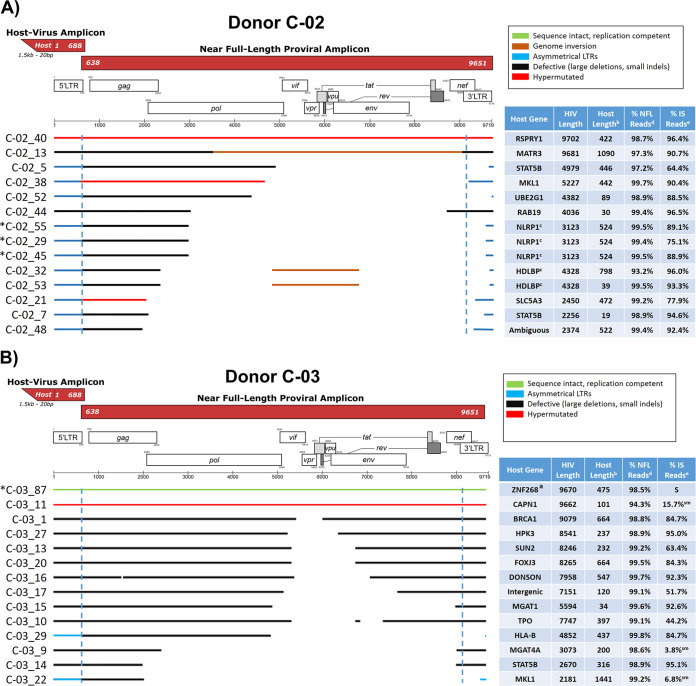
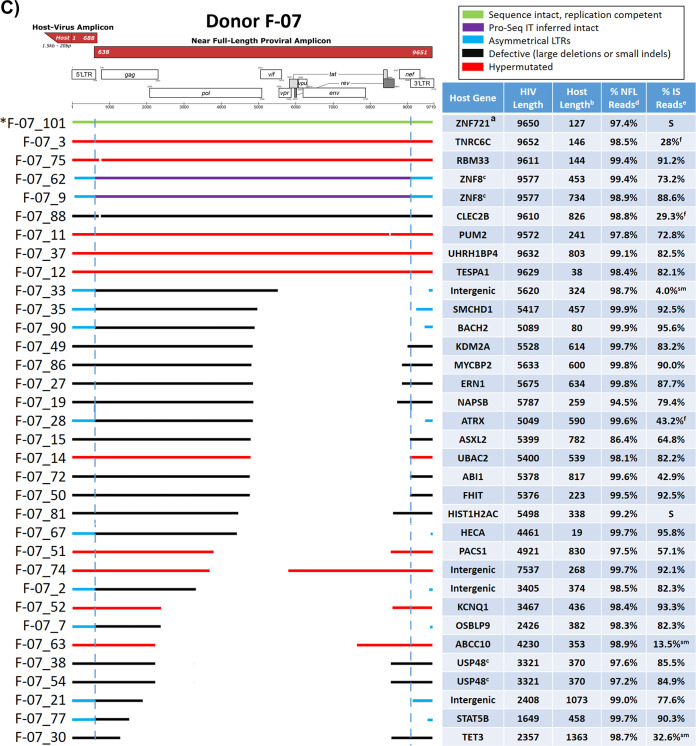
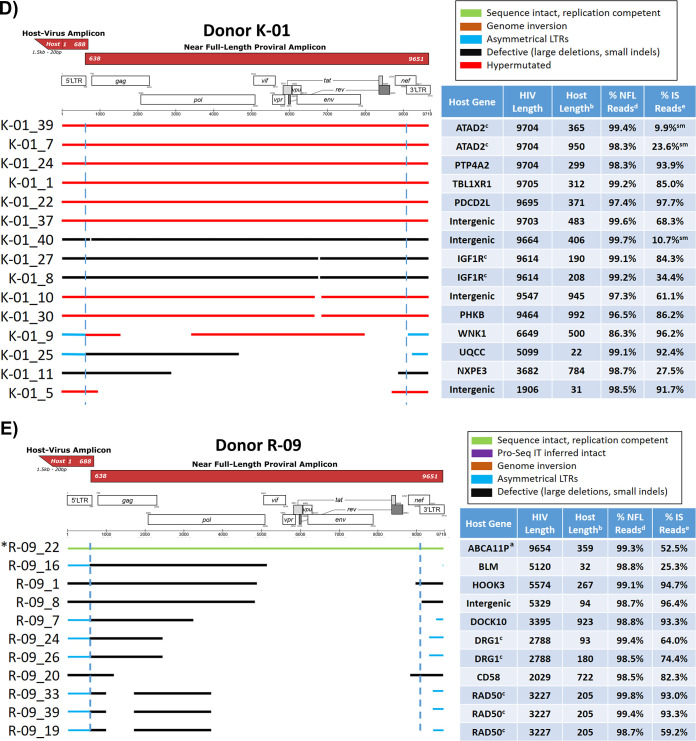
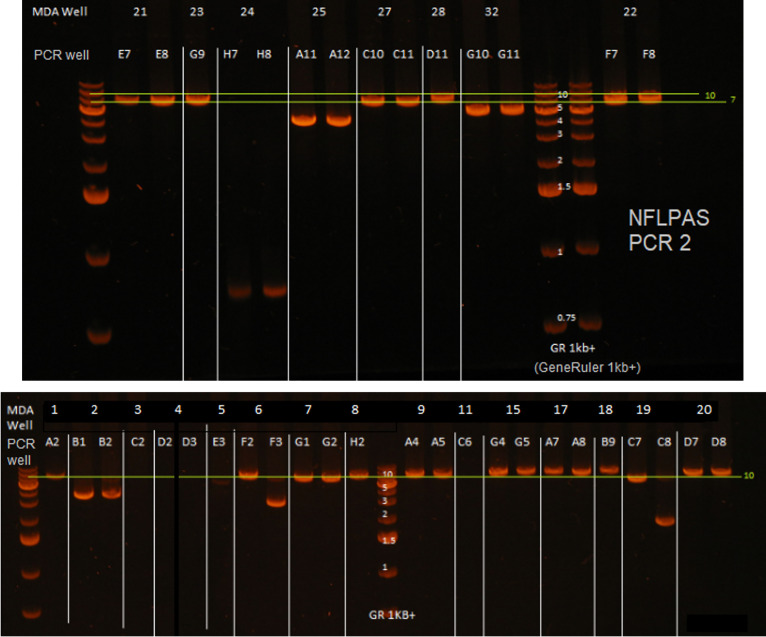
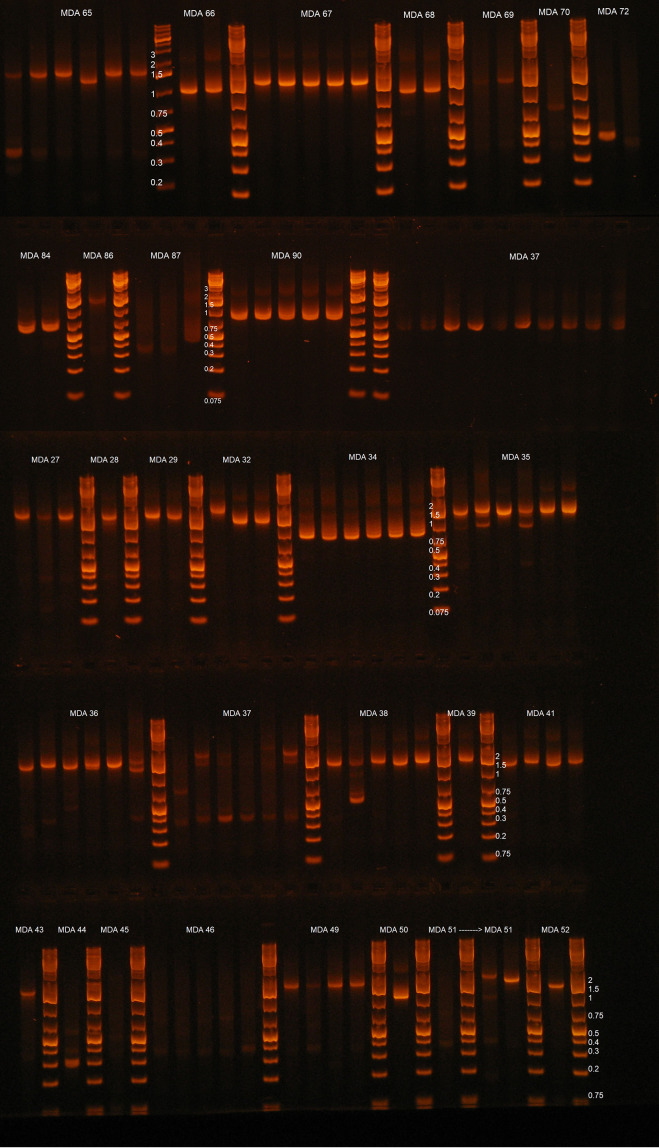
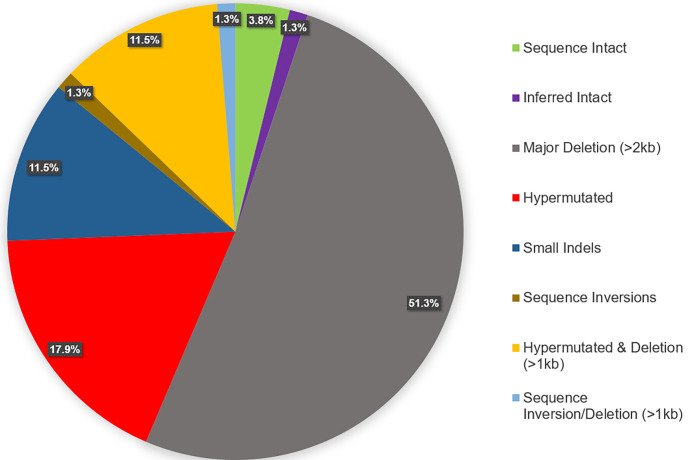
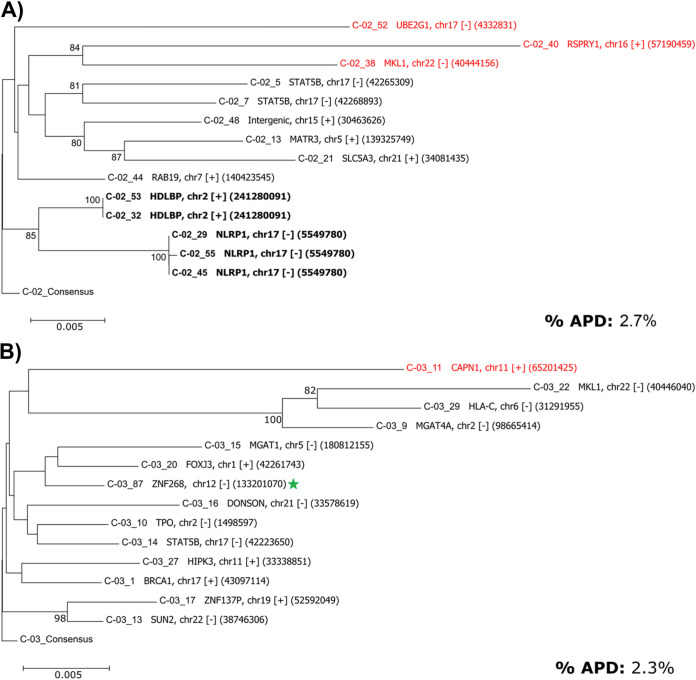
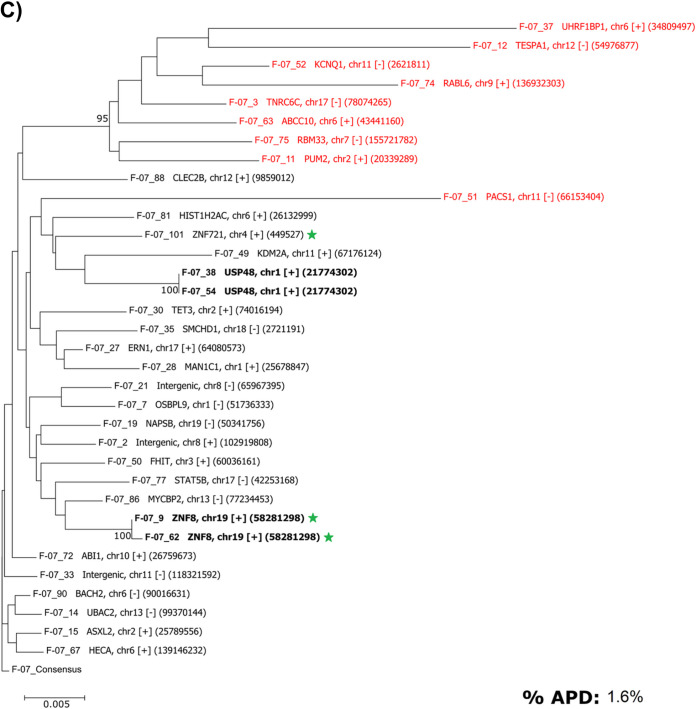
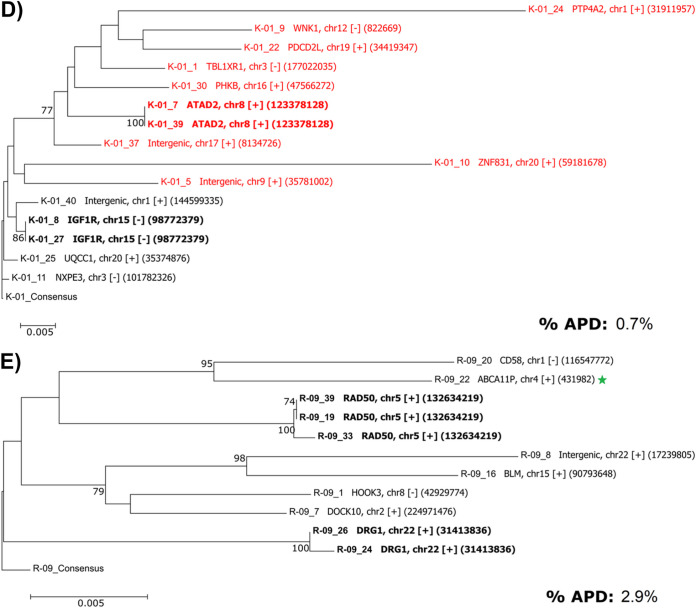
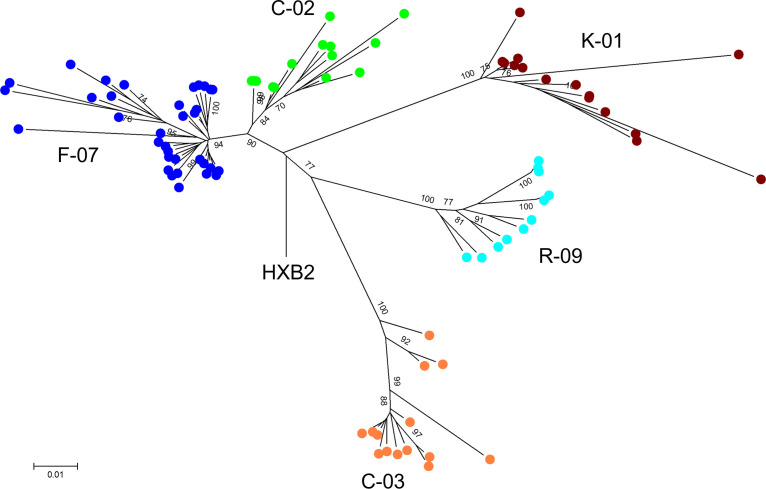
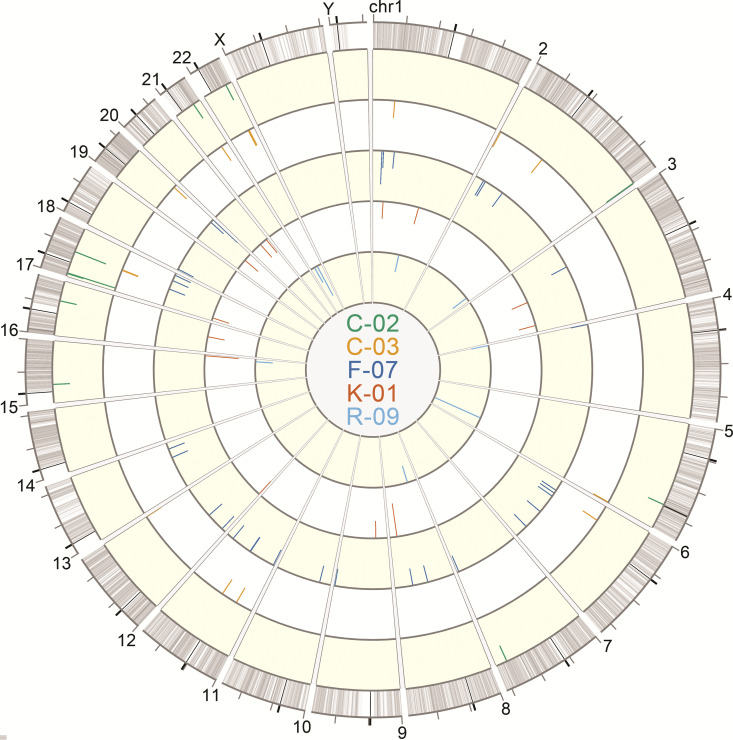
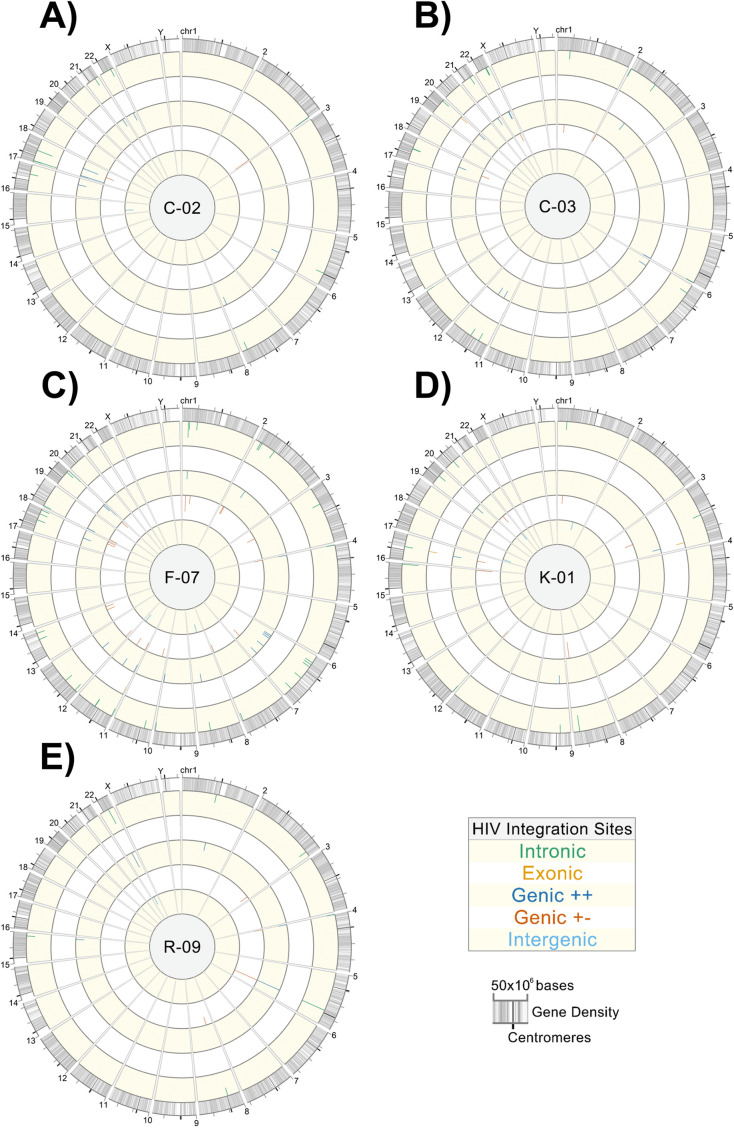
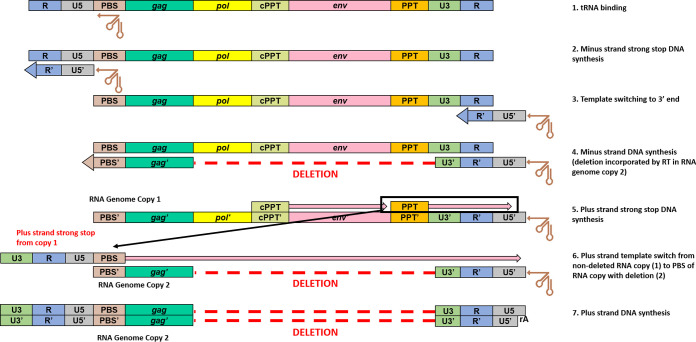
Effective strategies to eliminate human immunodeficiency virus type 1 (HIV-1) reservoirs are likely to require more thorough characterizations of proviruses that persist on antiretroviral therapy (ART). The rarity of infected CD4+ T-cells and related technical challenges have limited the characterization of integrated proviruses. Current approaches using next-generation sequencing can be inefficient and limited sequencing depth can make it difficult to link proviral sequences to their respective integration sites. Here, we report on an efficient method by which HIV-1 proviruses and their sites of integration are amplified and sequenced. Across five HIV-1-positive individuals on clinically effective ART, a median of 41.2% (n = 88 of 209) of amplifications yielded near-full-length proviruses and their 5'-host-virus junctions containing a median of 430 bp (range, 18 to 1,363 bp) of flanking host sequence. Unexpectedly, 29.5% (n = 26 of 88) of the sequenced proviruses had structural asymmetries between the 5' and 3' long terminal repeats (LTRs), commonly in the form of major 3' deletions. Sequence-intact proviruses were detected in 3 of 5 donors, and infected CD4+ T-cell clones were detected in 4 of 5 donors. The accuracy of the method was validated by amplifying and sequencing full-length proviruses and flanking host sequences directly from peripheral blood mononuclear cell DNA. The individual proviral sequencing assay (IPSA) described here can provide an accurate, in-depth, and longitudinal characterization of HIV-1 proviruses that persist on ART, which is important for targeting proviruses for elimination and assessing the impact of interventions designed to eradicate HIV-1. IMPORTANCE The integration of human immunodeficiency virus type 1 (HIV-1) into chromosomal DNA establishes the long-term persistence of HIV-1 as proviruses despite effective antiretroviral therapy (ART). Characterizing proviruses is difficult because of their rarity in individuals on long-term suppressive ART, their highly polymorphic sequences and genetic structures, and the need for efficient amplification and sequencing of the provirus and its integration site. Here, we describe a novel, integrated, two-step method (individual proviral sequencing assay [IPSA]) that amplifies the host-virus junction and the full-length provirus except for the last 69 bp of the 3' long terminal repeat (LTR). Using this method, we identified the integration sites of proviruses, including those that are sequence intact and replication competent or defective. Importantly, this new method identified previously unreported asymmetries between LTRs that have implications for how proviruses are detected and quantified. The IPSA method reported is unaffected by LTR asymmetries, permitting a more accurate and comprehensive characterization of the proviral landscape.

Keywords: HIV-1; LTR; integration sites; proviral structures; sequencing; single genome.


Conflict of interest statement

The authors declare a conflict of interest. J.W.M. reports research grant support for this project from the National Cancer Institute (NCI)/Leidos, National Institutes of Health (NIH), under Contract No. 75N91019D00024, Task Order No. 75N91020F00003; the AIDS Clinical Trials Group Network (ACTG) to the University of Pittsburgh Virology Specialty Laboratory funded by (NIH)/National Institute of Allergy and Infectious Diseases (NIAID) under award UM1 AI106701; and, receives grant support from the Bill & Melinda Gates Foundation award OPP1115715; NIH/NIAID to the I4C (contract numbers UM1 AI126603 and UM1 AI164556); and, REACH (contract number UM1 AI164565) Martin Delaney Collaboratories. M.F.K. and J.W.R. receive grant support from the Office of AIDS Research and from the Intramural Research Programs of the NCI, NIH. J.M.C. receives grant support from The American Cancer Society and NCI through Leidos Subcontract No. l3XS110. The content of this publication does not necessarily reflect the views or policies of the Department of Health and Human Services, nor does mention of trade names, commercial products, or organizations imply endorsement by the U.S. Government. The content is solely the responsibility of the authors and does not necessarily represent the official views of the NIH.

Figures

FIG 1
FIG 1
Workflow for amplifying and sequencing individual HIV-1 proviruses and integration sites. gDNA extracted from cells is serially diluted and used for nested near-full-length (NFL) proviral amplification and sequencing (NFLPAS) to determine the proviral endpoint dilution factor. gDNA is then diluted and used in MDA, followed by the screening of MDA reactions for HIV-1 proviruses using NFL proviral amplification and sequencing. Gel red nucleic acid stain is used to identify NFL-positive wells. NFL-positive MDA reactions are then sequenced using the Illumina MiSeq platform, and MDA reactions containing proviruses without integration site PCR primer-binding-site deletions are selected for integration site amplification. A portion of the remaining MDA DNA is restriction digested, end repaired, dA -tailed, nullomer linker ligated, and followed by quadruplicate integration site nested PCR. PCR reactions are screened for U5 enrichment by EvaGreen qPCR, analyzed by 0.8% sodium borate agarose gel electrophoresis, and sequenced with either the Sanger or Illumina MiSeq platforms.
FIG 2
FIG 2
Virogram alignments of HIV-1 proviruses and integration sites from five subtype B-positive individuals. Alignments of consensus assemblies were performed using MUSCLE. Virograms for individuals C-02 (A), C-03 (B), F-07 (C), K-01 (D), and R-09 (E) are depicted. Green lines indicate proviruses determined to be replication competent by a viral outgrowth assay. Purple lines denote proviruses inferred to be sequence intact by the Proviral Sequence Annotation & Intactness Tool (ProSeq-IT) (29). Brown lines indicate regions containing proviral genome inversions. Blue lines denote proviruses with asymmetrical LTRs. Black lines indicate defective proviruses due to large deletions or small indels. Red lines indicate hypermutated proviruses determined by the Los Alamos Hypermut v2 program (P value of <0.05). Blue dashed lines denote LTR borders. Tables accompanying virograms correspond to the gene locations of proviral integration sites and the lengths of flanking host sequences amplified for the proviruses shown in the virograms. a, replication-competent proviruses determined by a quantitative viral outgrowth assay (qVOA); b, length of the amplified flanking host sequence; c, proviruses in clones identified by identical proviral sequences and integration sites; d, percentage of total reads utilized during the assembly of the near-full-length (NFL) consensus sequence; e, percentage of total reads utilized during the assembly of the host-virus junction consensus sequence; f, amplicons in which 10 ng of a faint band by agarose gel electrophoresis was sequenced; S, integration sites sequenced by dideoxy sequencing only; sm, amplicons in which 10 ng of DNA produced a smear by agarose gel electrophoresis but was successfully sequenced; *, proviruses for which sequence identity was validated by amplification and sequencing of the full-length provirus and flanking host DNA directly from unamplified gDNA. HIV-1 gene map art was adopted from the Los Alamos National Laboratory gene map (40).
FIG 2
FIG 2
Virogram alignments of HIV-1 proviruses and integration sites from five subtype B-positive individuals. Alignments of consensus assemblies were performed using MUSCLE. Virograms for individuals C-02 (A), C-03 (B), F-07 (C), K-01 (D), and R-09 (E) are depicted. Green lines indicate proviruses determined to be replication competent by a viral outgrowth assay. Purple lines denote proviruses inferred to be sequence intact by the Proviral Sequence Annotation & Intactness Tool (ProSeq-IT) (29). Brown lines indicate regions containing proviral genome inversions. Blue lines denote proviruses with asymmetrical LTRs. Black lines indicate defective proviruses due to large deletions or small indels. Red lines indicate hypermutated proviruses determined by the Los Alamos Hypermut v2 program (P value of <0.05). Blue dashed lines denote LTR borders. Tables accompanying virograms correspond to the gene locations of proviral integration sites and the lengths of flanking host sequences amplified for the proviruses shown in the virograms. a, replication-competent proviruses determined by a quantitative viral outgrowth assay (qVOA); b, length of the amplified flanking host sequence; c, proviruses in clones identified by identical proviral sequences and integration sites; d, percentage of total reads utilized during the assembly of the near-full-length (NFL) consensus sequence; e, percentage of total reads utilized during the assembly of the host-virus junction consensus sequence; f, amplicons in which 10 ng of a faint band by agarose gel electrophoresis was sequenced; S, integration sites sequenced by dideoxy sequencing only; sm, amplicons in which 10 ng of DNA produced a smear by agarose gel electrophoresis but was successfully sequenced; *, proviruses for which sequence identity was validated by amplification and sequencing of the full-length provirus and flanking host DNA directly from unamplified gDNA. HIV-1 gene map art was adopted from the Los Alamos National Laboratory gene map (40).
FIG 3
FIG 3
Examples of single-genome, near-full-length nested PCR amplicons. Near-full-length amplification and sequencing (NFLPAS) nested PCR was performed on MDA reactions containing single-genome HIV-1 proviruses and analyzed by 0.7% sodium borate agarose gel electrophoresis at 250 V for 30 mins using a GeneRuler 1-kb plus ladder. Shown are the results of duplicate PCR reactions from each HIV-1-positive MDA reaction. White lines separate the MDA reactions, and those MDA reactions containing only one analyzed lane are due to the duplicate reaction containing no amplified DNA by gel red dye analysis. Yellow lines denote approximate gel regions for possible intact proviruses (9 kb).
FIG 4
FIG 4
Examples of integration site (IS) nested PCR amplicons across HIV-1 host-virus junctions from various MDA reactions containing HIV-1 proviruses. IS PCR was performed on MDA reaction containing HIV-1 for which NFLPAS PCR generated a proviral amplicon. PCR wells that were positive by gel red dye screening were analyzed by 0.8% sodium borate agarose gel electrophoresis at 250 V for 15 mins with a GeneRuler 1-kb plus ladder. Each ladder separates different MDA reactions, as indicated by each lane label. In instances where PCR did not produce consistently sized amplicons or produced multiband PCR products, either incomplete restriction digestion occurred or there was more than one provirus in the MDA reaction (proviral mixture).
FIG 5
FIG 5
Summary of HIV-1 proviral structures sequenced from five subtype B-positive individuals. All proviruses were evaluated manually initially for the determination of sequence length and defectiveness, and sequences of full-length proviruses were evaluated for intactness by the ProSeq-IT tool (29). Of the 88 proviruses sequenced (and after removing duplicate clonal sequences from the analysis), 3.8% (n = 3) were sequence intact and confirmed to be replication competent by a qVOA by Halvas et al. (15), 1.3% (n = 1) were inferred intact by ProSeq-IT (29), 51.3% (n = 40) contained major genomic deletions of >2 kb in length, 17.9% (n = 14) were hypermutated according to the Los Alamos Hypermut v2 program (P value of <0.05), 11.5% (n = 9) both were hypermutated and contained genomic deletions of >1 kb in length, 1.3% (n = 1) contained sequence inversions and contained genomic deletions of >1 kb in length, 11.5% (n = 9) were defective due to small indels, and 1.3% (n = 1) contained genomic inversions.
FIG 6
FIG 6
Donor-specific phylogenetic trees of genetically diverse proviruses. The first 2 kb of sequence from each provirus were aligned for comparative purposes, with gaps retained, and a neighbor-joining test of phylogeny was performed using the bootstrap method (n = 1,000 replicates) (MEGA v6) (39). Trees are rooted to each donor-specific consensus generated from alignments. Shown are the results of phylogenetic analyses of proviral sequences from donors C-02 (A), C-03 (B), F-07 (C), K-01 (D), and R-09 (E). Bold labels denote proviruses in clones. Red labels denote ABOBEC-hypermutated proviruses as determined by Los Alamos Hypermut v2 (P values of <0.05). Green stars indicate sequence-intact or inferred intact proviruses. Displayed to the right of the sequence name in each tree are the gene, chromosome (proviral orientation relative to the gene, + [with] or − [against]), and the specific location of the integration site. APD, average pairwise distance of the proviruses from each donor as determined by MEGA v6, after removing hypermutated proviruses and duplicate clonal proviral sequences.
FIG 6
FIG 6
Donor-specific phylogenetic trees of genetically diverse proviruses. The first 2 kb of sequence from each provirus were aligned for comparative purposes, with gaps retained, and a neighbor-joining test of phylogeny was performed using the bootstrap method (n = 1,000 replicates) (MEGA v6) (39). Trees are rooted to each donor-specific consensus generated from alignments. Shown are the results of phylogenetic analyses of proviral sequences from donors C-02 (A), C-03 (B), F-07 (C), K-01 (D), and R-09 (E). Bold labels denote proviruses in clones. Red labels denote ABOBEC-hypermutated proviruses as determined by Los Alamos Hypermut v2 (P values of <0.05). Green stars indicate sequence-intact or inferred intact proviruses. Displayed to the right of the sequence name in each tree are the gene, chromosome (proviral orientation relative to the gene, + [with] or − [against]), and the specific location of the integration site. APD, average pairwise distance of the proviruses from each donor as determined by MEGA v6, after removing hypermutated proviruses and duplicate clonal proviral sequences.
FIG 7
FIG 7
Phylogenetic tree constructed using the sequenced proviruses from all individuals showing donor-specific clustering. A neighbor-joining tree was constructed using the first 2 kb of all of the sequenced proviruses and rooted to the HXB2 consensus using MEGA v6 (39). Solid green circles represent donor C-02 sequences. Solid orange circles represent donor C-03 sequences. Solid dark blue circles represent donor F-07 sequences. Solid maroon circles represent donor K-01 sequences. Solid light blue circles represent donor R-09 sequences.
FIG 8
FIG 8
Asymmetrical 5′ and 3′ LTRs from sequenced proviruses. (A) Proviral 5′- and 3′-LTR sequences from donor C-02. (B) Proviral 5′- and 3′-LTR sequences from donor C-03. (C) Proviral 5′- and 3′-LTR sequences from donor F-07. (D) Proviral 5′- and 3′-LTR sequences from donor K-01. (E) Proviral 5′- and 3′-LTR sequences from donor R-09. The 5′- and 3′-LTR sequences were extracted from the assembled proviral consensus FASTA files and aligned using MUSCLE (28). Proviruses were defined as having asymmetrical LTRs when a large deletion was present in one LTR but not the other and the two LTRs had sequence identity within 3 mismatches. Open blue boxes indicate regions absent in the amplicon and not sequenced. Vertical blue dashed lines demarcate LTR regions R and U5. Numbers to the right of each aligned provirus indicate the length of the LTR sequence. TAR, trans-activation response element.
FIG 9
FIG 9
Circos plot of HIV-1 integration sites of sequenced proviruses. Sequencing reads containing the 5′-host-virus junction were used to extract integration sites from sequencing FASTQ files for alignment against the hg38 consensus genome using the UCSC BLAT tool (37). The Circos plot was generated using Vgas software (38). Each ring depicts integration sites of sequenced proviruses from each donor: C-02 (green), C-03 (orange), F-07 (dark blue), K-01 (red), and R-09 (light blue). The lengths of the tick marks are proportional to the number of times that an identical integration site of a specific provirus was independently amplified and sequenced.
FIG 10
FIG 10
Donor-specific integration site Circos plots. Sequencing reads containing the 5′-host-virus junction were used to extract integration sites from sequencing FASTQ files for alignment against the hg38 consensus genome using the UCSC BLAT tool (37). Circos plots were generated using Vgas software (38). (A) Donor C-02; (B) donor C-03; (C) donor F-07; (D) donor K-01; (E) donor R-09. Each plot depicts all amplified and sequenced proviruses and linked integration sites within a specific donor, represented by tick marks along the rings. Rings from outermost to innermost show proviruses integrated into introns, exons, genic locations in the same orientation as that of the gene, genic locations in the opposite orientation as that of the gene, and intergenic regions, respectively. The lengths of the tick marks are proportional to the number of times that an identical integration site for a given provirus was independently sequenced.
FIG 11
FIG 11
Proposed mechanism for the generation of proviruses with asymmetrical LTRs (an intact 5′ LTR with a deletion in the 3′ LTR). (1) At the initiation of reverse transcription, the tRNA is annealed to the primer-binding site (PBS). (2) RT initiates minus-strand DNA synthesis from the tRNA 3′-OH and copies the U5 and R portions at the 5′ end of the genome. (3 and 4) Template switching of the minus-strand strong-stop DNA occurs by annealing of the newly synthesized 5′-R to the 3′-R sequence (3), which then allows minus-strand DNA synthesis to proceed (4). (5) HIV-1 polypurine tract (PPT) tracts are resistant to RT RNase H degradation and thus allow priming and initiation of plus-strand DNA synthesis, using the new minus-strand DNA copy as a template. (6) After RT copies the 3′-U3, -R, -U5, and -PBS regions, template switching can occur where the newly copied 3′-PBS sequence of the intact copy of plus-strand strong-stop DNA (shown here from RNA genome copy 1) anneals to the 5′-PBS sequence of the RNA genome copy containing an internal deletion. (7) Plus-strand DNA synthesis proceeds and copies the minus strand containing the internal genomic deletion.

References

    1. WHO. 2020. HIV data and statistics. WHO, Geneva, Switzerland.
    1. Hu W-S, Hughes SH. 2012. HIV-1 reverse transcription. Cold Spring Harb Perspect Med 2:a006882. 10.1101/cshperspect.a006882. - DOI - PMC - PubMed
    1. O’Neil PK, Sun G, Yu H, Ron Y, Dougherty JP, Preston BD. 2002. Mutational analysis of HIV-1 long terminal repeats to explore the relative contribution of reverse transcriptase and RNA polymerase II to viral mutagenesis. J Biol Chem 277:38053–38061. 10.1074/jbc.M204774200. - DOI - PubMed
    1. Coffin J, Swanstrom R. 2013. HIV pathogenesis: dynamics and genetics of viral populations and infected cells. Cold Spring Harb Perspect Med 3:a012526. 10.1101/cshperspect.a012526. - DOI - PMC - PubMed
    1. Achuthan V, Keith BJ, Connolly BA, DeStefano JJ. 2014. Human immunodeficiency virus reverse transcriptase displays dramatically higher fidelity under physiological magnesium conditions in vitro. J Virol 88:8514–8527. 10.1128/JVI.00752-14. - DOI - PMC - PubMed

Publication types