. 2022 Jun 29;10(3):e0073522.
doi: 10.1128/spectrum.00735-22. Epub 2022 Jun 8.

Host Age Prediction from Fecal Microbiota Composition in Male C57BL/6J Mice

Affiliations

Host Age Prediction from Fecal Microbiota Composition in Male C57BL/6J Mice

Adrian Low et al. Microbiol Spectr. .

Abstract

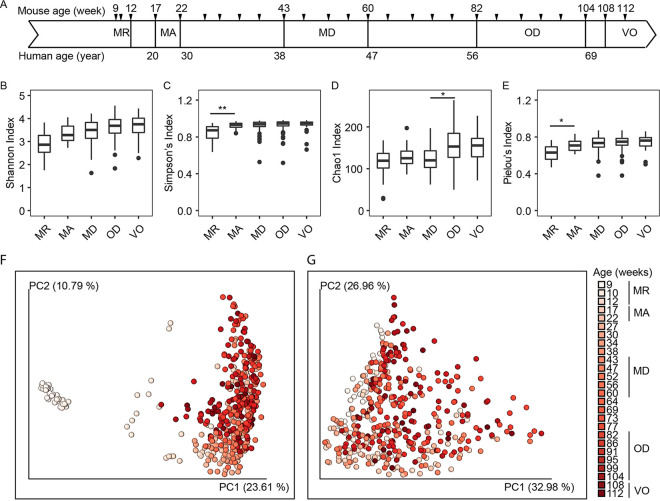
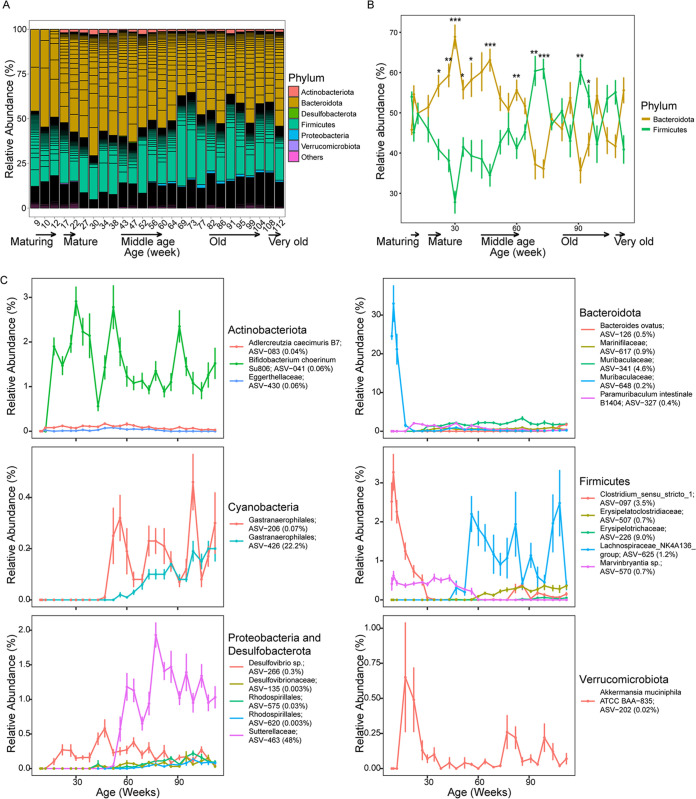
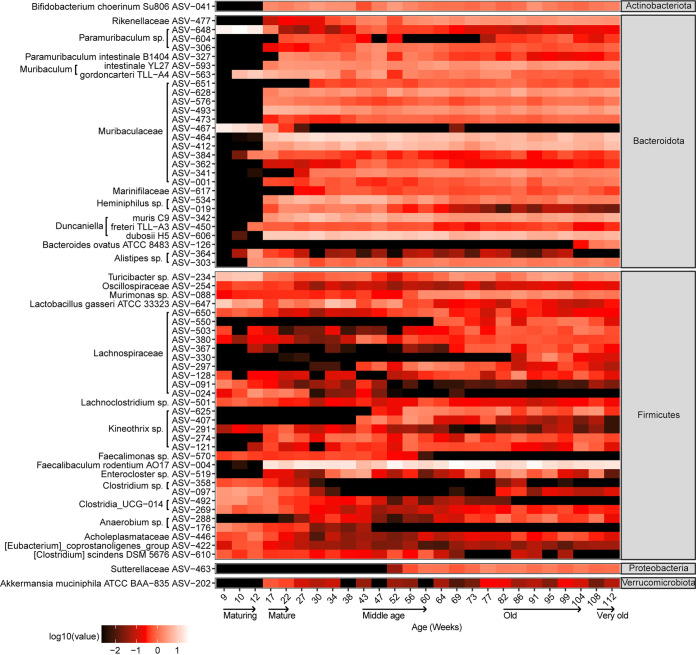
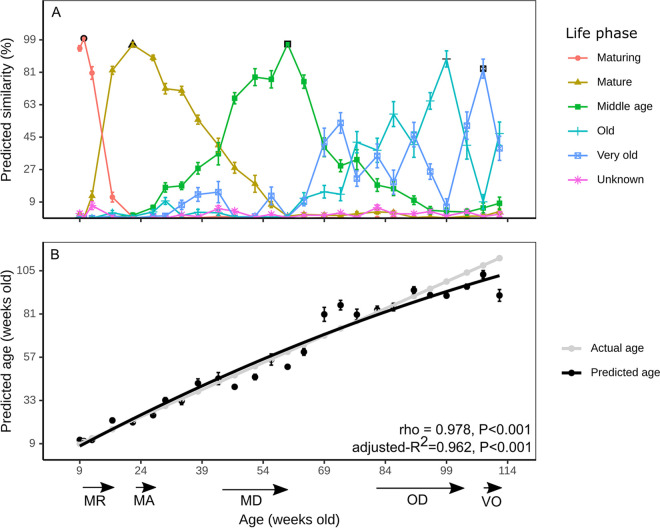
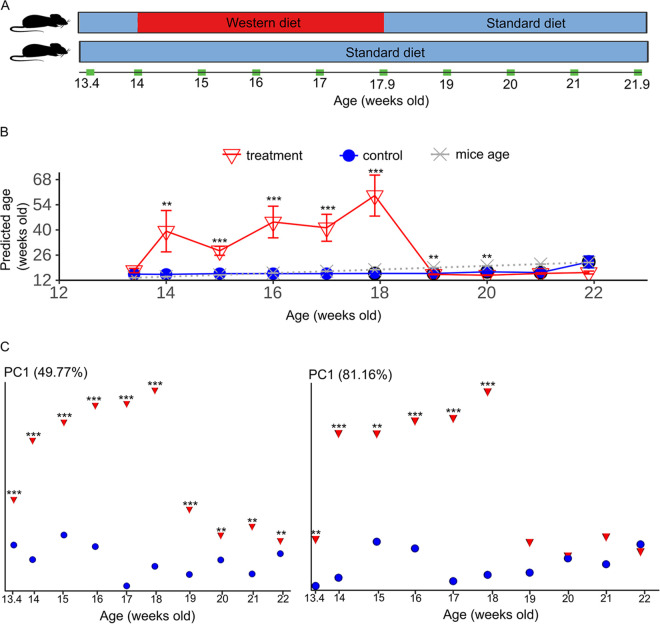
The lifelong relationship between microorganisms and hosts has a profound impact on the overall health and physiology of the holobiont. Microbiome composition throughout the life span of a host remains largely understudied. Here, the fecal microbiota of conventionally raised C57BL/6J male mice was characterized throughout almost the entire adult life span, from "maturing" (9 weeks) until "very old" (112 weeks) age. Our results suggest that microbiota changes occur throughout life but are more pronounced in maturing to middle-age mice than in mice later in life. Phylum-level analysis indicates a shift of the Bacteroidota-to-Firmicutes ratio in favor of Firmicutes in old and very old mice. More Firmicutes amplicon sequence variants (ASVs) were transient with varying successional patterns than Bacteroidota ASVs, which varied primarily during maturation. Microbiota configurations from five defined life phases were used as training sets in a Bayesian model, which effectively enabled the prediction of host age. These results suggest that age-associated compositional differences may have considerable implications for the interpretation and comparability of animal model-based microbiome studies. The sensitivity of the age prediction to dietary perturbations was tested by applying this approach to two age-matched groups of C57BL/6J mice that were fed either a standard or western diet. The predicted age for the western diet-fed animals was on average 27 ± 11 (mean ± standard deviation) weeks older than that of standard diet-fed animals. This indicates that the fecal microbiota-based predicted age may be influenced not only by the host age and physiology but also potentially by other factors such as diet. IMPORTANCE The gut microbiome of a host changes with age. Cross-sectional studies demonstrate that microbiota of different age groups are distinct but do not demonstrate the temporal change that a longitudinal study is able to show. Here, we performed a longitudinal study of adult mice for over 2 years. We identified life stages where compositional changes were more dynamic and showed temporal changes for the more abundant species. Using a Bayesian model, we could reliably predict the life stages of the mice. Application of the same training set to mice fed different dietary regimens revealed that life-stage age predictions were possible for mice fed the same diet but less so for mice fed different diets. This study sheds light on the temporal changes that occur within the gut microbiota of laboratory mice over their life span and may inform researchers on the appropriate mouse age for their research.

Keywords: aging; gut microbiota; mouse microbiota.


Conflict of interest statement

The authors declare no conflict of interest.

Figures

FIG 1
FIG 1
Longitudinal analyses of diversity and compositional changes to murine fecal microbiota over 103 weeks. (A) Outline of the longitudinal study of C57BL/6J male mice (n = 20) sampled at 4-week intervals from 9 to 112 weeks of age. Tick marks indicate sample time points (n = 26). (B to E) Alpha-diversity measures of fecal microbiota by murine life phases. Asterisks represent significant differences between adjacent life phases determined using the Wilcoxon signed-rank test: *, FDR-corrected P values of <0.05; **, FDR-corrected P values of <0.01. (F and G) Principal-coordinate analysis plots of Bray-Curtis dissimilarity (F) and weighted-UniFrac distances (G). The variance for each principal coordinate (PC) axis is shown in parentheses. MR, maturing; MA, mature; MD, middle age; OD, old; VO, very old.
FIG 2
FIG 2
Compositional changes to the fecal microbiota of C57BL/6J male mice from 9 to 112 weeks of age. (A) Phylum groupings of ASVs with ≥0.5% relative abundance. Cyanobacteria and Patescibacteria have ASVs with <0.5% relative abundance and are grouped as “others.” Each ASV is denoted by a horizontal black line. (B) Changes in mean relative abundance (%) by the two major phyla. Asterisks represent significant differences between the two phyla for each time point determined using the Wilcoxon test: *, FDR-corrected P values of <0.05; **, FDR-corrected P values of <0.01; ***, FDR-corrected P values of <0.001. (C) Mean relative abundances of ASVs with top five importance scores (shown in parentheses) for each phylum based on a random forest regression model. Actinobacteria, Cyanobacteria, Proteobacteria, Desulfobacterota, and Verrucomicrobiota are represented by fewer than 5 predictive ASVs. Data points and error bars are the mean ± standard error of the mean, respectively. Relative abundances are based on an ASV table rarefied to 2,733 reads per sample (Table S3). Taxonomic assignments of >99% nucleotide identity for species level and 95% to 99% identity for genus level are based on top BLASTn hits, and those of <95% nucleotide identity for family level are based on the SILVA SSU database 138 release.
FIG 3
FIG 3
Heatmap of 63 ASVs across 26 time points from mice 9 to 112 weeks old. Each ASV has a mean relative abundance of ≥0.5% for one or more life phases. The total number of samples is 433 (see Table S5 for metadata). Taxonomic assignments with >99% nucleotide identity for species and 95% to 99% identity for genus level are based on top BLASTn hits, and those for <95% nucleotide identity for family level follow the annotation by the SILVA SSU database 138 release.
FIG 4
FIG 4
Host age estimation based on fecal microbiota composition. (A) SourceTracker v0.9.1-based prediction of probabilities for each time point for the five life phases. Symbols with a black outline show the time points used as the “source” for each life phase. (B) Correlation of predicted age to actual mouse age. The Spearman correlation coefficient (rho), adjusted R2 value of the polynomial regression, and respective P values are shown. Error bars are standard errors of the means and may be smaller than the symbol. MR, maturing; MA, mature; MD, middle age; OD, old; VO, very old.
FIG 5
FIG 5
Age prediction and beta-diversity analyses of microbiota of a dietary study. (A) Schematic of the dietary experiment in which treatment mice 10 weeks of age (n = 12) were maintained on a standard diet until the start of a western diet at 14 weeks of age. Control group mice (n = 12) were fed only the standard diet. Treatment mice were fed standard chow at 18 weeks of age. Sampling time points are indicated in green. (B) Age prediction of mice. Black outlines indicate samples that were used as a “source” in addition to the training set used in the longitudinal study for SourceTracker v0.9.1. **, FDR-corrected P values of <0.01; ***, FDR-corrected P values of <0.001 based on the Wilcoxon ranked sum test. Error bars are standard errors of means. (C) Custom principal-coordinate analysis plots of Bray-Curtis (left) and weighted-UniFrac (right) distance matrices.

Similar articles

Cited by

References

    1. Kundu P, Blacher E, Elinav E, Pettersson S. 2017. Our gut microbiome: the evolving inner self. Cell 171:1481–1493. doi: 10.1016/j.cell.2017.11.024. - DOI - PubMed
    1. Langille MG, Meehan CJ, Koenig JE, Dhanani AS, Rose RA, Howlett SE, Beiko RG. 2014. Microbial shifts in the aging mouse gut. Microbiome 2:50. doi: 10.1186/s40168-014-0050-9. - DOI - PMC - PubMed
    1. Mariat D, Firmesse O, Levenez F, Guimarăes V, Sokol H, Doré J, Corthier G, Furet J-P. 2009. The Firmicutes/Bacteroidetes ratio of the human microbiota changes with age. BMC Microbiol 9:123. doi: 10.1186/1471-2180-9-123. - DOI - PMC - PubMed
    1. Rausch P, Basic M, Batra A, Bischoff SC, Blaut M, Clavel T, Glasner J, Gopalakrishnan S, Grassl GA, Gunther C, Haller D, Hirose M, Ibrahim S, Loh G, Mattner J, Nagel S, Pabst O, Schmidt F, Siegmund B, Strowig T, Volynets V, Wirtz S, Zeissig S, Zeissig Y, Bleich A, Baines JF. 2016. Analysis of factors contributing to variation in the C57BL/6J fecal microbiota across German animal facilities. Int J Med Microbiol 306:343–355. doi: 10.1016/j.ijmm.2016.03.004. - DOI - PubMed
    1. Myles IA, Fontecilla NM, Janelsins BM, Vithayathil PJ, Segre JA, Datta SK. 2013. Parental dietary fat intake alters offspring microbiome and immunity. J Immunol 191:3200–3209. doi: 10.4049/jimmunol.1301057. - DOI - PMC - PubMed

Publication types

LinkOut - more resources