. 2022 Oct 15;43(15):4567-4579.
doi: 10.1002/hbm.25973. Epub 2022 Jun 8.

Attenuated brain white matter functional network interactions in Parkinson's disease

Affiliations

Attenuated brain white matter functional network interactions in Parkinson's disease

Li Meng et al. Hum Brain Mapp. .

Abstract

Parkinson's disease (PD) is a neurodegenerative disorder characterized by extensive structural abnormalities in cortical and subcortical brain areas. However, an association between changes in the functional networks in brain white matter (BWM) and Parkinson's symptoms remains unclear. With confirming evidence that resting-state functional magnetic resonance imaging (rs-fMRI) of BWM signals can effectively describe neuronal activity, this study investigated the interactions among BWM functional networks in PD relative to healthy controls (HC). Sixty-eight patients with PD and sixty-three HC underwent rs-fMRI. Twelve BWM functional networks were identified by K-means clustering algorithm, which were further classified as deep, middle, and superficial layers. Network-level interactions were examined via coefficient Granger causality analysis. Compared with the HC, the patients with PD displayed significantly weaker functional interaction strength within the BWM networks, particularly excitatory influences from the superficial to deep networks. The patients also showed significantly weaker inhibitory influences from the deep to superficial networks. Additionally, the sum of the absolutely positive/negative regression coefficients of the tri-layered networks in the patients was lower relative to HC (p < .05, corrected for false discovery rate). Moreover, we found the functional interactions involving the deep BWM networks negatively correlated with part III of the Unified Parkinson's Disease Rating Scales and Hamilton Depression Scales. Taken together, we demonstrated attenuated BWM interactions in PD and these abnormalities were associated with clinical motor and nonmotor symptoms. These findings may aid understanding of the neuropathology of PD and its progression throughout the nervous system from the perspective of BWM function.

Keywords: Granger causality analysis; Parkinson's disease; interactions; motor and nonmotor symptoms; white matter functional networks.


Conflict of interest statement

The authors declare no competing financial interests.

Figures

FIGURE 1
FIGURE 1
Brain white matter functional networks. A total of 12 clusters were identified by K‐means clustering algorithm, which can be organized in superficial (WM1‐to‐WM8), middle (WM9, WM10), and deep (WM11, WM12) layers. WM1, orbitofrontal network; WM2, frontal network; WM3, pre/post‐central network; WM4, inferior temporal network; WM5, superior temporal networks; WM6, inferior corticospinal network; WM7, cerebellum network; WM8, occipital network; WM9, anterior/posterior corona radiate network; WM10, superior corona radiate network; WM11, deep frontal network; WM12, deep network
FIGURE 2
FIGURE 2
Within‐group white matter functional networks causal influence patterns across PD (n = 68) and HC (n = 63) determined by the one‐sample t‐test (p < .05, FDR corrected). Details of the one‐sample t‐test matrix are shown on the left, where positive/negative t‐values denote excitatory or inhibitory influence, respectively. In the Circos figure on the right, red lines represent significant excitatory influence while blue ones represent significant inhibitory influence. The color value of each line becomes darker with the strength of the connection. (a) Within‐group white matter functional network interactions in HC. (b) Within‐group white matter functional network interactions in PD
FIGURE 3
FIGURE 3
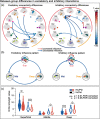
Between‐group differences in white matter functional networks causal influence determined by two‐sample t‐test (p < .05, FDR corrected). In the figure, two stars denote p < .01 and one star denotes p < .05. Warm lines denote significantly greater influence; cold lines denote significantly less influence, relative to the HC. The color value of each line becomes darker with the strength of the connection differences. (a) Details of the two‐sample t‐test are shown in the directed connection differences Circos. (b) Interaction pattern diagram: Compared with HC subjects, in excitatory interaction difference patterns, PD showed significantly lower influence from the superficial → deep network, from the superficial → middle network and from the middle → deep network; in inhibitory interaction differences pattern, PD showed significantly lower influence from the deep → superficial network, from the middle → superficial network, from the superficial → superficial network and showed significant greater influence from the superficial → superficial network. (c) The out strength of the superficial network (T = −2.38, p = .019) and deep network (T = −2.43, p = .016) was significantly lower in the PD compared with the HC. Additionally, the in strength of the superficial network (T = −2.54, p = .012) and deep network (T = −3.41, p = .0009) was significantly lower in the PD.
FIGURE 4
FIGURE 4
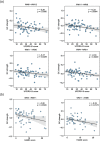
The decreases in white matter functional network interactions of PD correlated with the motor/nonmotor symptoms. Significant correlations were identified between GC strengths and (a) UPDRS‐III scores and (b) HAMD scores. p was the adjusted p‐statistic to account for outlier removal by bootstrapping the Mahalanobis distance.WM4, inferior temporal network; WM5, superior temporal network; WM6, inferior corticospinal network; WM11, deep frontal network; WM12, deep network; UPDRS‐III, the part III of the Unified Parkinson's Disease Rating Scale; HAMD, Hamilton Depression Scale. (a) Correlations between white matter functional network interactions and motor symptoms of PD. (b) Correlations between white matter functional network interactions and nonmotor symptoms of PD

References

    1. Bohnen, N. I. , & Albin, R. L. (2011). White matter lesions in Parkinson disease. Nature Reviews Neurology, 7(4), 229–236. - PMC - PubMed
    1. Braak, H. , Del Tredici, K. , Rüb, U. , De Vos, R. A. , Steur, E. N. J. , & Braak, E. (2003). Staging of brain pathology related to sporadic Parkinson's disease. Neurobiology of Aging, 24(2), 197–211. - PubMed
    1. Burciu, R. G. , & Vaillancourt, D. E. (2018). Imaging of motor cortex physiology in Parkinson's disease. Movement Disorders, 33(11), 1688–1699. 10.1002/mds.102 - DOI - PMC - PubMed
    1. Burke, R. E. , & O'Malley, K. (2013). Axon degeneration in Parkinson's disease. Experimental Neurology, 246, 72–83. 10.1016/j.expneurol.2012.01.011 - DOI - PMC - PubMed
    1. Chen, G. , Hamilton, J. P. , Thomason, M. E. , Gotlib, I. H. , Saad, Z. S. , & Cox, R. W. (2009). Granger causality via vector auto‐regression tuned for fMRI data analysis. Proceedings of the International Society for Magnetic Resonance in Medicine, 17, 1718.

Publication types