. 2023 Apr;43(3):1163-1180.
doi: 10.1007/s10571-022-01236-1. Epub 2022 Jun 8.

Methylmalonic Acid Impairs Cell Respiration and Glutamate Uptake in C6 Rat Glioma Cells: Implications for Methylmalonic Acidemia

Affiliations

Methylmalonic Acid Impairs Cell Respiration and Glutamate Uptake in C6 Rat Glioma Cells: Implications for Methylmalonic Acidemia

Renata T Costa et al. Cell Mol Neurobiol. 2023 Apr.

Abstract

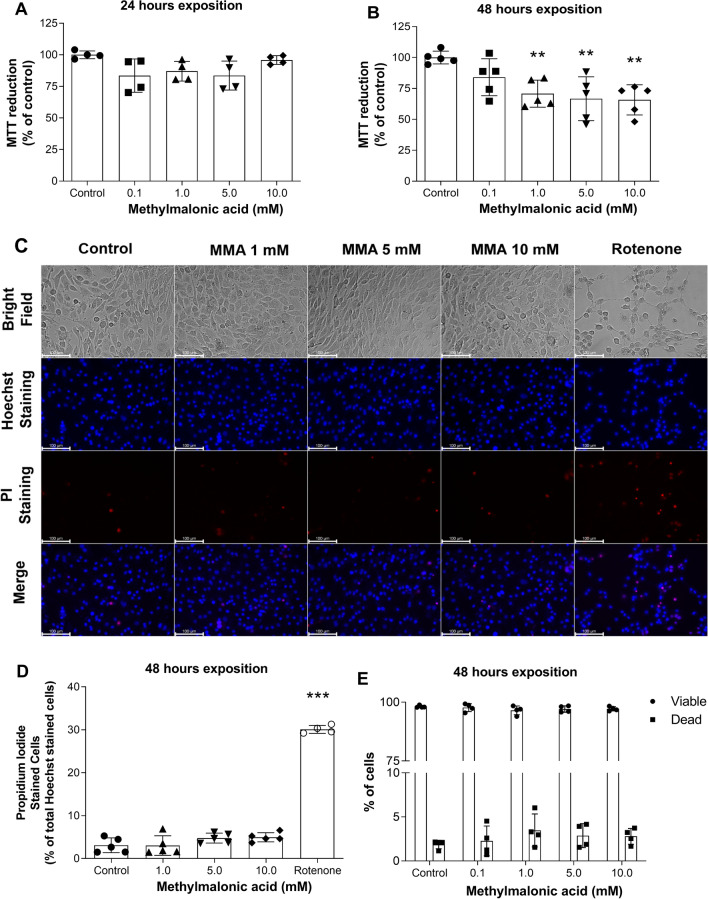
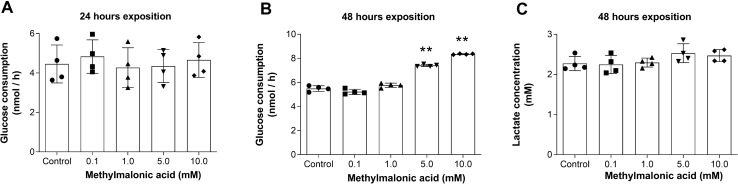
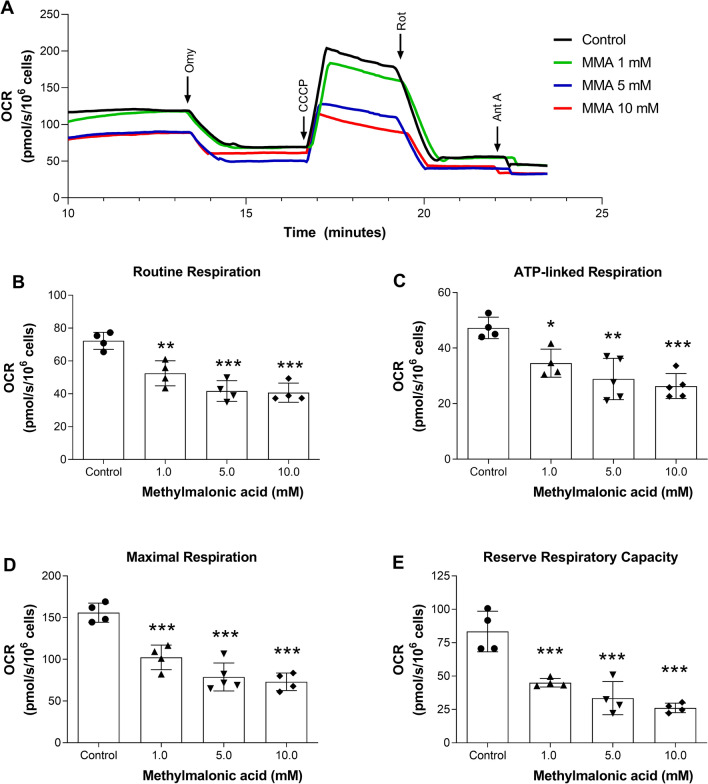
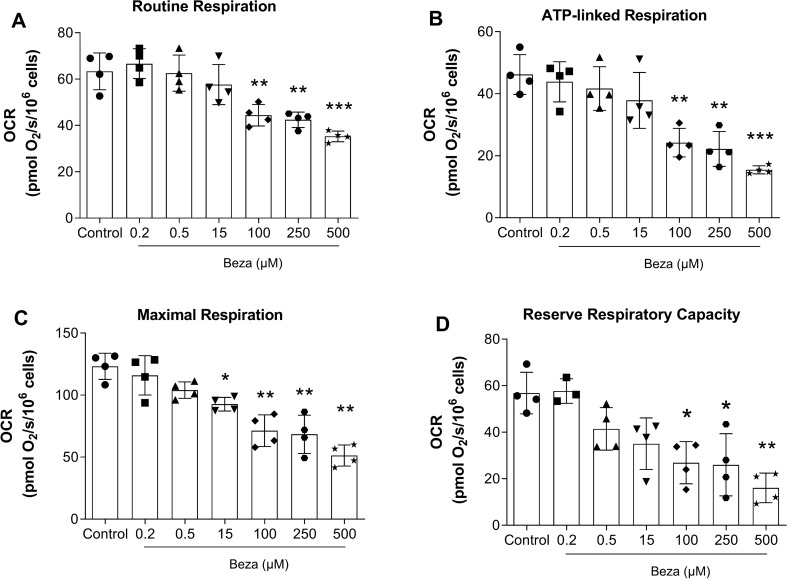
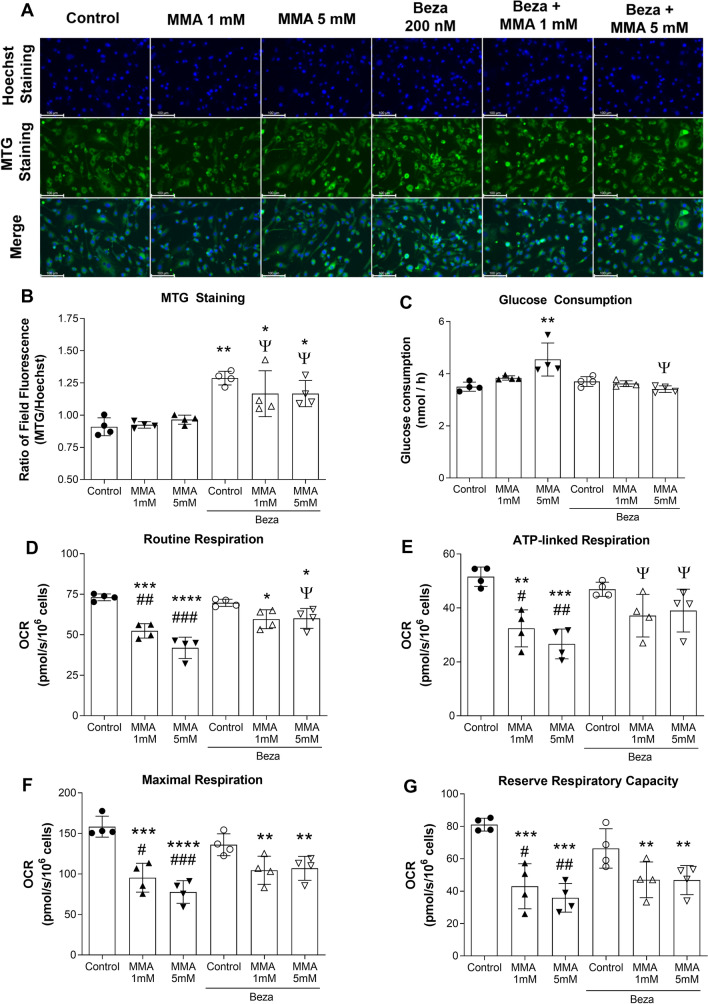
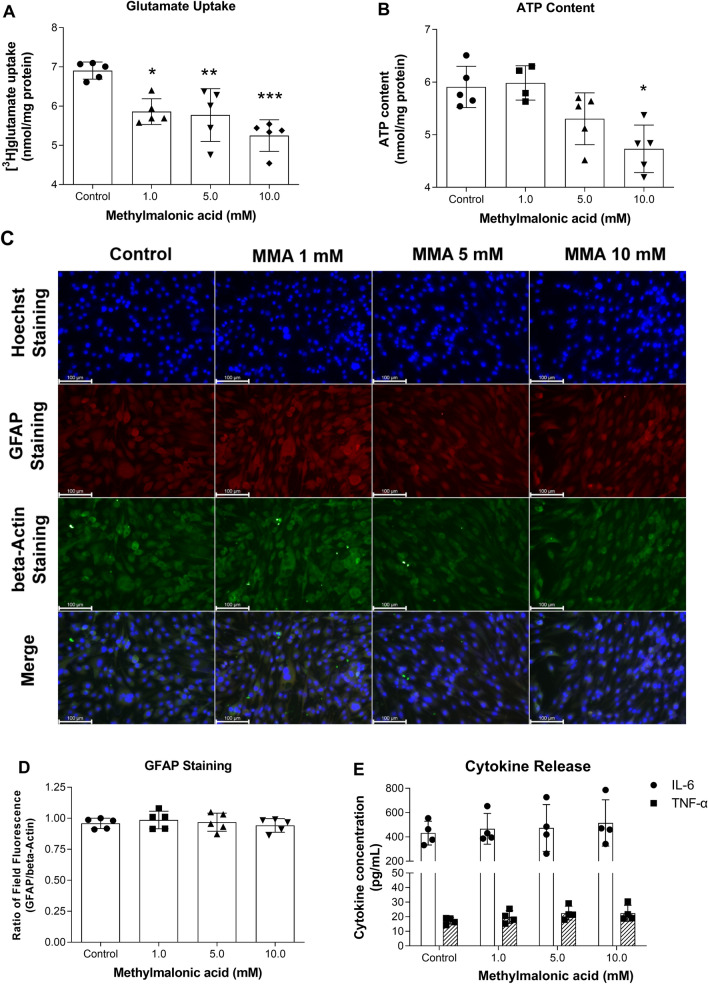
Methylmalonic acidemia is an organic acidemia caused by deficient activity of L-methylmalonyl-CoA mutase or its cofactor cyanocobalamin and it is biochemically characterized by an accumulation of methylmalonic acid (MMA) in tissue and body fluids of patients. The main clinical manifestations of this disease are neurological and observable symptoms during metabolic decompensation are encephalopathy, cerebral atrophy, coma, and seizures, which commonly appear in newborns. This study aimed to investigate the toxic effects of MMA in a glial cell line presenting astrocytic features. Astroglial C6 cells were exposed to MMA (0.1-10 mM) for 24 or 48 h and cell metabolic viability, glucose consumption, and oxygen consumption rate, as well as glutamate uptake and ATP content were analyzed. The possible preventive effects of bezafibrate were also evaluated. MMA significantly reduced cell metabolic viability after 48-h period and increased glucose consumption during the same period of incubation. Regarding the energy homeostasis, MMA significantly reduced respiratory parameters of cells after 48-h exposure, indicating that cell metabolism is compromised at resting and reserve capacity state, which might influence the cell capacity to meet energetic demands. Glutamate uptake and ATP content were also compromised after exposure to MMA, which can be influenced energy metabolism impairment, affecting the functionality of the astroglial cells. Our findings suggest that these effects could be involved in the pathophysiology of neurological dysfunction of this disease. Methylmalonic acid compromises mitochondrial functioning leading to reduced ATP production and reduces glutamate uptake by C6 astroglial cells.

Keywords: Cell dysfunction; Energy metabolism; Glutamate uptake; High-resolution respirometry; Methylmalonic academia; Organic acidemias.


Conflict of interest statement

The authors declare no conflict of interests.

Figures

Fig. 1
Fig. 1
Effects of methylmalonic acid (MMA) on metabolic activity and cell viability. Metabolic activity was measured by MTT reduction after exposure of C6 glioma cells to MMA for 24 h (A) or 48 h (B). Representative microscopy images of cell morphology (bright field), and viability [propidium iodide (PI) staining]. Scale bar = 100 µm. Rotenone (200 nM) was used as a positive control. Nuclei were detected with Hoechst 33,342 (C). Percentage of PI-positive cells per field (D). Cell viability evaluated by flow cytometry (E). Statistical analysis was performed with one-way ANOVA and multiple comparisons with Tukey’s post hoc test. Data are presented as percentage of controls, and expressed as mean ± SD of 4–5 independent experiments, performed in triplicate. **p < 0.01 compared to control group
Fig. 2
Fig. 2
Glucose consumption and lactate release by C6 glioma cells exposed to methylmalonic acid (MMA). Glucose consumption after 24-h (A) or 48-h (B) exposure to MMA and lactate release after 48-h exposure to MMA (C) were determined as described in Material and Methods section. Statistical analysis was performed with one-way ANOVA and multiple comparisons with Tukey’s post hoc test. Data are presented as nmol glucose consumed/hour or mM lactate released, and expressed as mean ± SD of four independent experiments, performed in duplicates. **p < 0.01 compared to control group
Fig. 3
Fig. 3
Oxygen consumption rate (OCR) in C6 glioma cells exposed to methylmalonic acid (MMA) for 48 h. A Traces of representative experiments of oxygen consumption rate of each experimental group. OCR was measured by high-resolution respirometry, indicating the different parameters of mitochondrial function after injection of oligomycin (ATP synthase inhibitor, 0.5 µM), CCCP (uncoupler, 2.5 µM), rotenone (complex I inhibitor, 0.5 µM), and antimycin A (complex III inhibitor, 0.,5 µM) in the chamber with cells. Routine Respiration (B), ATP-linked respiration (C), Maximal respiration (D), and Reserve Respiratory Capacity (E) were determined as described in Material and Methods section. Statistical analysis was performed with one-way ANOVA and multiple comparisons with Tukey’s post hoc test. Data are represented as pmol consumed O2/s/106 cells, and expressed as mean ± SD for of 4–5 independent experiments, performed in duplicates. *p < 0.05, **p < 0,01, ***p < 0.001 compared to control group
Fig. 4
Fig. 4
Oxygen consumption rate (OCR) in C6 glioma cells exposed to increasing concentrations of bezafibrate (Beza) for 48 h. Routine Respiration (A), ATP-linked respiration (B), Maximal respiration (C), and Reserve Respiratory Capacity (D) were determined as described in Material and Methods section. Statistical analysis was performed with one-way ANOVA and multiple comparisons with Tukey’s post hoc test. Data are represented as pmol consumed O2/s/106 cells, and expressed as mean ± SD for of 4–5 independent experiments, performed in duplicates. *p < 0.05, **p < 0,01, ***p < 0.001 compared to control group
Fig. 5
Fig. 5
Effects of co-exposure of methylmalonic acid (MMA, 1 and 5 mM) and bezafibrate (Beza, 200 nM) on C6 glioma cells. Representative fluorescence microscopy images of MitoTracker Green FM (MTG) staining. Scale bar = 100 µm. Nuclei were detected with Hoechst 33,342 (A). Field MTG fluorescence normalized by Hoechst fluorescence (B). Glucose consumption (C) and the respiratory parameters Routine Respiration (D), ATP-linked respiration (E), Maximal respiration (F), and Reserve Respiratory Capacity (G) were determined as described in Material and Methods section. Statistical analysis was performed with one-way ANOVA and multiple comparisons with Tukey’s post hoc test. Data are represented as pmol consumed O2/s/106 cells, and expressed as mean ± SD for 4 independent experiments, performed in duplicates. *p < 0.05, **p < 0,01, ***p < 0.001 compared to control group; # p < 0.05, ## p < 0,01, ### p < 0.001 compared to Beza; Ψ p < 0.05 compared to same MMA concentration devoid of Beza
Fig. 6
Fig. 6
Effects of methylmalonic acid (MMA) exposure on astrocytic parameters evaluated in C6 cells for 48 h. Glutamate uptake (A). Total intracellular ATP content (B). Representative fluorescence microscopy images of GFAP and beta-actin staining. Scale bar = 100 µm. Nuclei were detected with Hoechst 33,342 (C). Field GFAP fluorescence normalized by beta-actin fluorescence (D). Levels of interleukin-6 and TNF-α in culture medium (E). Statistical analysis was performed with one-way ANOVA and multiple comparisons with Tukey’s post hoc test. Data are presented as nmol/mg protein (glutamate uptake and ATP content), as ratio of fluorescence (GFAP staining) and as pg/mL (cytokine release), and expressed as mean ± SD for 4–5 independent experiments, performed in triplicates. *p < 0.01, **p < 0.01, ***p < 0.001 compared to control group

Similar articles

Cited by

References

    1. Abbott NJ, Ronnback L, Hansson E (2006) Astrocyte-endothelial interactions at the blood-brain barrier. Nat Rev Neurosci 7(1):41–53. 10.1038/nrn1824 - PubMed
    1. Augustyniak J, Lenart J, Gaj P, Kolanowska M, Jazdzewski K, Stepien PP, Buzanska L (2019) Bezafibrate upregulates mitochondrial biogenesis and influence neural differentiation of human-induced pluripotent stem cells. Mol Neurobiol 56(6):4346–4363. 10.1007/s12035-018-1368-2 - PMC - PubMed
    1. Baumgartner MR, Horster F, Dionisi-Vici C, Haliloglu G, Karall D, Chapman KA, Huemer M, Hochuli M, Assoun M, Ballhausen D, Burlina A, Fowler B, Grunert SC, Grunewald S, Honzik T, Merinero B, Perez-Cerda C, Scholl-Burgi S, Skovby F, Wijburg F, MacDonald A, Martinelli D, Sass JO, Valayannopoulos V, Chakrapani A (2014) Proposed guidelines for the diagnosis and management of methylmalonic and propionic acidemia. Orphanet J Rare Dis 9:130. 10.1186/s13023-014-0130-8 - PMC - PubMed
    1. Bradford MM (1976) A rapid and sensitive method for the quantitation of microgram quantities of protein utilizing the principle of protein-dye binding. Anal Biochem 72:248–254. 10.1006/abio.1976.9999 - PubMed
    1. Brand M, Nicholls D (2011) Assessing mitochondrial dysfunction in cells. Biochem J 435(Pt 2):297–312. 10.1042/bj20110162 - PMC - PubMed

Supplementary concepts

LinkOut - more resources