. 2022 Aug 15;28(16):3590-3602.
doi: 10.1158/1078-0432.CCR-22-0296.

Single-Cell RNA Sequencing Reveals the Tissue Architecture in Human High-Grade Serous Ovarian Cancer

Affiliations

Single-Cell RNA Sequencing Reveals the Tissue Architecture in Human High-Grade Serous Ovarian Cancer

Junfen Xu et al. Clin Cancer Res. .

Abstract

Purpose: The heterogeneity of high-grade serous ovarian cancer (HGSOC) is not well studied, which severely hinders clinical treatment of HGSOC. Thus, it is necessary to characterize the heterogeneity of HGSOC within its tumor microenvironment (TME).

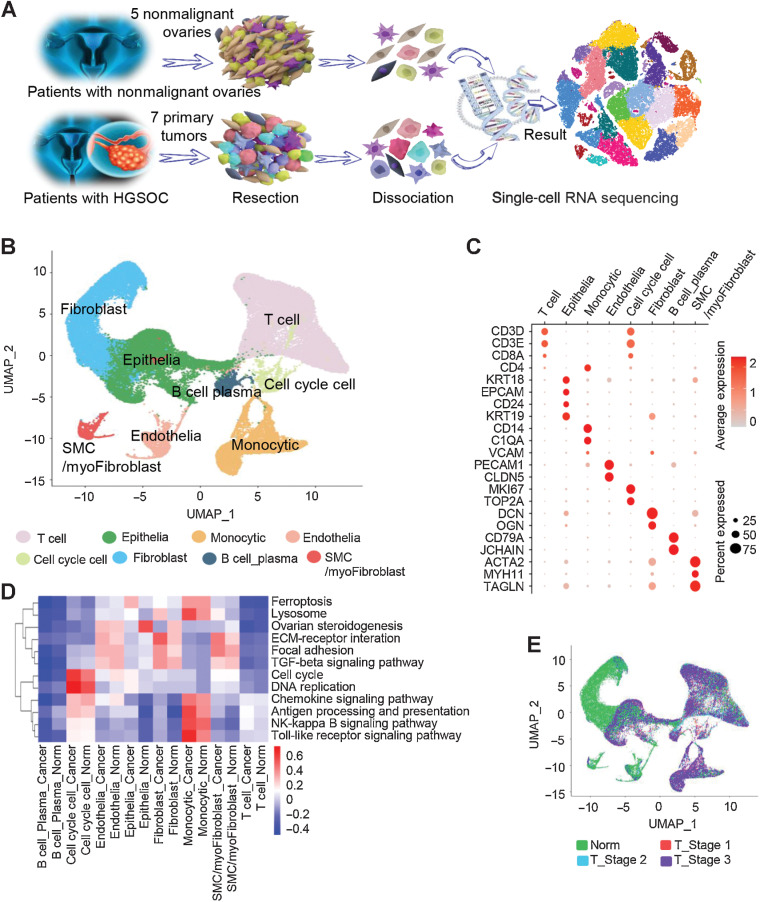
Experimental design: The tumors of 7 treatment-naïve patients with HGSOC at early or late stages and five age-matched nonmalignant ovarian samples were analyzed by deep single-cell RNA sequencing (scRNA-seq).

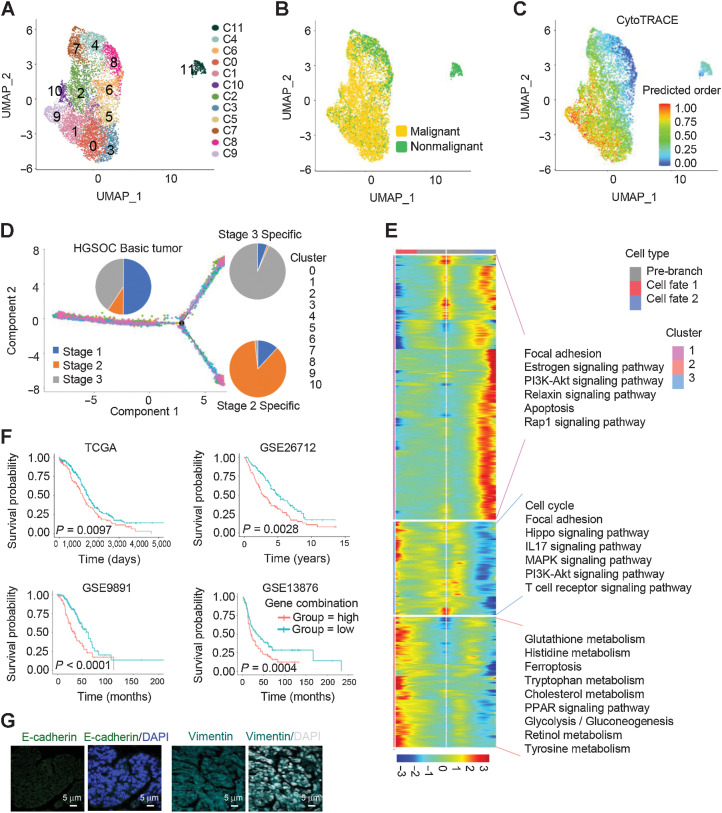
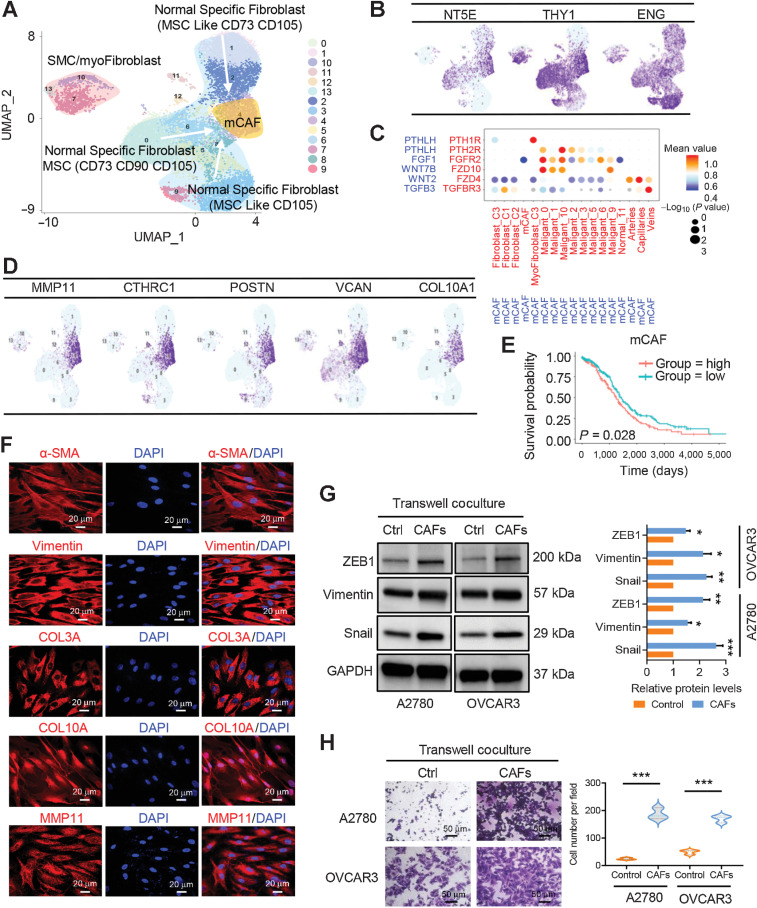
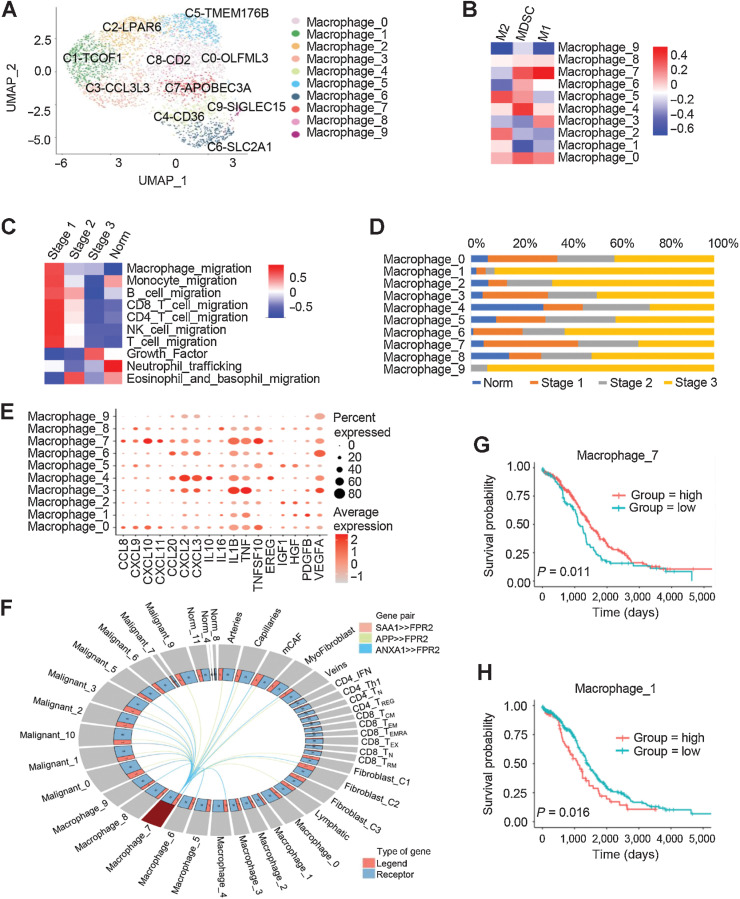
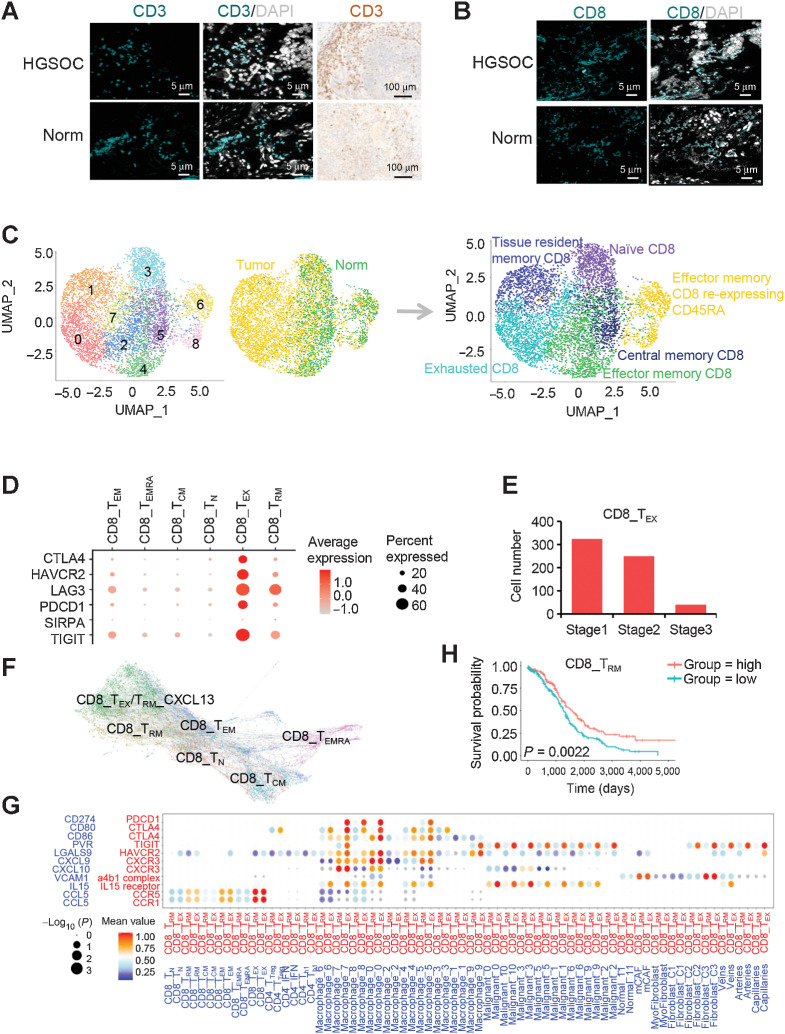
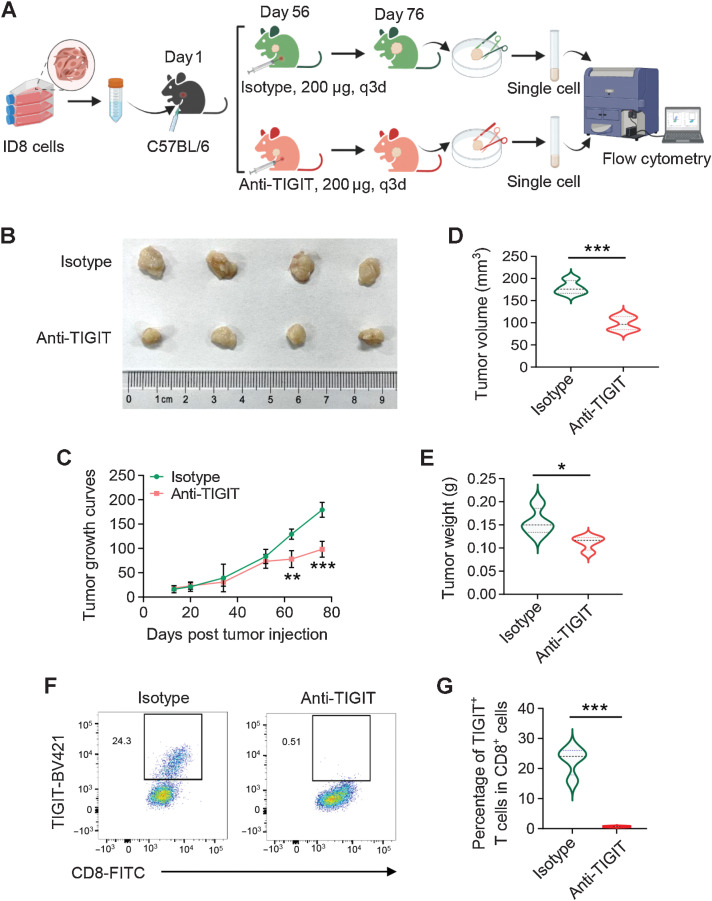
Results: A total of 59,324 single cells obtained from HGSOC and nonmalignant ovarian tissues were sequenced by scRNA-seq. Among those cells, tumor cells were characterized by a set of epithelial-to-mesenchymal transition (EMT)-associated gene signatures, in which a combination of NOTCH1, SNAI2, TGFBR1, and WNT11 was further selected as a genetic panel to predict the poor outcomes of patients with HGSOC. Matrix cancer-associated fibroblasts (mCAF) expressing α-SMA, vimentin, COL3A, COL10A, and MMP11 were the dominant CAFs in HGSOC tumors and could induce EMT properties of ovarian cancer cells in the coculture system. Specific immune cell subsets such as C7-APOBEC3A M1 macrophages, CD8+ TRM, and TEX cells were preferentially enriched in early-stage tumors. In addition, an immune coinhibitory receptor TIGIT was highly expressed on CD8+ TEX cells and TIGIT blockade could significantly reduce ovarian cancer tumor growth in mouse models.

Conclusions: Our transcriptomic results analyzed by scRNA-seq delineate an ecosystemic landscape of HGSOC at early or late stages with a focus on its heterogeneity with TME. The major applications of our findings are a four-EMT gene model for prediction of HGSOC patient outcomes, mCAFs' capability of enhancing ovarian cancer cell invasion and potential therapeutic value of anti-TIGIT treatment.


Figures

Figure 1. Diverse cell types in HGSOC and nonmalignant ovarian tissues delineated by single-cell transcriptomic analysis. A, Workflow depicting the collection and processing of specimens of HGSOC tumors and nonmalignant ovarian tissues for scRNA-seq. B, The UMAP plot demonstrates the main cell types in HGSOC and control ovarian tissues. C, Dot plots showing the expression levels of specific marker genes in each cell type. The size of dots indicates the proportion of cells expressing the particular marker gene. The spectrum of color represents the mean expression levels of the marker genes. D, Heatmap showing differentially activated pathways of each cell type in the HGSOC and nonmalignant groups. E, Cell composition distribution for each group with different clinical stages.
Figure 1.
Diverse cell types in HGSOC and nonmalignant ovarian tissues delineated by single-cell transcriptomic analysis. A, Workflow depicting the collection and processing of specimens of HGSOC tumors and nonmalignant ovarian tissues for scRNA-seq. B, The UMAP plot demonstrates the main cell types in HGSOC and control ovarian tissues. C, Dot plots showing the expression levels of specific marker genes in each cell type. The size of dots indicates the proportion of cells expressing the particular marker gene. The spectrum of color represents the mean expression levels of the marker genes. D, Heatmap showing differentially activated pathways of each cell type in the HGSOC and nonmalignant groups. E, Cell composition distribution for each group with different clinical stages.
Figure 2. Differential gene expression signatures and impact of EMT-associated genes on HGSOC tumors. A, UMAP plot with clusters demarcated by colors demonstrating 12 distinct clusters based on gene expression differences for 14,636 epithelial cells passing quality control. B, The UMAP plot demarcated by colors showing the two groups of HGSOC tumors (malignant) and nonmalignant ovarian tissues. C, CytoTRACE analysis of epithelial cells. D, Pseudotime analysis of malignant epithelial cells inferred by Monocle2. Each point corresponds to a single cell. Cluster and stage information is shown. E, The differentially expressed genes (rows) along the pseudotime (columns) were hierarchically clustered into three subclusters. The representative annotated pathways of each subcluster are provided. F, The combination of NOTCH1, SNAI2, WNT11, and TGFBR1 expression was associated with worse patient OS in TCGA HGSOC cohort, GSE26712 HGSOC cohort, GES9891 serous ovarian cancer cohort, GSE13876 serous ovarian cancer cohort, respectively. P values were calculated by a log-rank test. G, IF staining with anti-E-cadherin and vimentin antibodies in HGSOC tissue sections.
Figure 2.
Differential gene expression signatures and impact of EMT-associated genes on HGSOC tumors. A, UMAP plot with clusters demarcated by colors demonstrating 12 distinct clusters based on gene expression differences for 14,636 epithelial cells passing quality control. B, The UMAP plot demarcated by colors showing the two groups of HGSOC tumors (malignant) and nonmalignant ovarian tissues. C, CytoTRACE analysis of epithelial cells. D, Pseudotime analysis of malignant epithelial cells inferred by Monocle2. Each point corresponds to a single cell. Cluster and stage information is shown. E, The differentially expressed genes (rows) along the pseudotime (columns) were hierarchically clustered into three subclusters. The representative annotated pathways of each subcluster are provided. F, The combination of NOTCH1, SNAI2, WNT11, and TGFBR1 expression was associated with worse patient OS in TCGA HGSOC cohort, GSE26712 HGSOC cohort, GES9891 serous ovarian cancer cohort, and GSE13876 serous ovarian cancer cohort, respectively. P values were calculated by a log-rank test. G, IF staining with anti–E-cadherin and vimentin antibodies in HGSOC tissue sections.
Figure 3. Fibroblast clusters in nonmalignant ovarian tissues and HGSOC tumors. A, UMAP plot with clusters demarcated by colors demonstrating 14 distinct clusters based on gene expression differences for 13,201 fibroblasts. B, UMAP plot color coded for the expression (blue to purple) of marker genes for the clusters of nonmalignant fibroblasts as indicated. C, Dot plot of the cross-compartment chemokine ligand and corresponding chemokine receptor expression by the cell type of the mCAF and TME. The color intensity of each dot represents the mean scran-normalized expression across all patients. The size of dots indicates the proportion of cells that express a gene relative to the total number of cells in that cell type. D, UMAP plot color coded for the expression (blue to purple) of marker genes for the mCAFs. E, Kaplan–Meier OS curves of patients with TCGA HGSOC grouped by the top 10-gene signature of mCAF markers. P values were calculated by a log-rank test. F, IF staining of α-SMA, vimentin, COL3A, COL10A, and MMP11 in primary CAFs derived from HGSOC ascites. G, Protein expression levels of mesenchymal biomarkers including ZEB1, vimentin, and snail were analyzed in ovarian cancer A2780 and OVCAR3 cells alone or transwell cocultured with primary CAFs by Western blot analysis. The protein expression levels were normalized with GAPDH. The normalized value of the control group was set to 1, and the relative protein levels of the sample group are shown as mean ± SD. The results were averaged from three independent experiments. H, Representative images for the invasion analysis of A2780 and OVCAR3 cells alone or transwell cocultured with primary CAFs. Data are mean ± SD from three independent experiments. *, P < 0.05; **, P < 0.01; ***, P < 0.001.
Figure 3.
Fibroblast clusters in nonmalignant ovarian tissues and HGSOC tumors. A, UMAP plot with clusters demarcated by colors demonstrating 14 distinct clusters based on gene expression differences for 13,201 fibroblasts. B, UMAP plot color coded for the expression (blue to purple) of marker genes for the clusters of nonmalignant fibroblasts as indicated. C, Dot plot of the cross-compartment chemokine ligand and corresponding chemokine receptor expression by the cell type of the mCAF and TME. The color intensity of each dot represents the mean scran-normalized expression across all patients. The size of dots indicates the proportion of cells that express a gene relative to the total number of cells in that cell type. D, UMAP plot color coded for the expression (blue to purple) of marker genes for the mCAFs. E, Kaplan–Meier OS curves of patients with TCGA HGSOC grouped by the top 10–gene signature of mCAF markers. P values were calculated by a log-rank test. F, IF staining of α-SMA, vimentin, COL3A, COL10A, and MMP11 in primary CAFs derived from HGSOC ascites. G, Protein expression levels of mesenchymal biomarkers including ZEB1, vimentin, and snail were analyzed in ovarian cancer A2780 and OVCAR3 cells alone or transwell cocultured with primary CAFs by Western blot analysis. The protein expression levels were normalized with GAPDH. The normalized value of the control group was set to 1, and the relative protein levels of the sample group are shown as mean ± SD. The results were averaged from three independent experiments. H, Representative images for the invasion analysis of A2780 and OVCAR3 cells alone or transwell cocultured with primary CAFs. Data are mean ± SD from three independent experiments. *, P < 0.05; **, P < 0.01; ***, P < 0.001.
Figure 4. Characteristics of macrophages in different tumor stages. A, UMAPs of macrophages from all patients, colored by the identified cell subpopulations. B, Heatmap depicting the gene enrichment for classical cell types M1, M2, and MDSCs in comparison with the macrophage subclusters. C, Heatmap showing differentially activated pathways of each clinical stage in the HGSOC and nonmalignant groups. D, Macrophage cell-type fractions relative to the total macrophage cell count in each clinical stage group. Each stacked bar represents a cluster for which the total macrophage cell count was scaled to 1. E, Dot plots showing the expression levels of specific chemokine genes in each macrophage cluster. F, Model of the cross-compartment chemokine ligand-receptor interactions between macrophage_7 and the TME. OS for patients further stratified according to macrophage_7 (G) and macrophage_1 (H) signature expression. Log-rank P values are shown.
Figure 4.
Characteristics of macrophages in different tumor stages. A, UMAPs of macrophages from all patients, colored by the identified cell subpopulations. B, Heatmap depicting the gene enrichment for classical cell types M1, M2, and MDSCs in comparison with the macrophage subclusters. C, Heatmap showing differentially activated pathways of each clinical stage in the HGSOC and nonmalignant groups. D, Macrophage cell-type fractions relative to the total macrophage cell count in each clinical stage group. Each stacked bar represents a cluster for which the total macrophage cell count was scaled to 1. E, Dot plots showing the expression levels of specific chemokine genes in each macrophage cluster. F, Model of the cross-compartment chemokine ligand-receptor interactions between macrophage_7 and the TME. OS for patients further stratified according to macrophage_7 (G) and macrophage_1 (H) signature expression. Log-rank P values are shown.
Figure 5. Cell clustering and functional annotation of CD8+ T cells in HGSOC and nonmalignant ovarian tissues. A, Detection of CD3 (green) in T cells by IF staining in HGSOC and nonmalignant ovarian tissues. Nuclei were stained with DAPI (gray). The validation of CD3 was also confirmed by IHC. B, Detection of CD8 (green) in T cells by IF staining in HGSOC and nonmalignant ovarian tissues. Nuclei were stained with DAPI (gray). C, UMAPs of CD8+ T cells from all patients, colored by the identified cell subpopulations. D, Dot plot of the average expression of CTLA4, HAVCR2, LAG3, PDCD1, SIRPA, and TIGIT in CD8+ T-cell subpopulations. E, Bar plots showing the fraction of CD8+ TEX cells relative to the total CD8+ T count grouped by tumor stage. F, PAGA pseudospatial trajectory analysis of six colored CD8+ T-cell subclusters. G, Dot plot of the cross-compartment chemokine ligand and corresponding receptor expression by cell type of the CD8+ TRM /TEX and TME. H, Kaplan–Meier survival curves for OS from n = 373 primary HGSOCs showing significant prognostic separation according to the CD8+ TRM marker gene signature derived from single-cell data. Log-rank P values are shown.
Figure 5.
Cell clustering and functional annotation of CD8+ T cells in HGSOC and nonmalignant ovarian tissues. A, Detection of CD3 (green) in T cells by IF staining in HGSOC and nonmalignant ovarian tissues. Nuclei were stained with DAPI (gray). The validation of CD3 was also confirmed by IHC. B, Detection of CD8 (green) in T cells by IF staining in HGSOC and nonmalignant ovarian tissues. Nuclei were stained with DAPI (gray). C, UMAPs of CD8+ T cells from all patients, colored by the identified cell subpopulations. D, Dot plot of the average expression of CTLA4, HAVCR2, LAG3, PDCD1, SIRPA, and TIGIT in CD8+ T-cell subpopulations. E, Bar plots showing the fraction of CD8+ TEX cells relative to the total CD8+ T count grouped by tumor stage. F, PAGA pseudospatial trajectory analysis of six colored CD8+ T-cell subclusters. G, Dot plot of the cross-compartment chemokine ligand and corresponding receptor expression by cell type of the CD8+ TRM /TEX and TME. H, Kaplan–Meier survival curves for OS from n = 373 primary HGSOCs showing significant prognostic separation according to the CD8+ TRM marker gene signature derived from single-cell data. Log-rank P values are shown.
Figure 6. Blockade of TIGIT inhibits tumor growth in syngeneic mice. A, Workflow showing the experimental process of the animal study. B, C57BL/6 mice were subcutaneously injected with ID8 cells (5 × 10⁶ per mouse) and treated with 200 μg anti-TIGIT or isotype-matched control antibody via intraperitoneal injection as indicated. Tumor growth curves (C), tumor volume (D), and tumor weight (E) at the endpoint were measured. *, P < 0.05; **, P < 0.01; ***, P < 0.001. F and G, Frequency of TIGIT+-CD8+ T cells from tumors in anti-TIGIT or isotype-matched control antibody treated mice by flow cytometry. Data are mean ± SD (n = 4 mice/group). ***, P < 0.001.
Figure 6.
Blockade of TIGIT inhibits tumor growth in syngeneic mice. A, Workflow showing the experimental process of the animal study. B, C57BL/6 mice were subcutaneously injected with ID8 cells (5 × 10⁶ per mouse) and treated with 200 μg anti-TIGIT or isotype-matched control antibody via intraperitoneal injection as indicated. Tumor growth curves (C), tumor volume (D), and tumor weight (E) at the endpoint were measured. *, P < 0.05; **, P < 0.01; ***, P < 0.001. F and G, Frequency of TIGIT+-CD8+ T cells from tumors in anti-TIGIT or isotype-matched control antibody-treated mice by flow cytometry. Data are mean ± SD (n = 4 mice/group). ***, P < 0.001.

Similar articles

Cited by

References

    1. Bray F, Ferlay J, Soerjomataram I, Siegel RL, Torre LA, Jemal A. Global cancer statistics 2018: GLOBOCAN estimates of incidence and mortality worldwide for 36 cancers in 185 countries. CA Cancer J Clin 2018;68:394–424. - PubMed
    1. Maenhoudt N, Defraye C, Boretto M, Jan Z, Heremans R, Boeckx B, et al. . Developing organoids from ovarian cancer as experimental and preclinical models. Stem Cell Reports 2020;14:717–29. - PMC - PubMed
    1. Seidman JD, Horkayne-Szakaly I, Haiba M, Boice CR, Kurman RJ, Ronnett BM. The histologic type and stage distribution of ovarian carcinomas of surface epithelial origin. Int J Gynecol Pathol 2004;23:41–4. - PubMed
    1. Torre LA, Trabert B, DeSantis CE, Miller KD, Samimi G, Runowicz CD, et al. . Ovarian cancer statistics, 2018. CA Cancer J Clin 2018;68:284–96. - PMC - PubMed
    1. Baldwin LA, Huang B, Miller RW, Tucker T, Goodrich ST, Podzielinski I, et al. . Ten-year relative survival for epithelial ovarian cancer. Obstet Gynecol 2012;120:612–8. - PubMed

Publication types