

Point mutations that boost aromatic amino acid production and CO2 assimilation in plants
- PMID: 35675400
- PMCID: PMC9176744
- DOI: 10.1126/sciadv.abo3416
Point mutations that boost aromatic amino acid production and CO2 assimilation in plants
Abstract
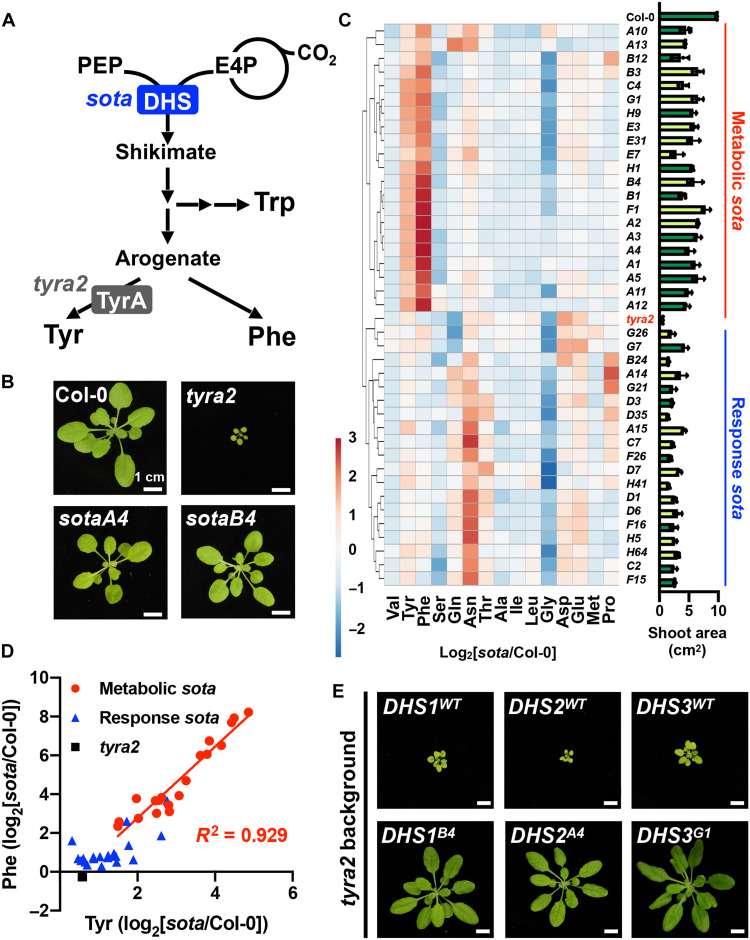
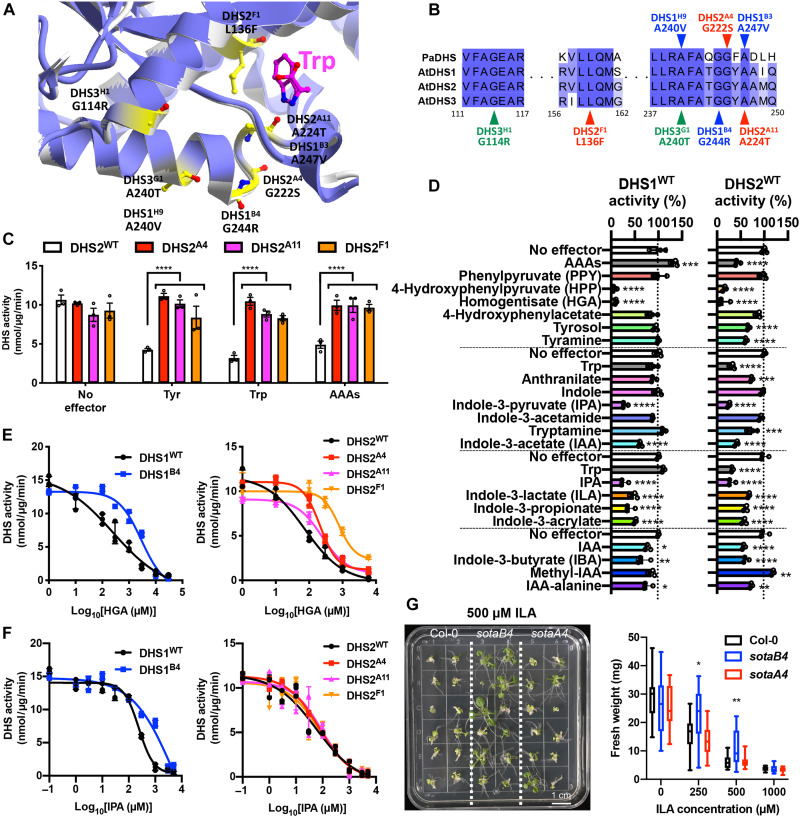
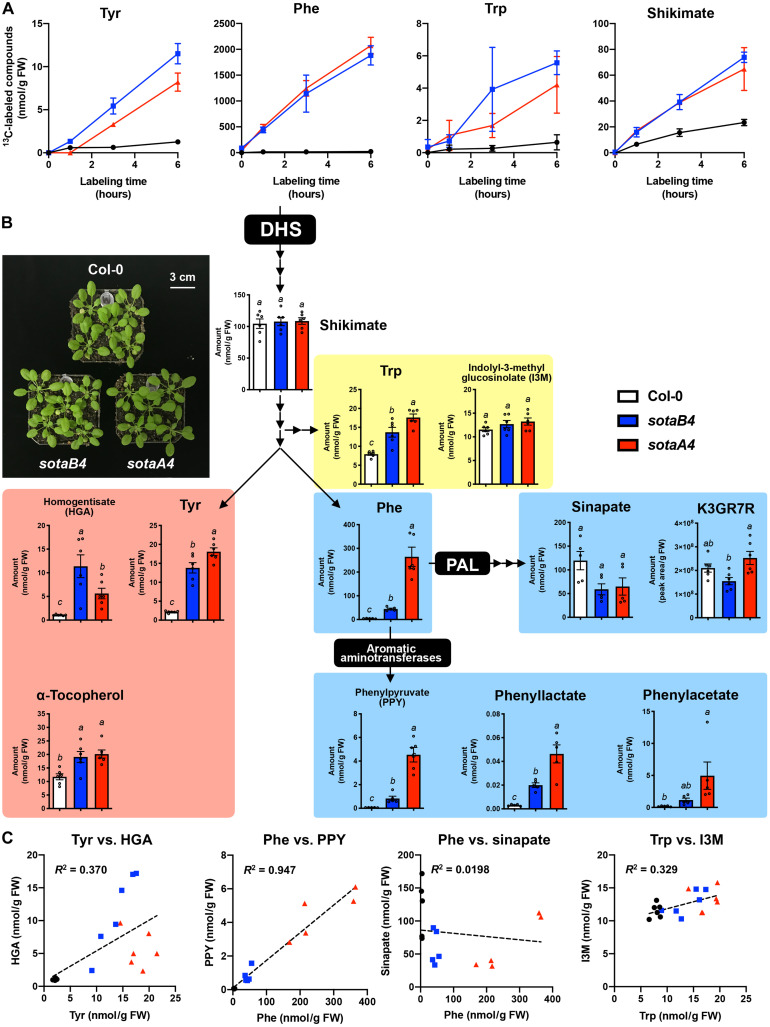
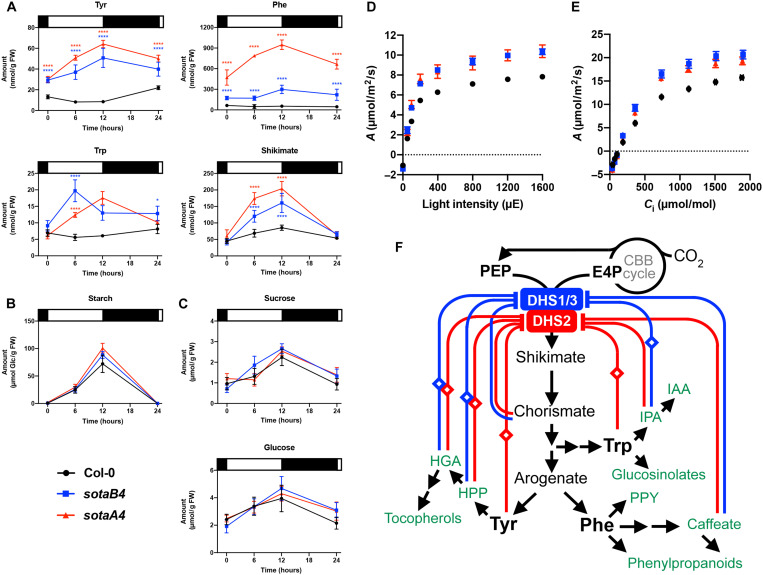
Aromatic compounds having unusual stability provide high-value chemicals and considerable promise for carbon storage. Terrestrial plants can convert atmospheric CO2 into diverse and abundant aromatic compounds. However, it is unclear how plants control the shikimate pathway that connects the photosynthetic carbon fixation with the biosynthesis of aromatic amino acids, the major precursors of plant aromatic natural products. This study identified suppressor of tyra2 (sota) mutations that deregulate the first step in the plant shikimate pathway by alleviating multiple effector-mediated feedback regulation in Arabidopsis thaliana. The sota mutant plants showed hyperaccumulation of aromatic amino acids accompanied by up to a 30% increase in net CO2 assimilation. The identified mutations can be used to enhance plant-based, sustainable conversion of atmospheric CO2 to high-energy and high-value aromatic compounds.
Figures
Similar articles
-
Remodeling of the Photosynthetic Chain Promotes Direct CO2 Conversion into Valuable Aromatic Compounds.Angew Chem Int Ed Engl. 2018 Dec 3;57(49):15990-15994. doi: 10.1002/anie.201808402. Epub 2018 Nov 8. Angew Chem Int Ed Engl. 2018. PMID: 30303594
-
Imbalance of tyrosine by modulating TyrA arogenate dehydrogenases impacts growth and development of Arabidopsis thaliana.Plant J. 2019 Mar;97(5):901-922. doi: 10.1111/tpj.14169. Epub 2019 Jan 18. Plant J. 2019. PMID: 30457178
-
The Biosynthetic Pathways for Shikimate and Aromatic Amino Acids in Arabidopsis thaliana.Arabidopsis Book. 2010;8:e0132. doi: 10.1199/tab.0132. Epub 2010 May 17. Arabidopsis Book. 2010. PMID: 22303258 Free PMC article.
-
New insights into the shikimate and aromatic amino acids biosynthesis pathways in plants.Mol Plant. 2010 Nov;3(6):956-72. doi: 10.1093/mp/ssq048. Epub 2010 Sep 3. Mol Plant. 2010. PMID: 20817774 Review.
-
Building microbial factories for the production of aromatic amino acid pathway derivatives: From commodity chemicals to plant-sourced natural products.Metab Eng. 2020 Mar;58:94-132. doi: 10.1016/j.ymben.2019.08.008. Epub 2019 Aug 10. Metab Eng. 2020. PMID: 31408706 Review.
Cited by
-
A simplified liquid chromatography-mass spectrometry methodology to probe the shikimate and aromatic amino acid biosynthetic pathways in plants.Plant J. 2024 Dec;120(5):2286-2304. doi: 10.1111/tpj.17105. Epub 2024 Oct 28. Plant J. 2024. PMID: 39466904 Free PMC article.
-
Diversification of JAZ-MYC signaling function in immune metabolism.New Phytol. 2023 Sep;239(6):2277-2291. doi: 10.1111/nph.19114. Epub 2023 Jul 4. New Phytol. 2023. PMID: 37403524 Free PMC article.
-
The cytosolic aminotransferase VAS1 coordinates aromatic amino acid biosynthesis and metabolism.Sci Adv. 2024 Jan 12;10(2):eadk0738. doi: 10.1126/sciadv.adk0738. Epub 2024 Jan 10. Sci Adv. 2024. PMID: 38198548 Free PMC article.
-
Evolution of aromatic amino acid metabolism in plants: a key driving force behind plant chemical diversity in aromatic natural products.Philos Trans R Soc Lond B Biol Sci. 2024 Nov 18;379(1914):20230352. doi: 10.1098/rstb.2023.0352. Epub 2024 Sep 30. Philos Trans R Soc Lond B Biol Sci. 2024. PMID: 39343022 Free PMC article. Review.
-
Induced genetic diversity through mutagenesis in wheat gene pool and significant use of SCoT markers to underpin key agronomic traits.BMC Plant Biol. 2024 Jul 15;24(1):673. doi: 10.1186/s12870-024-05345-5. BMC Plant Biol. 2024. PMID: 39004709 Free PMC article.
References
-
- U.S. Department of Energy, Accelerating breakthrough innovation in carbon capture, utilization, and storage (2017); www.energy.gov/fe/downloads/accelerating-breakthrough-innovation-carbon-....
-
- Global Aromatic Market: Information by type (benzene, toluene, O-xylene, P-xylene and others), by application (solvent, additive), by end-use industry (paint & coating, adhesive, pharmaceuticals, chemicals and others), region (North America, Europe, Asia Pacific, Latin America and Middle East & Africa)—Forecast till 2025 (Market Research Future, 2020); www.marketresearchfuture.com/reports/aromatics-market-930.
-
- Li T., Shoinkhorova T., Gascon J., Ruiz-Martínez J., Aromatics production via methanol-mediated transformation routes. ACS Catal. 11, 7780–7819 (2021).
-
- Boerjan W., Ralph J., Baucher M., Lignin biosynthesis. Annu. Rev. Plant Biol. 54, 519–546 (2003). - PubMed
-
- Ragauskas A. J., Beckham G. T., Biddy M. J., Chandra R., Chen F., Davis M. F., Davison B. H., Dixon R. A., Gilna P., Keller M., Langan P., Naskar A. K., Saddler J. N., Tschaplinski T. J., Tuskan G. A., Wyman C. E., Lignin valorization: Improving lignin processing in the biorefinery. Science 344, 1246843 (2014). - PubMed
LinkOut - more resources
Full Text Sources
Molecular Biology Databases
