. 2022 Jun 10;8(23):eabj7918.
doi: 10.1126/sciadv.abj7918. Epub 2022 Jun 8.

Chromatographic separation of active polymer-like worm mixtures by contour length and activity

Affiliations

Chromatographic separation of active polymer-like worm mixtures by contour length and activity

Tess Heeremans et al. Sci Adv. .

Abstract

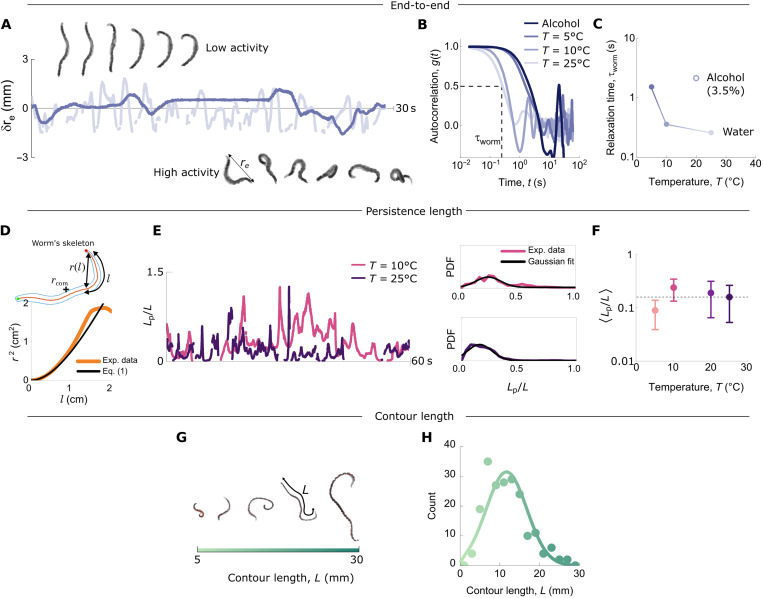
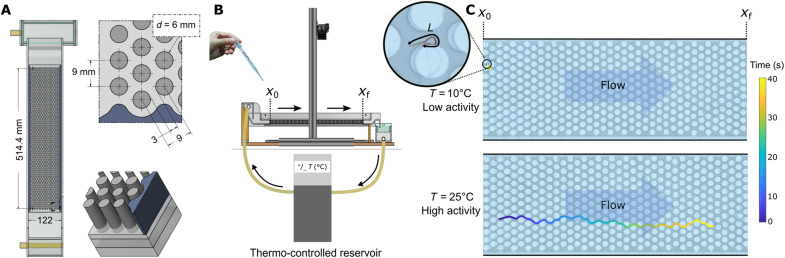
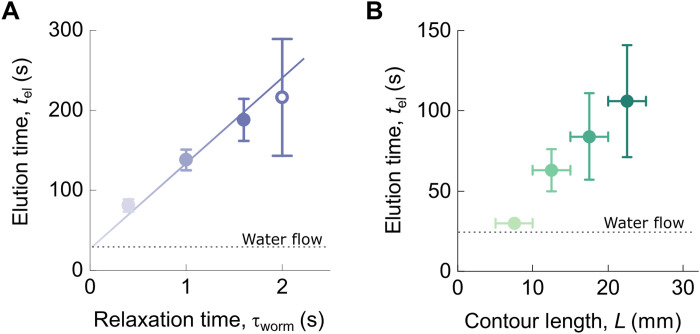
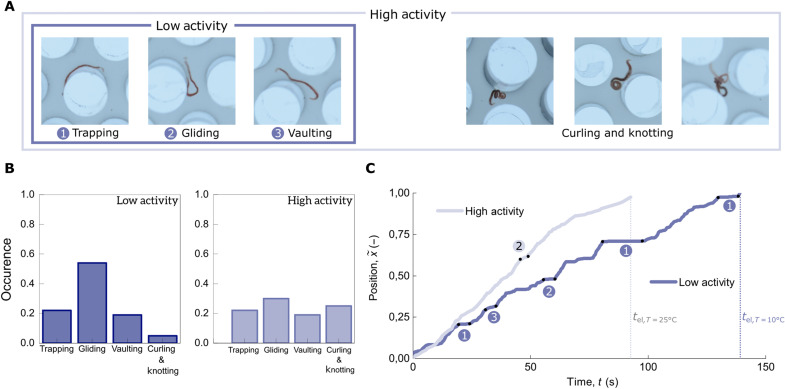
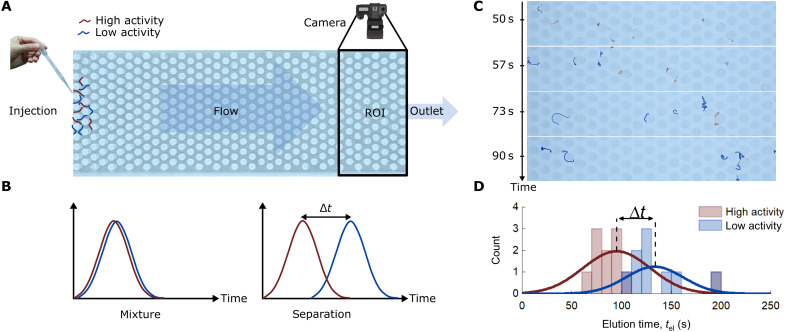
The convective transport rate of polymers through confined geometries depends on their size, allowing for size-based separation of polymer mixtures (chromatography). Here, we investigate whether mixtures of active polymers can be separated in a similar manner based on their activity. We use thin, living Tubifex tubifex worms as a model system for active polymers and study the transport of these worms by an imposed flow through a channel filled with a hexagonal pillar array. The transport rate through the channel depends strongly on the degree of activity, an effect that we assign to the different distribution of conformations sampled by the worms depending on their activity. Our results demonstrate a unique way to sort mixtures of active polymers based on their activity and provide a versatile and convenient experimental system to investigate the hydrodynamics of active polymers.


Figures

Fig. 1.
Fig. 1.. Active worm characterization.
(A) Sequence of images of a single worm at a low level of activity (T = 5°C) compared with the same worm at a high level of activity (T = 25°C). The fluctuating end-to-end distance δre highlights the effect of the temperature on the activity [results from (32)]. (B) Autocorrelation function of δre (Eq. 3) at the different temperature T = 5°, 10°, and 25°C and in the presence of alcohol shown in (A), with the same color code. From this, the characteristic time τworm of a single worm was determined as indicated by the dotted lines and reported in (C) as a function of the temperature and in the presence of alcohol. (D) Persistence length Lp of a worm at a given temperature T and time t, determined by fitting the dependence of the end-to-end distance r(l) with the contour length l (Eq. 1). (E) Persistence length over 60 s for 3000 consecutive conformations (the shape is tracked at a frame rate of 50 fps). The corresponding probability distribution function is shown for two temperatures. From the latter, we extracted the persistence length (F) as a function of temperature by fitting a Gaussian distribution. Error bars are 1σ. (G) The contour length L of a T. tubifex worm increases with its age. (H) A typical distribution of contour lengths from the same batch of worms. The solid curve is a fit to a Gaussian distribution.
Fig. 2.
Fig. 2.. Hydrodynamic pillar array experiment with active polymer–like worms.
(A) Top view of the channel with hexagonal pillar array. The design is based on conventional (hydrodynamic) chromatography experiments (41). The dimensions of the channel are 51 cm by 12 cm by 1.5 cm. The diameter of the pillars is Dpillar = 6 mm, and the interpillar distance is Dint = 3 mm. (B) Schematic of the experimental setup. The worms enter the channel at coordinate x0, travel through the pillar array due to the imposed flow (in the direction of the arrows), and are finally flushed out at xf. The temperature T of the surrounding medium (distilled water) is regulated by a thermo-controlled reservoir. Motion of the transported worms along the whole channel is recorded using a camera placed on the top of the experiment. (C) Trajectories in the channel for the same worms at two different temperatures (top, T = 10°C and bottom, 25°C) in time (color gradient). The continuous line shows the tracked paths along the channel at the two different temperatures for the same amount of time (40 s); decreasing temperature increases the elution time.
Fig. 3.
Fig. 3.. Activity and contour-length dependence of the elution time of the active worms.
(A) Elution time of the active worms plotted against the relaxation time τworm of a single worm at four levels of activity. The colored line indicates a linear relationship. The elution time tel was measured for four different levels of activity (T = 5°, 10°, 25°C and in the presence of alcohol, open symbol). For all the temperatures, the contour length of the worms was kept constant (L = 15 ± 5 mm), and the elution time was averaged on six trajectories. (B) The elution time was measured on 13 worms from the same batch, varying in their contour length, and each worm averaged over six passages in the channel for T = 20°C. The contour lengths are binned on the x axis. Horizontal dashed lines represent the imposed flow rate in the channel. Error bars represent 1σ.
Fig. 4.
Fig. 4.. Effect of active-worm conformations on the transport through a pillar array.
(A) Photographs showing the typical conformations at a high level of activity (T = 25°C, light blue) and restricted to fewer conformations at low activity (i.e., low temperature or in the presence of alcohol, dark blue). (B) Conformation statistics. The worm conformations have been measured along the elution in the channel for two different levels of activity. (C) Tracked position of the active worm along the length of the channel x˜=x(xfx0) for two different levels of activity as a function of time. Conformations of the active worms influence the elution time in the channel. At low level of activity, modes (1 to 3) are dominant, which increases the elution time.
Fig. 5.
Fig. 5.. Hydrodynamics separation of a low- and high-active worms mixture.
(A) A solution of 50/50 high-activity and low-activity worms (the latter prepared by exposing them to 5% of alcohol) is injected at the start of the channel. Low-activity worms are dyed blue to distinguish them from the high-activity worms (red). The last part of the channel is video-recorded [region of interest (ROI)] with a camera, so the worms can be identified and followed in time. (B) Initially injected at t = 0 at the entrance of the channel, the principle of the method relies on the time separation of the two populations. (C) Temporal sequence of images of the ROI showing the separation of the worms based on their activity: The arrival time of the low-activity worms (blue) is delayed with respect to the high-activity worms (red). The blue color of the low-active worms has been artificially enhanced. (D) Resulting elution time for the mixture containing the worms with two levels of activity. At the end of the channel, the high- and low-activity populations are separated by an average delay time Δt 38 s. The solid curves are Gaussian fits.

References

    1. Marchetti M. C., Joanny J. F., Ramaswamy S., Liverpool T. B., Prost J., Rao M., Simha R. A., Hydrodynamics of soft active matter. Phys. Rev. Lett. 85, 1143–1189 (2013).
    1. Salbreux G., Charras G., Paluch E., Actin cortex mechanics and cellular morphogenesis. Trends Cell Biol. 22, 536–545 (2012). - PubMed
    1. Fletcher D. A., Geissler P. L., Active biological materials. Annu. Rev. Phys. Chem. 60, 469–486 (2009). - PMC - PubMed
    1. Vizsnyiczai G., Frangipane G., Maggi C., Saglimbeni F., Bianchi S., Di Leonardo R., Light controlled 3D micromotors powered by bacteria. Nat. Commun. 8, 15974 (2017). - PMC - PubMed
    1. Soler L., Magdanz V., Fomin V. M., Sanchez S., Schmidt O. G., Self-propelled micromotors for cleaning polluted water. ACS Nano 7, 9611–9620 (2013). - PMC - PubMed