. 2022 Jun 10;8(23):eabj2820.
doi: 10.1126/sciadv.abj2820. Epub 2022 Jun 8.

Single-cell antigen-specific landscape of CAR T infusion product identifies determinants of CD19-positive relapse in patients with ALL

Affiliations

Single-cell antigen-specific landscape of CAR T infusion product identifies determinants of CD19-positive relapse in patients with ALL

Zhiliang Bai et al. Sci Adv. .

Abstract

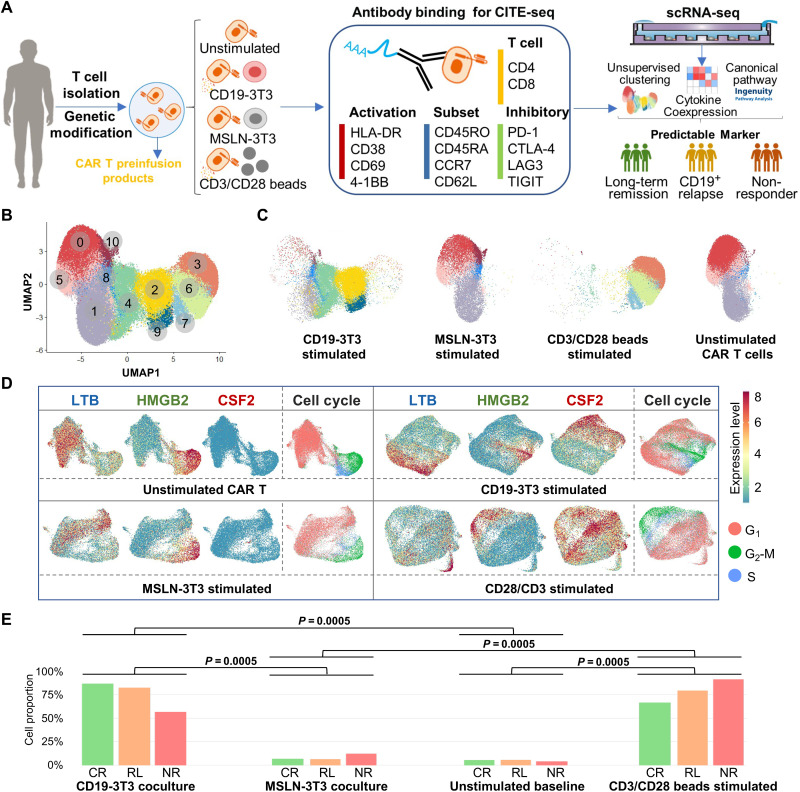
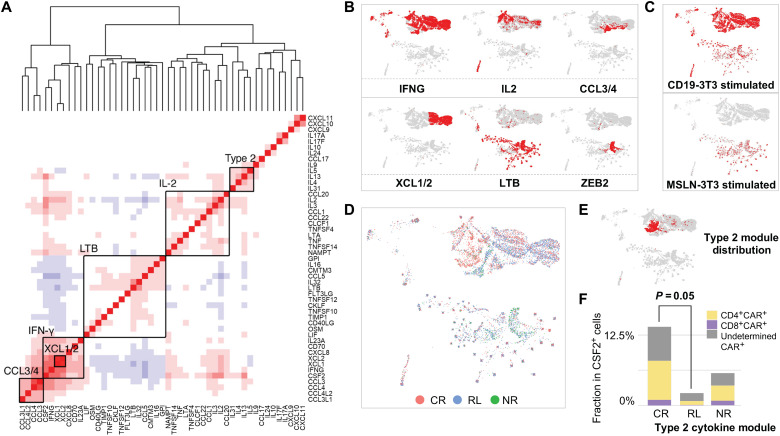
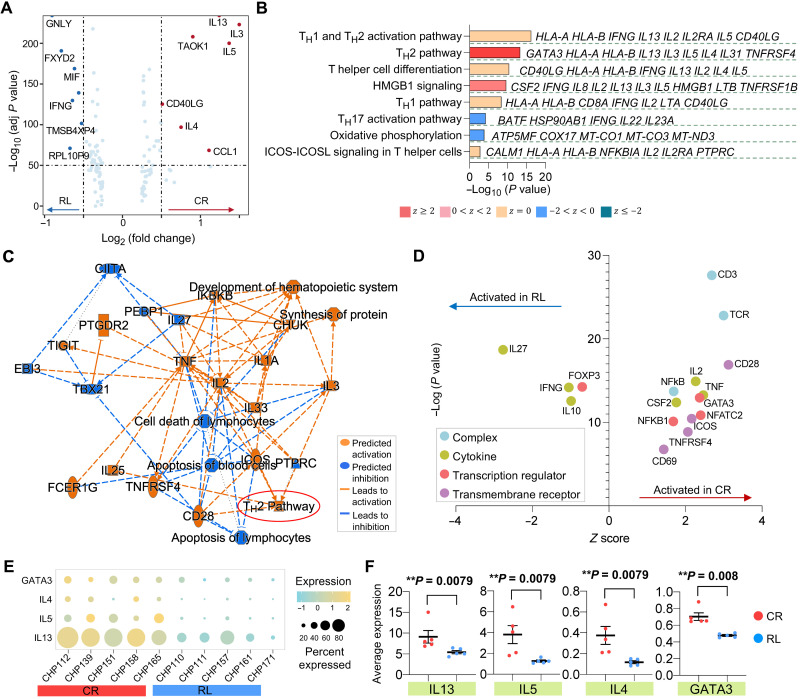
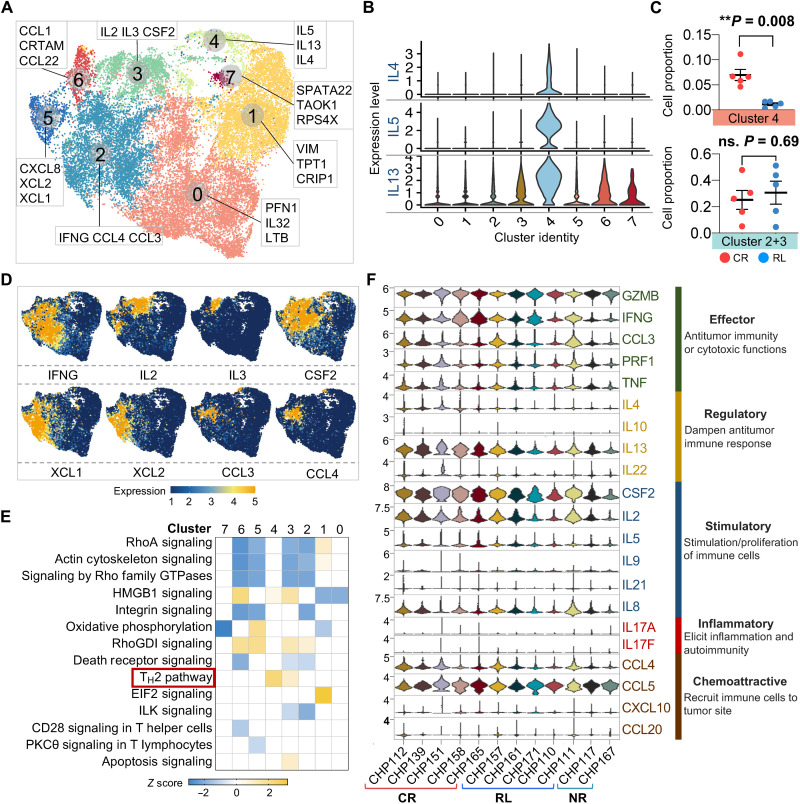
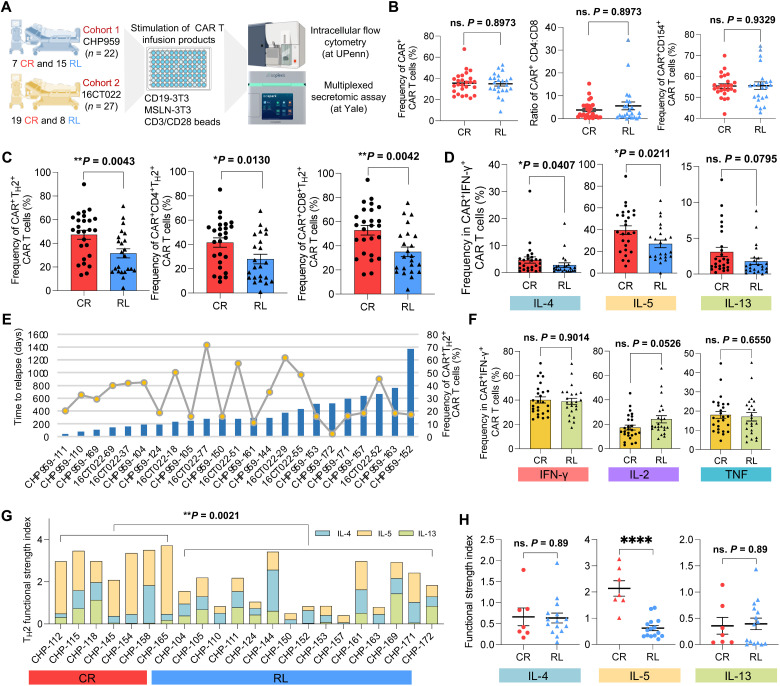
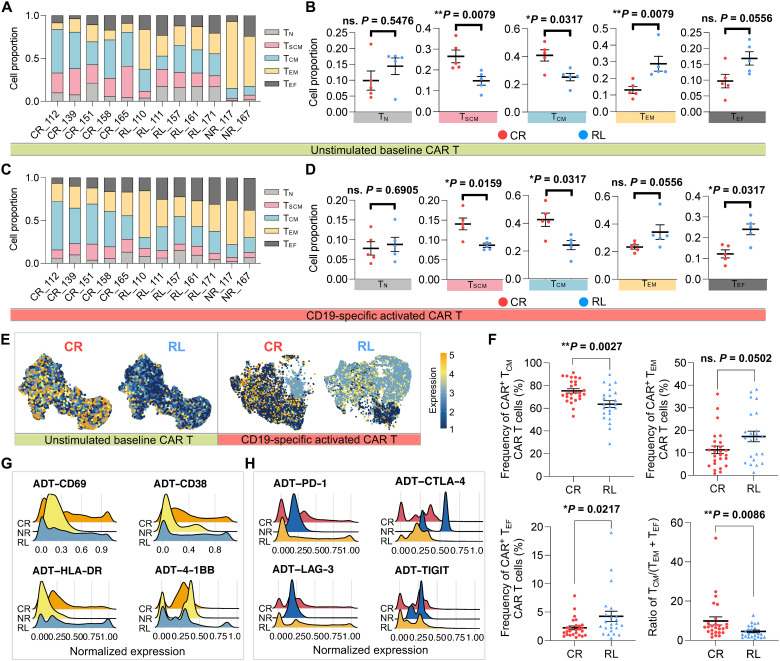
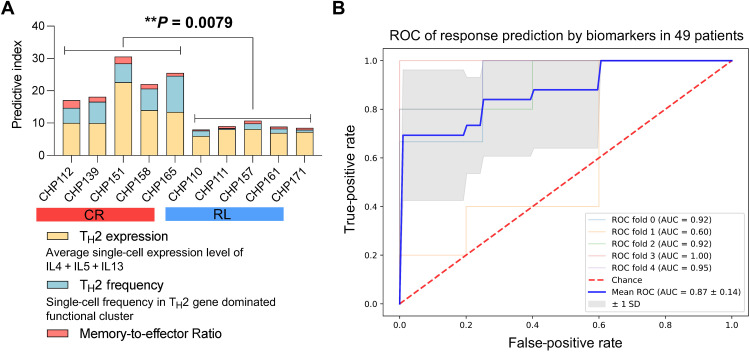
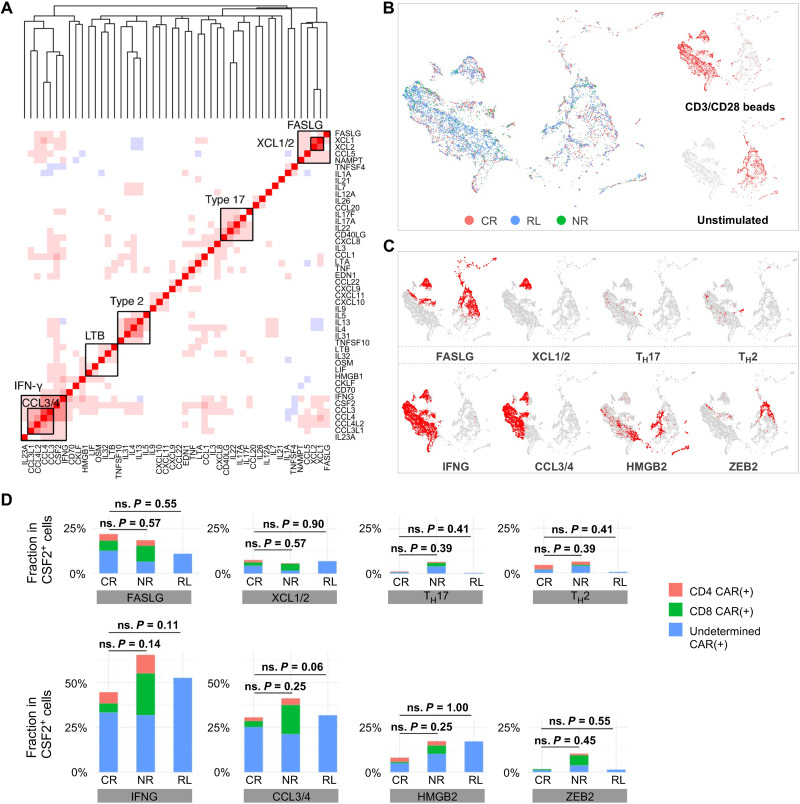
A notable number of acute lymphoblastic leukemia (ALL) patients develop CD19-positive relapse within 1 year after receiving chimeric antigen receptor (CAR) T cell therapy. It remains unclear if the long-term response is associated with the characteristics of CAR T cells in infusion products, hindering the identification of biomarkers to predict therapeutic outcomes. Here, we present 101,326 single-cell transcriptomes and surface protein landscape from the infusion products of 12 ALL patients. We observed substantial heterogeneity in the antigen-specific activation states, among which a deficiency of T helper 2 function was associated with CD19-positive relapse compared with durable responders (remission, >54 months). Proteomic data revealed that the frequency of early memory T cells, rather than activation or coinhibitory signatures, could distinguish the relapse. These findings were corroborated by independent functional profiling of 49 patients, and an integrative model was developed to predict the response. Our data unveil the molecular mechanisms that may inform strategies to boost specific T cell function to maintain long-term remission.


Figures

Fig. 1.
Fig. 1.. A functional landscape and activation states of CD19 CAR T preinfusion products from patients with ALL.
(A) Schematic of experimental design. MSLN, mesothelin. (B) Uniform Manifold Approximation and Projection (UMAP) plot of 97,981 single CAR T cells collected from 12 patients. Eleven clusters are identified through unsupervised clustering. (C) UMAP distribution of all profiled cells separated by stimulation conditions. (D) Clustering and differential expression analysis of single CAR T cells revealed three major populations, characterized respectively by high expression levels of HMGB2, LTB, and CSF2. The distribution of the three marker genes and the cell cycle expression pattern of four experimental conditions were shown. (E) Quantification of fully active CSF2+ cell proportion in three response groups at the four conditions. Upon stimulation with CD19-3T3 cells or anti-CD3/CD28 beads, a large population of cells express high level of CSF2 and other cytokines, including IFNG, IL2, IL13, CCL3/CCL4, and XCL1/XCL2. The P values were calculated with Mann-Whitney test.
Fig. 2.
Fig. 2.. Coexpressed cytokine module analysis of CD19-specific stimulated CAR T cells identified functional heterogeneities and a deficit of TH2 function in CD19-positive relapsed patients.
(A) Coexpressed cytokine modules identified in CD19-specific stimulated CAR+ cells through unsupervised analysis. Genes are ordered by hierarchical clustering. Multiple functional cytokine coexpression modules, including two type 1–like, a type 2, and two chemokine modules, were identified. (B) Expression distribution of the identified modules on the UMAP. (C) Integrated cytokine module representation UMAP split by experimental conditions. (D) Localization of cells from each response group on the integrated UMAP. (E) Distribution of type 2 (TH2) module. (F) Comparison of type 2 (TH2) module–expressed CSF2+CAR+ active cell proportion between very durable remission patients (CR) and CD19+ relapsed patients (RL). The P values were calculated with Mann-Whitney test.
Fig. 3.
Fig. 3.. TH2 function–related pathways, genes, and upstream regulators are collectively down-regulated in activated CAR T cells from patients with CD19-positive relapse.
(A) Volcano plot of DEGs between CAR+ cells from CR and RL patients. (B) Corresponding canonical pathways regulated by the highly differential genes identified in (A). Pathway terms are ranked by –log10 (P value). The side listed gene names represent symbolic molecular marker related to the pathway. A statistical quantity, called z score, is computed and used to characterize the activation level.Z score reflects the predicted activation level (z < 0, inhibited; z > 0, activated; z ≥ 2 or z ≤ − 2 can be considered significant). (C) Graphical network of canonical pathways, upstream regulators, and biological functions regulated by DEGs identified in (A). (D) Predicted activation of upstream regulators, including complex, cytokine, transcription regulator, and transmembrane receptor, in CR or RL patients. (E) Dot plot of TH2-related gene expression of each patient in CR and RL groups. The size of circle represents the proportion of single cells expressing the gene, and the color shade indicates the normalized expression level. (F) Average expression level of genes IL13, IL5, IL4, and GATA3 across all single cells in each patient and their comparison between CR and RL groups. Each scatter point represents the average expression value of all single cells of specific patient. The P values were calculated with Mann-Whitney test. Scatter plots show means ± SEM.
Fig. 4.
Fig. 4.. Single-cell transcriptomic clustering of CAR T cells identifies comparable functional immune profiles between CR and RL patients, except for TH2 function.
(A) UMAP reclustering of CAR+ cells from CR and RL patients and the top three dominant genes defining each cluster. (B) Expression of IL4, IL5, and IL13 in each identified cluster. (C) Comparison of cell proportion in particular cluster between CR and RL patients. The P values were calculated with Mann-Whitney test. ns., not significant. Scatter plots show means ± SEM. (D) Distribution feature plot of functional genes on the UMAP. (E) Canonical signaling pathway comparison between all the identified clusters. DEGs of each cluster are used to identify the biological pathways. A statistical quantity, called z score, is computed and used to characterize the activation level.Z score reflects the predicted activation level (z < 0, inhibited; z > 0, activated; z ≥ 2 or z ≤ − 2 can be considered significant). (F) Single-cell expression level violin plot of all key immunologically relevant cytokine genes from CAR+ cells in each patient.
Fig. 5.
Fig. 5.. Independent functional evaluation in expanded cohorts validates the deficiency of TH2 function in RL patients.
(A) Schematic of validation experimental design. (B) Comparison of CAR+ CAR T cell frequency, CD4:CD8 ratio, and CD154+ CAR T cell frequency between CR and RL patients. (C) Comparison of CAR+TH2+ CAR T cell frequency between CR and RL patients. Left, combined CD4+ and CD8+; middle, CD4+; right, CD8+. TH2 measures the combined frequency of IL-4+, IL-5+, and IL-13+ cells. (D) Frequency comparison of each TH2-related cytokine+ CAR T cells between CR and RL patients. (E) Correlation between TH2+ CAR T cell frequency and the relapse-free duration to the therapy. Bar plots show the days to relapse of each RL patient. Line and dot plots show the frequency of CAR+TH2+ cell of each RL patient. (F) Frequency comparison of major TH1-related cytokine+ CAR T cells between CR and RL patients. (G) Comparison of the TH2 functional strength index (FSI) between CR and RL groups, which was measured by multiplexed secretomic assay using Isoplexis devices. FSI denotes to the frequency of cells secreting specific cytokine multiplied by the average signal intensity of this cytokine. (H) PSI comparison of IL-4, IL-5, and IL-13 between CR and RL groups. All the P values were calculated with Mann-Whitney test. Scatter plots show means ± SEM. ****P < 0.0001.
Fig. 6.
Fig. 6.. Phenotypic proteomic profile reveals the dampened capacity of maintaining early memory T cell states in CAR T cells from relapsed patients.
(A) Differential state composition of unstimulated baseline CAR T cells in each patient based on the expression of CD62L, CCR7, CD45RA, and CD45RO from CITE-seq data. TN, naïve; TSCM, stem cell–like memory; TCM, central memory; TEM, effector memory; TEF, effector T cells. The x axis represents responsive state and patient ID. (B) Proportion comparison of unstimulated CAR T cell phenotypic subsets between CR and RL groups. (C) Differential state composition of CD19-specific activated CAR+ cells in each patient. (D) Proportion comparison of activated CAR+ cell phenotypic subsets between CR and RL groups. (E) Feature plot of cellular protein CCR7 expression in unstimulated or activated CAR T cells, split by responsive groups. (F) Frequency of CAR+ cells with different differential states in the expanded validation cohort. (G) Single-cell expression distribution of the T cell activation–related surface protein markers of each group. (H) Single-cell expression distribution of coinhibitory surface protein markers of each group. All P values were calculated with Mann-Whitney test. Scatter plots show means ± SEM.
Fig. 7.
Fig. 7.. Integrated model analysis demonstrates that the combination of TH2 strength and early memory potential is predictive of patient response durability.
(A) Response predictive index of each patient in the initial discovery cohort (n = 10) and the comparison between CR and RL groups. The index combines TH2 gene expression level, TH2 gene expression frequency, and early memory cell proportion. (B) ROC curve for response prediction based on an integrative biomarker consisting of CAR+TH2+ frequency, TCM frequency, and the (TEM + TEF) frequency in the validation cohort (n = 49). A binomial logistic regression was used to fit the model with CR or RL as the response variable, and a stratified fivefold cross-validation was implemented to compute the ROC and AUC. P value was calculated with Mann-Whitney test.
Fig. 8.
Fig. 8.. TCR-mediated anti-CD3/CD28 beads stimulation of CAR T cells fails to predict clinical responses.
(A) Coexpressed cytokine modules identified in TCR-mediated stimulation. Genes are ordered by hierarchical clustering. (B) An integrated cytokine module representation UMAP. Cells are colored by responsive states, and UMAPs are split by experimental conditions. (C) The distribution of the identified modules on the UMAP. (D) Quantification of identified modules among CR, NR, and RL patients. The P values were calculated with Mann-Whitney test.

References

    1. Bhojwani D., Pui C.-H., Relapsed childhood acute lymphoblastic leukaemia. Lancet Oncol. 14, e205–e217 (2013). - PubMed
    1. Raetz E. A., Bhatla T., Where do we stand in the treatment of relapsed acute lymphoblastic leukemia? Hematology Am. Soc. Hematol. Educ. Program 2012, 129–136 (2012). - PubMed
    1. Kalos M., Levine B. L., Porter D. L., Katz S., Grupp S. A., Bagg A., June C. H., T cells with chimeric antigen receptors have potent antitumor effects and can establish memory in patients with advanced leukemia. Sci. Transl. Med. 3, 95ra73 (2011). - PMC - PubMed
    1. Porter D. L., Levine B. L., Kalos M., Bagg A., June C. H., Chimeric antigen receptor–modified T cells in chronic lymphoid leukemia. N. Engl. J. Med. 365, 725–733 (2011). - PMC - PubMed
    1. Kochenderfer J. N., Wilson W. H., Janik J. E., Dudley M. E., Stetler-Stevenson M., Feldman S. A., Maric I., Raffeld M., Nathan D.-A. N., Lanier B. J., Morgan R. A., Rosenberg S. A., Eradication of B-lineage cells and regression of lymphoma in a patient treated with autologous T cells genetically engineered to recognize CD19. Blood 116, 4099–4102 (2010). - PMC - PubMed