. 2022 Jun 10;8(23):eabn5345.
doi: 10.1126/sciadv.abn5345. Epub 2022 Jun 8.

Glucose-sensing glucagon-like peptide-1 receptor neurons in the dorsomedial hypothalamus regulate glucose metabolism

Affiliations

Glucose-sensing glucagon-like peptide-1 receptor neurons in the dorsomedial hypothalamus regulate glucose metabolism

Zhaohuan Huang et al. Sci Adv. .

Abstract

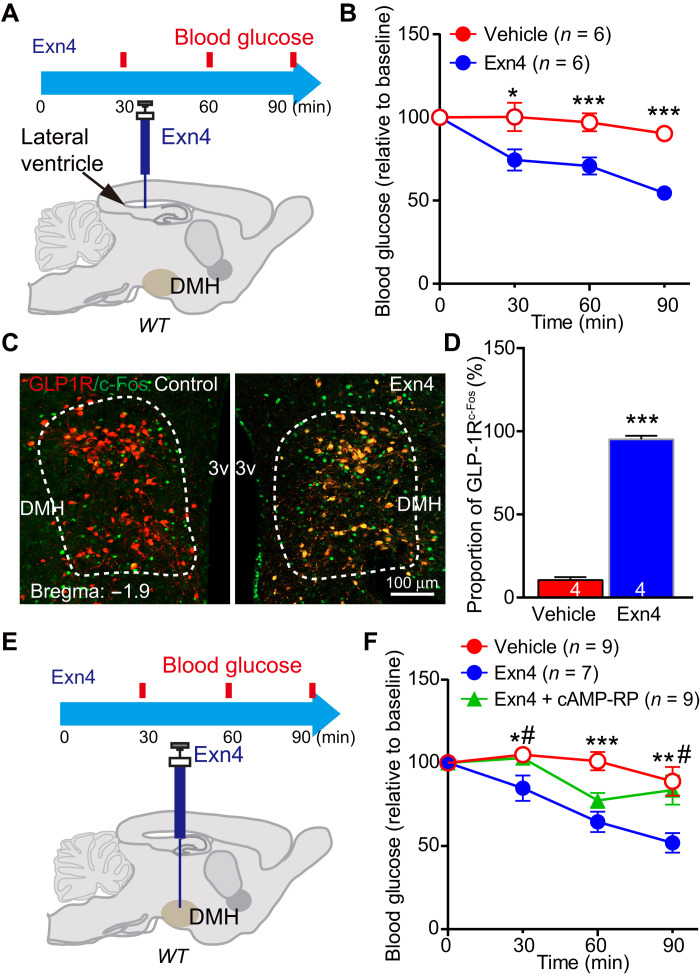
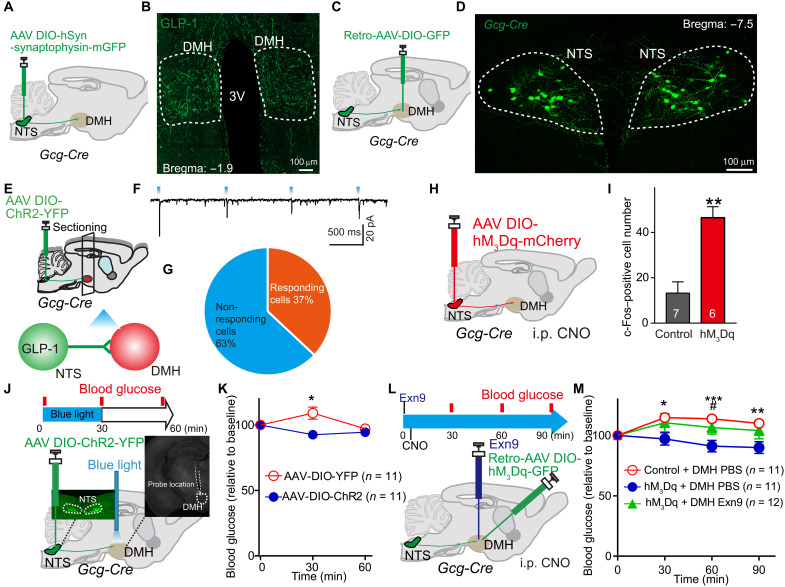
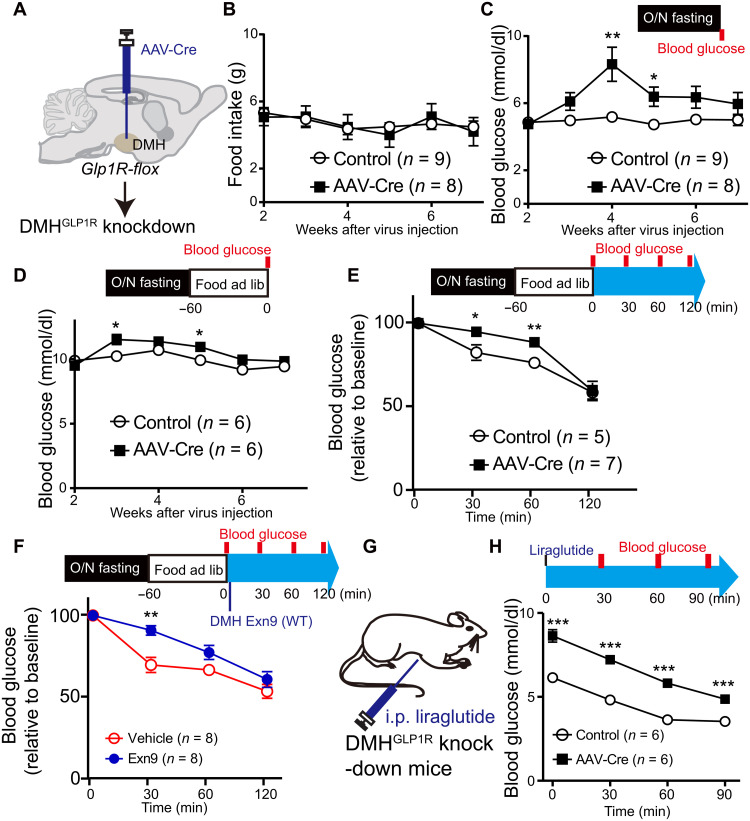
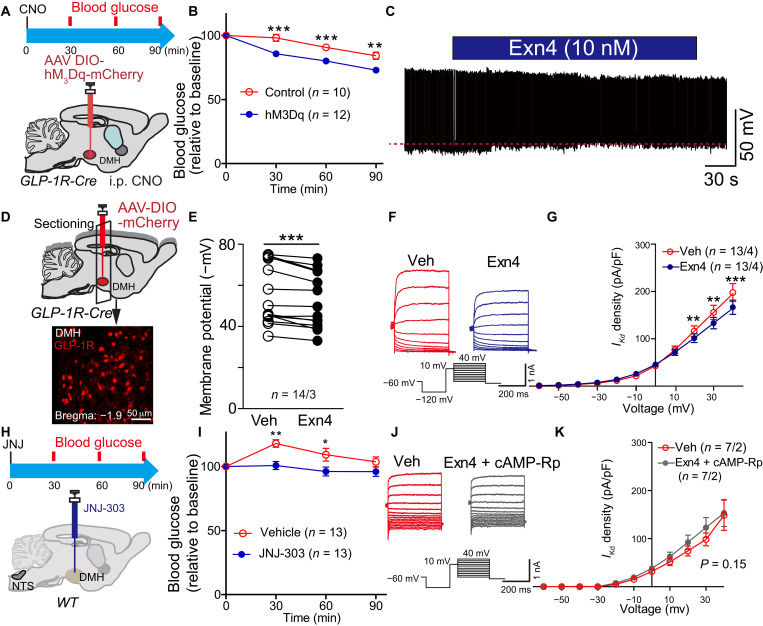
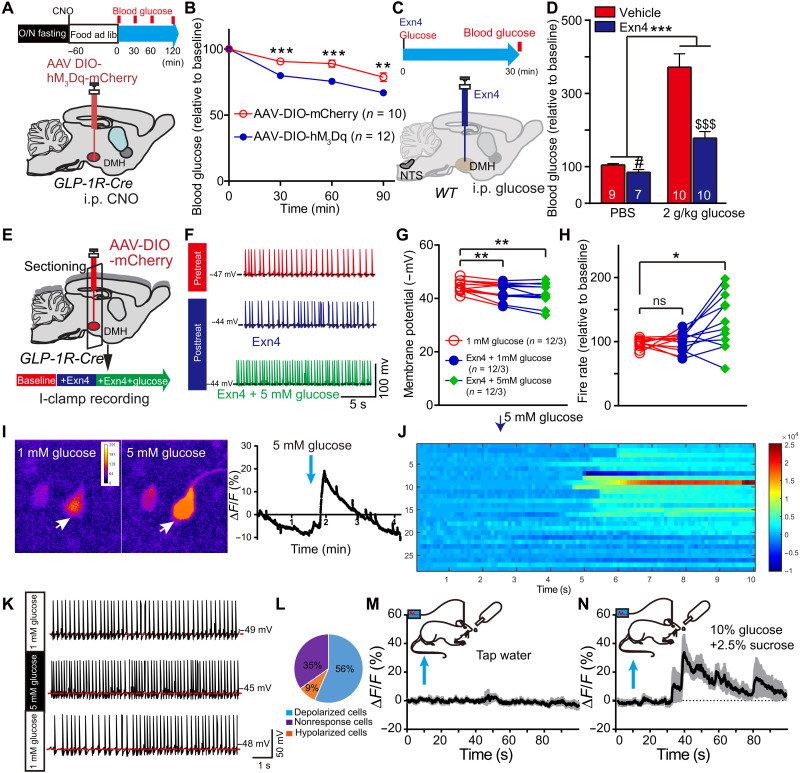
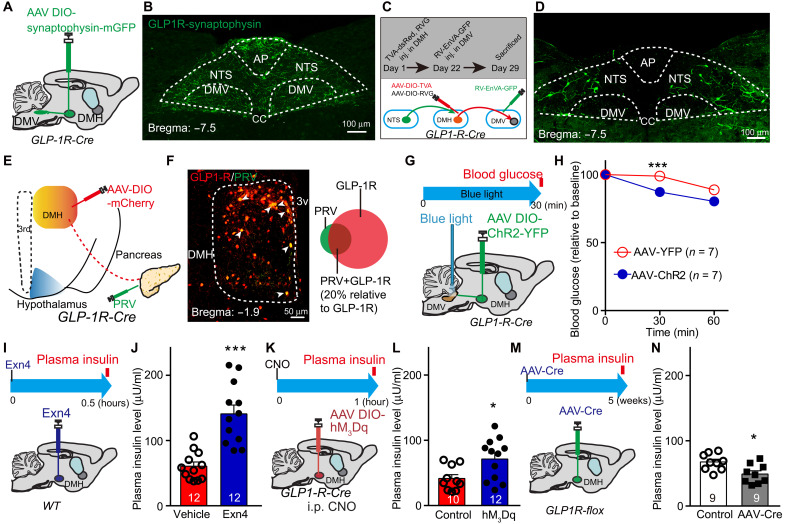
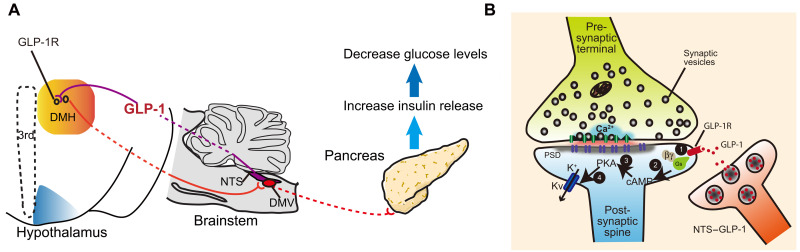
Glucagon-like peptide-1 (GLP-1) regulates energy homeostasis via activation of the GLP-1 receptors (GLP-1Rs) in the central nervous system. However, the mechanism by which the central GLP-1 signal controls blood glucose levels, especially in different nutrient states, remains unclear. Here, we defined a population of glucose-sensing GLP-1R neurons in the dorsomedial hypothalamic nucleus (DMH), by which endogenous GLP-1 decreases glucose levels via the cross-talk between the hypothalamus and pancreas. Specifically, we illustrated the sufficiency and necessity of DMHGLP-1R in glucose regulation. The activation of the DMHGLP-1R neurons is mediated by a cAMP-PKA-dependent inhibition of a delayed rectifier potassium current. We also dissected a descending control of DMHGLP-1R -dorsal motor nucleus of the vagus nerve (DMV)-pancreas activity that can regulate glucose levels by increasing insulin release. Thus, our results illustrate how central GLP-1 action in the DMH can induce a nutrient state-dependent reduction in blood glucose level.


Figures

Fig. 1.
Fig. 1.. Exogenous GLP-1 decreases blood glucose level in the DMH.
(A) Experimental paradigm for ICV injection GLP-1R agonist Exn4 experiment in WT mice. (B) ICV Exn4 caused decrease in fasting blood glucose. *P < 0.05 and ***P < 0.001 (t test). (C) To investigate DMH GLP-1R neuron response to Exn4 injection, we injected adeno-associated virus (AAV)–DIO–mCherry in the DMH of GLP-1R-Cre mice and stained with c-Fos antibody. The representative images showed that ICV Exn4 did increase c-Fos expression in GLP-1R neurons within the DMH. (D) Quantification of c-Fos–positive cell ration (relative to total GLP-1R neurons). ***P < 0.001 (t test). (E) Experimental paradigm for Exn4 injection in DMH of WT mice. (F) Fasting blood glucose decreased after Exn4 injection, an effect that was antagonized by the cAMP-PKA blocker, cAMP-Rp. *P < 0.05, **P < 0.01, and ***P < 0.001 [analysis of variance (ANOVA)], vehicle versus Exn4; #P < 0.05 (ANOVA), Exn4 versus Exn4 + cAMP-Rp (ANOVA). Numbers of animals are indicated in each panel.
Fig. 2.
Fig. 2.. Endogenous GLP-1 signaling in the DMH decreases blood glucose level.
(A) Experimental paradigm for synaptophysin-mGFP–mediated synaptic termination tracing in Gcg-Cre mice. (B) Cre-dependent mGFP expression in the DMH originating from GLP-1 afferents. (C) Experimental paradigm for retro-AAV viral injection in Gcg-Cre mice. (D) Cre-dependent GFP expression in NTS marks GLP-1 neurons in Gcg-Cre mice. (E) Experimental paradigm for CRACM as we described before (17). (F) Representative trace of the photostimulation (470-nm light-emitting diode) evoked synaptic currents in DMH neurons in Gcg-Cre mice (in 100 μM PTX) (17). (G) Percentage of neurons showing synaptic connections (n = 19 cells from four mice). (H) Experimental paradigm for chemogenetic activation of NTSGLP-1 neurons. (I) Activation of NTSGLP-1 neurons significantly increased c-Fos expression in the DMH 1 hour after intraperitoneal injection of CNO. **P < 0.01 (t test). (J) Experimental paradigm for optogenetic stimulation of GLP-1 terminals in the DMH. Gcg-Cre mice were used: AAV-DIO-YFP (control) and AAV-DIO-ChR2-YFP. Blood was collected at three time points: prestimulation, t = 0; during stimulation, t = 30; post-stimulation, t = 60. (K) Fasting blood glucose level is significantly decreased after optogenetic activation of NTS-to-DMH projection. A slight increase on control (YFP) group was observed, which was presumably caused by stress during the experimental process. *P < 0.05 (ANOVA test). (L) Experimental paradigm for chemogenetic stimulation of NTSGLP-1–DMH. (M) Stimulating NTSGLP-1–DMH by intraperitoneal (i.p.) hM3Dq-specific agonist, CNO significantly decreased fasting blood glucose when compared to control group (retro-AAV-DIO-GFP–infected Gcg-Cre mice). Again, a slight increase on vehicle group was observed, which can be induced by the experimental process. *P < 0.05, **P < 0.01, and ***P < 0.001 (ANOVA test). Pretreatment with the GLP-1R antagonist Exn9 completely blocked the NTSGLP-1–DMH–induced decreases on fasting blood glucose level. #P < 0.05 (ANOVA test), hM3Dq + DMH phosphate-buffered saline (PBS) versus hM3Dq + DMH Exn9. The number of animal used is indicated in each panel. The data presenting style for (E) to (G) and (J) were adapted from our previous publication (17).
Fig. 3.
Fig. 3.. Ablation of GLP-1R expression in the DMH increases blood glucose level.
(A) Experimental paradigm for viral injection of AAV-Cre in GLP1Rf/f mice. (B) Overnight food intake is not changed during 7 weeks of observation. (C) Fasting blood glucose level increased 4 weeks after GLP-1R depletion from the DMH. *P < 0.05 and **P < 0.01 (repeat measurement with post hoc t test). (D) To monitor the glucose levels under refed condition, GLP1Rf/f mice were fasted overnight and then food was available for 1 hour. Blood glucose was measured after 1-hour refeeding and was shown higher in GLP-1R depletion group (repeat measurement: group effect, P < 0.05; group × time effect, P < 0.05; post hoc ANOVA, *P < 0.05 at weeks 3 and 5). (E) To study the effect of the GLP-1 signal on postprandial glucose, GLP1Rf/f mice were fasted for overnight. Glucose levels were measured right after 1-hour refeeding, t = 0, and then t = 30 and 60 min. GLP-1R depletion group showed higher postprandial glucose level when compared to control group (repeat measurement, group effect, P < 0.05; post hoc ANOVA, *P < 0.05, **P < 0.01). (F) Exn9 was injected into DMH immediately after 1-hour refeeding in WT mice, and the first time point (t = 0) for glucose level was measured. Then, glucose levels were measured at t = 30 and 60 min. Postprandial glucose significantly increased 0.5 hours after Exn9 injection when compared to vehicle group (repeat measurement, group effect; post hoc ANOVA, P < 0.05; **P < 0.01). (G) Experimental paradigm for GLP-1R agonist liraglutide effect on fasting glucose levels in GLP1Rf/f mice. (H) Fasting blood glucose level decreased in both control and GLP-1R knockdown group after liraglutide injection (repeat measurement, P < 0.001, time effect, P < 0.001, group effect); post hoc ANOVA analysis showed that blood glucose is higher in GLP-1R knockdown group than in control group, **P < 0.01 and ***P < 0.001. n numbers are indicated in each panel.
Fig. 4.
Fig. 4.. GLP-1 regulates DMH GLP-1R neuronal activity via suppression of delayed rectifier potassium currents.
(A) Experimental paradigm for viral injection in GLP-1R-Cre mice. (B) Activation of GLP-1R neurons in the DMH decreased fasting blood glucose levels after intraperitoneal injection of hM3Dq-specific agonist, CNO. **P < 0.01 and **P < 0.001 (ANOVA test), control versus hM3Dq. (C) Representative trace of spontaneous action potential firing after treatment with GLP-1R agonist Exn4 in GLP-1R-Cre mice. (D) Experimental paradigm for recording GLP-1R–positive neurons within DMH following injection of AAV-DIO-mCherry into GLP-1R-Cre mice. (E) Membrane potential is significantly increased after Exn4 treatment, indicating depolarization of those cells. ***P < 0.001 (paired t test; n = 14 cells from three mice for both groups). (F) Representative trace and stimulation protocol for measurement of IKd before and after Exn4 treatment. (G) I-V curve shows a right shift after Exn4 treatment, indicating a suppression of IKd. **P < 0.01 and ***P < 0.001 (repeat measurement and post hoc paired t test; n = 14 cells from three mice for both groups). (H) Experimental paradigm for IKd blocker JNJ-303 injection in DMH of WT mice. (I) Blood glucose decreased after JNJ-303 injection. Again, slight increase on vehicle group was observed, which can be induced by the experimental process. *P < 0.05 and **P < 0.01 (ANOVA test). (J) Representative trace and stimulation protocol for measurement of IKd before and after Exn4 + cAMP-Rp treatment in GLP-1R-Cre mice. (K) I-V curve shows that Exn4-induced suppression of IKd can be diminished by blockade of cAMP-PKA signaling (repeat measurement, group effect, P > 0.05; group × voltage effect, P > 0.05; n = 7 cells from two mice for both groups).
Fig. 5.
Fig. 5.. DMHGLP-1R neurons are glucose sensing.
(A) Experimental paradigm for viral injection in GLP-1R-Cre mice and time schedule for postprandial glucose measurements. (B) Stimulation of DMH GLP-1R neurons significantly decreased blood glucose level when compared to control group in refed condition. **P < 0.01 and ***P < 0.001 (ANOVA test). (C) Experimental paradigm for DMH injection with Exn4 and intraperitoneal injection with glucose (2 g/kg) in WT mice. (D) Exn4 decreased blood glucose in both PBS group (#P < 0.05, t test) and 2 g/kg glucose group ($$$P < 0.001, t test). DMH Exn4 showed a greater ability to lower blood glucose after intraperitoneal glucose injection. ***P < 0.001, Exn4 × glucose effect. (E) Experimental paradigm for the investigation of Exn4 effects on GLP-1R neuronal activity. (F) Representative trace for recording I-clamp from GLP-1R neurons. (G) Membrane potential is significantly increased after Exn4 + 1 mM glucose or Exn4 + 5 mM treatment. **P < 0.01 (paired t test; n = 12 cells from three mice). (H) Exn4 + 5 mM but not Exn4 + 1 mM treatment significantly increased firing rate of GLP-1R neurons. *P < 0.05 (paired t test). (I) Representative cell responses of DMH GLP-1R neurons to 5 mM glucose treatment (pointed by white arrow). (J) Overall, 20 of 29 DMH GLP-1R cells (from four mice) showed a significant change in ΔF/F during 5 mM glucose perfusion. (K) Representative trace for recording I-clamp from GLP-1R neurons during perfusion with 5 mM glucose in GLP-1R-Cre mice. (L) Thirteen of 23 neurons sampled were shown to be glucose excitable, while two cells are inhibited by 5 mM glucose perfusion. (M) No significant change in calcium signal for DMH GLP-1R neurons was found during tap water consumption, while a 30% change in fluorescence was observed during intake of a glucose and sucrose solution (n = 4). (N) Data in (M) and (N) are presented at mean with SEM in shadow.
Fig. 6.
Fig. 6.. A descending control of DMH-DMV-pancreas activity mediates the decreased effect of GLP-1 on blood glucose levels.
(A) Experimental paradigm for synaptophysin-mGFP–mediated anterograde viral tracing in GLP-1R-Cre mice. (B) Cre-dependent mGFP expression in the brainstem including NTS and DMV originating from GLP-1R afferents. (C) Schematic showing tracing of the input-output relationships between DMHGLP-1R+ neurons. Rabies EnVA-ΔG-GFP virus was injected into the DMV. AAV-DIO-RVG and AAV-DIO-TVA-dsRed were coinjected into the DMH of GLP-1R-Cre mice. (D) Representative images showing a substantial rabies-GFP signal from DMV-projecting DMHGLP-1R+ neurons in the NTS. (E) Schematic showing tracing of DMHGLP-1R+ neuron–pancreas projection: PRV-GFP and AAV-DIO-mCherry were injected into pancreas and DMH, respectively, in GLP-1R-Cre mice. (F) Representative image showing GLP-1R+ neurons (red) and pancreas-projecting neurons (green). Representative pancreas-projecting GLP-1R+ neurons indicated by white arrow (left). PRV-positive cell proportion (relative to total GLP-1R cells) is about 20% (right). (G) Experimental paradigm for optogenetic stimulation of GLP-1R terminals in the DMV in GLP-1R-Cre mice. t = 0, prestimulation, t = 30, during stimulation, t = 60, post-stimulation. (H) Fasting blood glucose level is significantly decreased after exposure to blue light in AAV-DIO-ChR2-YFP–infected GLP-1R-Cre mice when compared to the control group (AAV-DIO-YFP–infected GLP-1R-Cre mice). ***P < 0.001 (ANOVA test). (I) Experimental paradigm for Exn4 injection in DMH of WT mice. (J) Fasting plasma insulin level increased 0.5 hours after Exn4 injection. ***P < 0.001 (t test). (K) Experimental paradigm for viral injection in DMH of GLP-1R-Cre mice. (L) Activation of GLP-1R neurons in the DMH increased fasting plasma insulin levels 1 hour after intraperitoneal injection of hM3Dq-specific agonist, CNO. *P < 0.05 (t test). (M) Experimental paradigm for viral injection of AAV-Cre in GLP1Rf/f mice. (N) Plasma insulin levels are significantly lower in GLP-1R knockdown group than in control group. *P < 0.05 (t test). n numbers are indicated in each panel.
Fig. 7.
Fig. 7.. Cross-talk between central GLP-1 signal and pancreas mediates glucose-lowering effects.
(A) Descending controls of NTSGLP-1–DMHGLP-1R–DMV–pancreas activity affect glucose level. (B) GLP-1 binding to GLP-1R increases intracellular cAMP levels, followed by suppression of voltage-gated potassium currents, inducing a depolarization of the postsynaptic neuron.

References

    1. Bell G. I., Sanchez-Pescador R., Laybourn P. J., Najarian R. C., Exon duplication and divergence in the human preproglucagon gene. Nature 304, 368–371 (1983). - PubMed
    1. Drucker D. J., Glucagon and the glucagon-like peptides. Pancreas 5, 484–488 (1990). - PubMed
    1. Drucker D. J., Mechanisms of action and therapeutic application of glucagon-like peptide-1. Cell Metab. 27, 740–756 (2018). - PubMed
    1. Drucker D. J., Habener J. F., Holst J. J., Discovery, characterization, and clinical development of the glucagon-like peptides. J. Clin. Invest. 127, 4217–4227 (2017). - PMC - PubMed
    1. Müller T. D., Finan B., Bloom S. R., D’Alessio D., Drucker D. J., Flatt P. R., Fritsche A., Gribble F., Grill H. J., Habener J. F., Holst J. J., Langhans W., Meier J. J., Nauck M. A., Perez-Tilve D., Pocai A., Reimann F., Sandoval D. A., Schwartz T. W., Seeley R. J., Stemmer K., Tang-Christensen M., Woods S. C., Di Marchi R. D., Tschöp M. H., Glucagon-like peptide 1 (GLP-1). Mol. Metab. 30, 72–130 (2019). - PMC - PubMed

Publication types

MeSH terms

LinkOut - more resources