. 2022 Jun 10;8(23):eabm4560.
doi: 10.1126/sciadv.abm4560. Epub 2022 Jun 8.

Cav1.3 calcium channels are full-range linear amplifiers of firing frequencies in lateral DA SN neurons

Affiliations

Cav1.3 calcium channels are full-range linear amplifiers of firing frequencies in lateral DA SN neurons

Josef Shin et al. Sci Adv. .

Abstract

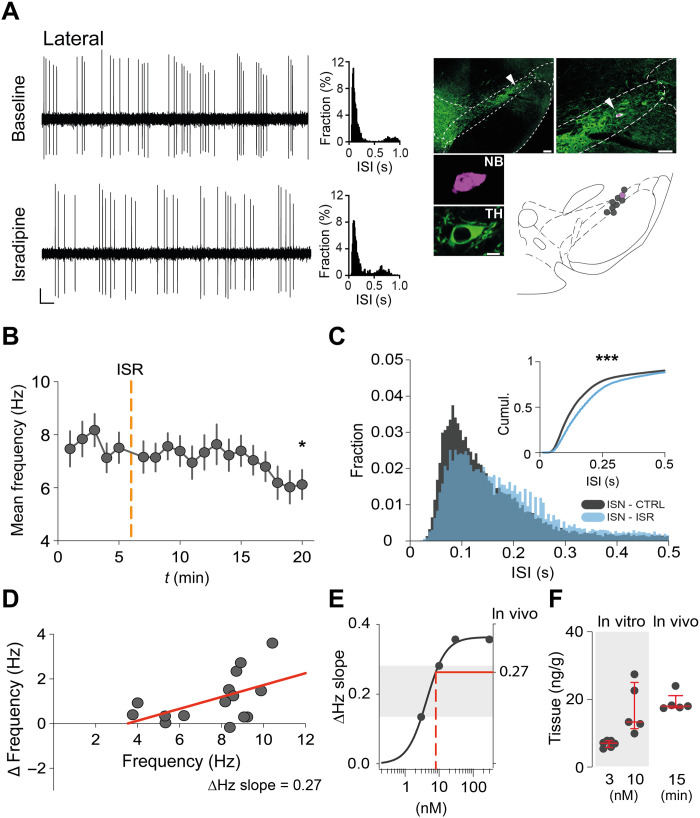
The low-threshold L-type calcium channel Cav1.3 accelerates the pacemaker rate in the heart, but its functional role for the extended dynamic range of neuronal firing is still unresolved. Here, we show that Cav1.3 calcium channels act as unexpectedly simple, full-range linear amplifiers of firing rates for lateral dopamine substantia nigra (DA SN) neurons in mice. This means that they boost in vitro or in vivo firing frequencies between 2 and 50 hertz by about 30%. Furthermore, we demonstrate that clinically relevant, low nanomolar concentrations of the L-type channel inhibitor isradipine selectively reduce the in vivo firing activity of these nigrostriatal DA SN neurons at therapeutic plasma concentrations. Thus, our study identifies the pacemaker function of neuronal Cav1.3 channels and provides direct evidence that repurposing dihydropyridines such as isradipine is feasible to selectively modulate the in vivo activity of highly vulnerable DA SN subpopulations in Parkinson's disease.


Figures

Fig. 1.
Fig. 1.. Cav1.3 channels are linear amplifiers of autonomous pacemaking in DA SN neurons.
(A) Multiple approaches for monitoring pacemaking (on-cell, whole-cell, dynamic, and perforated patch-clamp recordings). Neurons from adult Cav1.2DHP−/− and WT mice labeled with neurobiotin (NB) and tyrosine hydroxylase (TH) immunohistochemistry (IHC) were anatomically mapped. Dashed lines indicate membrane potential at 0 mV. Scale bars, 20 pA, 500 ms (on-cell); 20 mV, 500 ms (whole-cell); and 20 mV, 500 ms (perforated). (B) Left: Representative example of a perforated patch clamp–recorded DA SN neuron before and after wash in ISR (300 nM). Neuron was NB-labeled, TH-positive, and localized in the SN (white arrowheads). Scale bars, 10 mV, 500 ms (perforated) and 100 and 10 μm (histology). Right: Example DA SN neuron responding to ISR with reduction in pacemaker frequency. Note different baseline frequencies (2.9 Hz versus 1.8 Hz). Scale bars, 5 mV, 500 ms (perforated); and 100 and 10 μm (histology). (C) Left: Frequencies over time for DA SN neurons in Cav1.2DHP−/− mice. Dashed line marks the presence of ISR (t > 4 min). Right: Frequencies at baseline (BSL) and in isradipine (ISR). Representative examples marked with blue and orange circle, respectively. (D) Scatter plot showing the distribution of ISR-induced reduction of firing frequencies (Δfrequency = BSL − ISR) and corresponding baseline frequencies. A linear regression was fitted to represent the distribution (red line). (E) CV % at baseline and in ISR. (F to H) Data are presented as in (C) to (E) for control recordings in Cav1.2DHP−/− mice. ***P < 0.001. See table S2 for statistical analysis and n numbers. ns, not significant.
Fig. 2.
Fig. 2.. Cav1.3 channel acting as linear amplifier predicts firing rate changes in ISR, independent of somatodendritic D2 AR or Cav1.2 channels.
(A) Regular pacemaking was first monitored in the on-cell (top) followed by the whole-cell recording mode (bottom). Note the stability in pacemaking frequency and regularity in both modes. Recorded DA SN neurons were labeled and histologically verified. Dashed line indicates membrane potential at 0 mV. Scale bars, 20 pA, 500 ms (on-cell); 20 mV, 500 ms (whole-cell); and 100 and 10 μm (histology). Midbrain slices were preincubated with ISR (30 or 300 nM) for over 10 min before each experiment (right). Scale bars, 20 pA, 500 ms (on-cell); 20 mV, 500 ms (whole-cell); and 100 and 10 μm (histology). (B) Top: Scatter plot of control, predicted, and ISR-dependent frequencies. Experiments were performed in WT mice. Middle: Frequency histograms of the respective distribution were fitted with a Gaussian function. Bottom: A left shift in the cumulative distribution marks the reduction in frequency. Note that the cumulative distribution for discharge rate in the presence of ISR is very similar to the predicted cumulative distribution. (C) Data for Cav1.2DHP−/− mice are presented as in (B). (D) Data for Cav1.2DHP−/− mice with D2 AR inhibition are presented as in (B). All data are means ± SEM. **P < 0.01, ***P < 0.001. See table S2 for statistical analysis and n numbers.
Fig. 3.
Fig. 3.. Linear amplification of firing across the entire frequency range in lateral DA SN neurons.
(A) Somatic NMDA conductances (gNMDA) applied for expansion of in vitro firing range in DA SN neurons (WT mice) recorded in the whole-cell configuration. Red line shows current injection for gNMDA = 16 nS. Dashed line indicates membrane potential at 0 mV. Bottom: Magnification of first three ISIs. Scale bars, 250 pA, 500 ms (top); 10 mV, 500 ms (middle); and 20 mV, 25 ms (bottom). (B) Scatter plot of mean frequencies averaged across the first three ISIs versus gNMDA (f-g distribution). (C) Representative traces of class I (blue) and II (red) based on hierarchical clustering. Right: Rows represent individual neurons ordered according to PCs. Scale bar, 20 mV, 25 ms. (D) Distribution of class I and II neurons across SN. (E) Firing distribution of medial DA SN neurons in control and in the presence of ISR (300 nM). (F) Scatter plot of Δfrequency (= mean CTRL − ISR) and CTRL frequency (in hertz) for medial DA SN neurons. Linear regression line (red line) represents predicted Δfrequency. (G) Data are presented as in (E) for lateral DA SN neurons. (H) Data are presented as in (F) for lateral DA SN neurons. (I) f-g curves of lateral DA SN neurons in the absence (control) or presence of 3, 10, 30, and 300 nM ISR. ISR (10, 30, and 300 nM) caused significant inhibition of frequency versus control at all gNMDA intensities [repeated-measures two-way analysis of variance (ANOVA), Tukey’s multiple comparisons test]. (J) Gradual decrease in ΔHz slope with clinically relevant low nanomolar concentrations of ISR. Slopes were significantly different from zero and from each other (except 30 from 300 nM ISR). All data are means ± SEM. See table S2 for statistical analysis and n numbers.
Fig. 4.
Fig. 4.. ISR (10 nM) reduces in vivo firing frequencies in lateral DA SN neurons.
(A) Left: Representative trace of a lateral DA SN neuron before and after intraperitoneally injecting ISR (3 mg/kg). Note the suppression of firing activity after administration of systemic ISR. Middle: Normalized histograms of ISIs at baseline and in ISR (5 min before and last 5 min after ISR injection, respectively). Right: Recorded neuron was juxtacellularly labeled with NB for histological verification and localization in the SN. Scale bars, 0.2 mV, 500 ms (extracellular recording); and 100, 50, and 10 μm (histology). (B) Progression of mean frequency during 20 min of recorded firing activity. Orange dashed line (t = 6 min) marks injection of ISR. n = 15, N = 15 (C) Overlay of ISI histograms at baseline (5 min before injection) and in ISR (10 to 15 min after injection). Inset: Cumulative distributions of the ISI histograms. For better visualization, only ISIs of <0.5 s are depicted. (D) Distribution of Δfrequency and baseline frequency (in hertz) for each DA SN neuron. A linear regression line with a slope of 0.27 was fitted (red line). (E) A concentration-response curve with ΔHz slopes plotted against the indicated ISR concentrations (see Fig. 3). A ΔHz slope of 0.27 (horizontal, red line) predicts an effective concentration of ISR at around 8 nM (vertical, red dashed line). (F) Tissue concentrations in acutely prepared midbrain slices after preincubation in 3 or 10 nM ISR, respectively, were compared with tissue concentrations of midbrains 15 min after systemic application of ISR (3 mg/kg). All data are means ± SEM. *P < 0.05, ***P < 0.001. See table S2 for statistical analysis and n numbers.
Fig. 5.
Fig. 5.. ISR (10 nM) does not affect in vivo firing properties of medial DA SN neurons.
(A) Left: Representative traces of a medial DA SN neuron before and after intraperitoneally injecting ISR (3 mg/kg). Middle: Normalized ISI histograms. Right: Target neuron was juxtacellulary labeled, histologically verified, and localized in the SN. Scale bar, 0.2 mV, 500 ms (extracellular recording); and 100, 50, and 10 μm (histology). (B) Progression of mean frequency during 20 min of recorded firing activity. Orange dashed line (t = 6 min) mark injection of ISR. (C) Overlay of ISI histograms at baseline and in ISR. Inset: Cumulative distributions of the ISI histograms. For better visualization, only ISIs of <0.5 s are depicted. Note that while statistical significance is met using a two-sample Kolmogorov-Smirnov test, the absolute shift at cumulative probability = 0.5 is <1 ms (see table S2 for test statistics). (D) Distribution of Δfrequency and baseline frequency (in hertz) for each DA SN neuron. All data are means ± SEM. ***P < 0.001. See table S2 for statistical analysis and n numbers.

References

    1. Brandt A., Striessnig J., Moser T., CaV1.3 channels are essential for development and presynaptic activity of cochlear inner hair cells. J. Neurosci. 23, 10832–10840 (2003). - PMC - PubMed
    1. Mangoni M. E., Couette B., Bourinet E., Platzer J., Reimer D., Striessnig J., Nargeot J., Functional role of L-type Cav1.3 Ca2+ channels in cardiac pacemaker activity. Proc. Natl. Acad. Sci. U.S.A. 100, 5543–5548 (2003). - PMC - PubMed
    1. Berger S. M., Bartsch D., The role of L-type voltage-gated calcium channels Cav1.2 and Cav1.3 in normal and pathological brain function. Cell Tissue Res. 357, 463–476 (2014). - PubMed
    1. Striessnig J., Koschak A., Sinnegger-Brauns M. J., Hetzenauer A., Nguyen N. K., Busquet P., Pelster G., Singewald N., Role of voltage-gated L-type Ca2+ channel isoforms for brain function. Biochem. Soc. Trans. 34, 903–909 (2006). - PubMed
    1. ElBasiouny S. M., Schuster J. E., Heckman C. J., Persistent inward currents in spinal motoneurons: Important for normal function but potentially harmful after spinal cord injury and in amyotrophic lateral sclerosis. Clin. Neurophysiol. 121, 1669–1679 (2010). - PMC - PubMed