. 2022 Jun 10;8(23):eabm6340.
doi: 10.1126/sciadv.abm6340. Epub 2022 Jun 8.

Neural network learning defines glioblastoma features to be of neural crest perivascular or radial glia lineages

Affiliations

Neural network learning defines glioblastoma features to be of neural crest perivascular or radial glia lineages

Yizhou Hu et al. Sci Adv. .

Abstract

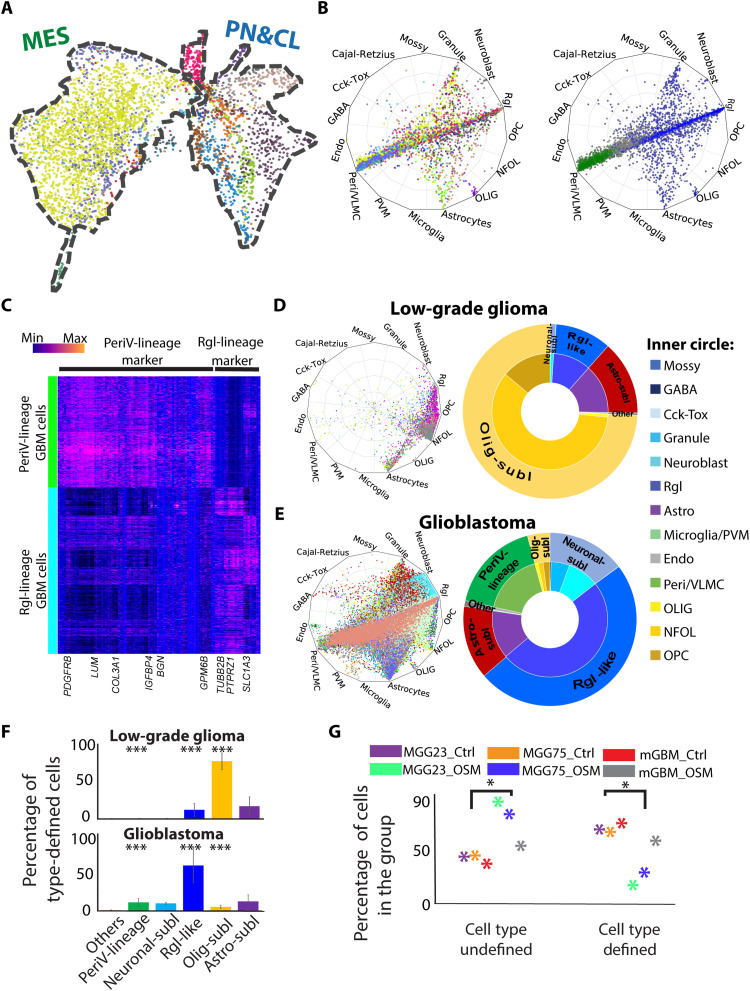
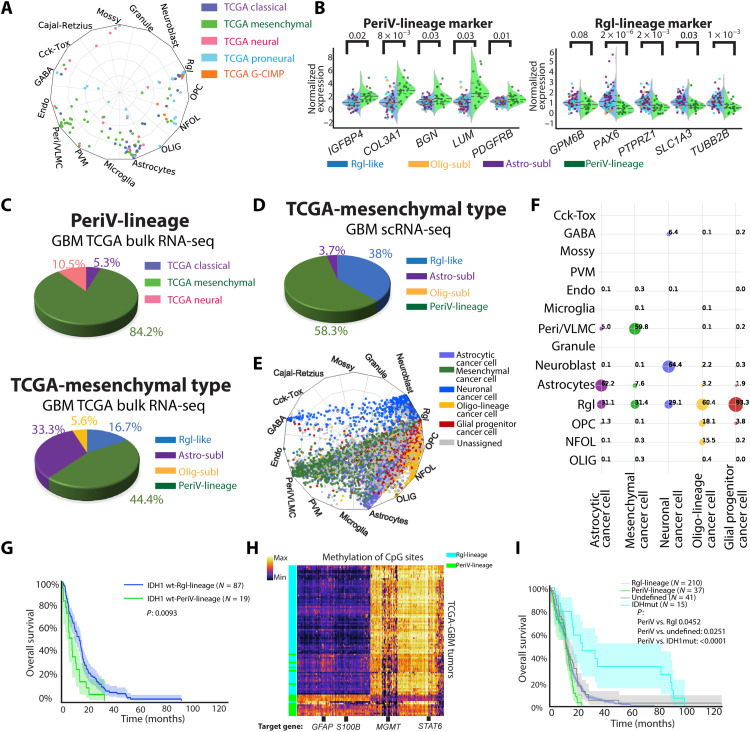
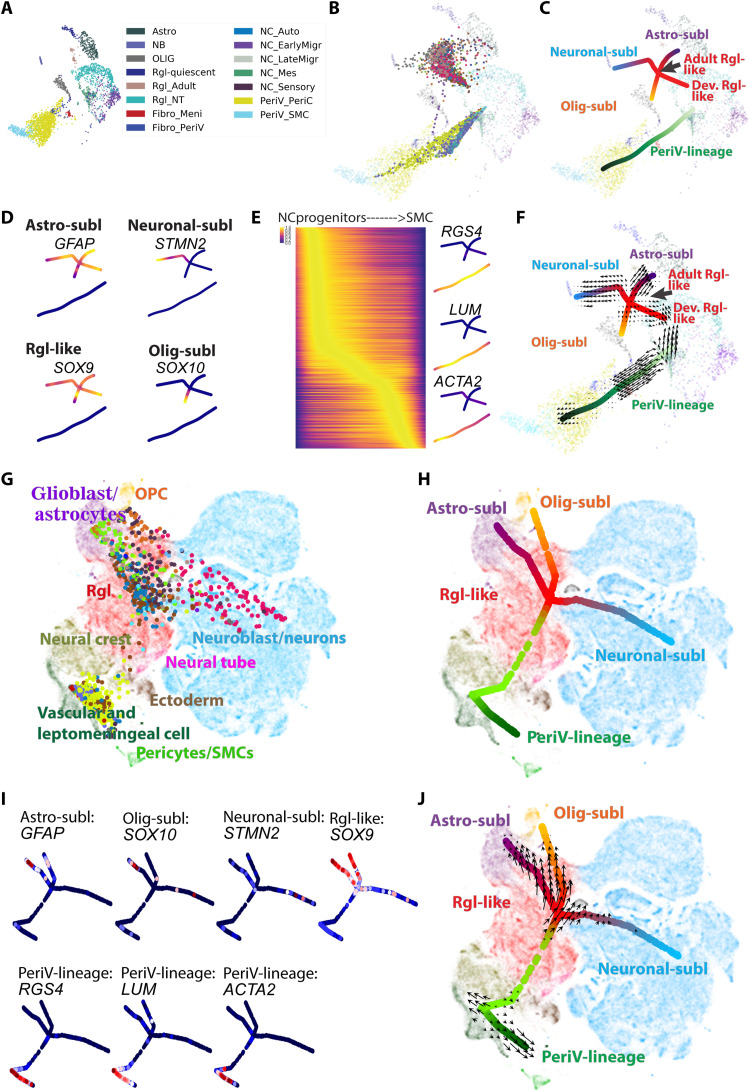
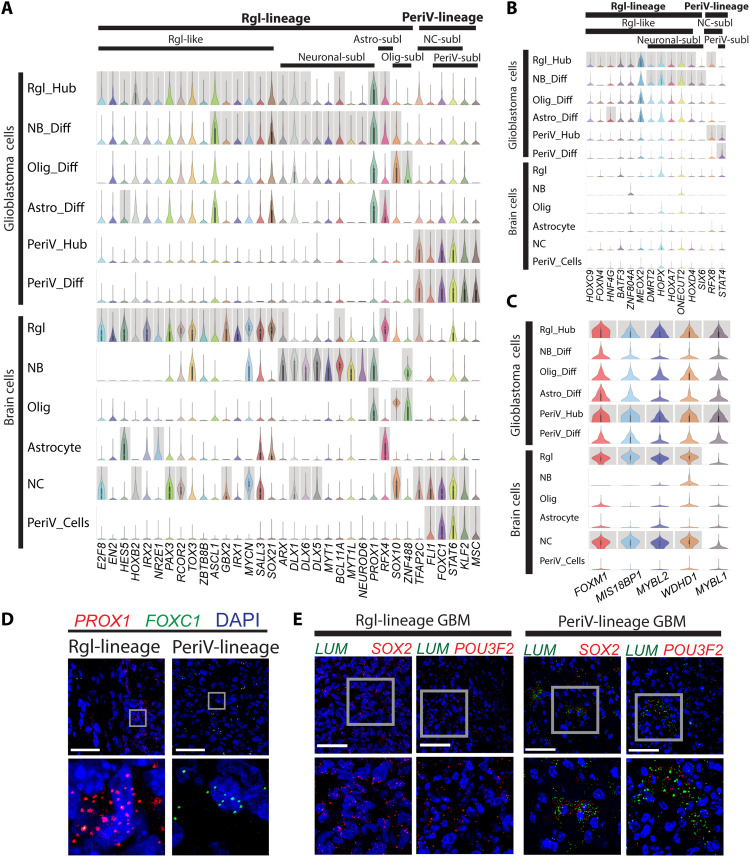
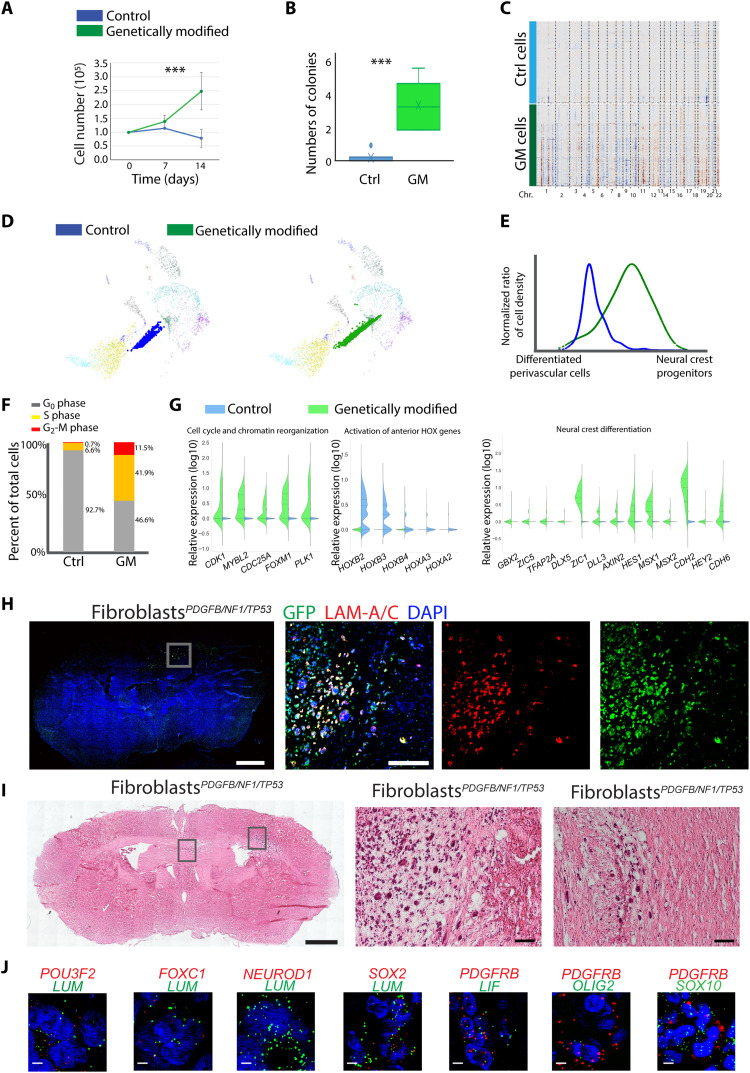
Glioblastoma is believed to originate from nervous system cells; however, a putative origin from vessel-associated progenitor cells has not been considered. We deeply single-cell RNA-sequenced glioblastoma progenitor cells of 18 patients and integrated 710 bulk tumors and 73,495 glioma single cells of 100 patients to determine the relation of glioblastoma cells to normal brain cell types. A novel neural network-based projection of the developmental trajectory of normal brain cells uncovered two principal cell-lineage features of glioblastoma, neural crest perivascular and radial glia, carrying defining methylation patterns and survival differences. Consistently, introducing tumorigenic alterations in naïve human brain perivascular cells resulted in brain tumors. Thus, our results suggest that glioblastoma can arise from the brains' vasculature, and patients with such glioblastoma have a significantly poorer outcome.


Figures

Fig. 1.
Fig. 1.. Cell-type assignment of high- and low-grade glioma revealed that perivascular lineage tumor cells are present only in high-grade glioma.
(A) UMAP visualization of patient-derived glioblastoma cells. Color coding based on cell clusters. The contours of two main clouds of cells outlined with a dashed line and labeled with TCGA subtypes on the top. CL, classical; MES, mesenchymal; PN, proneural. (B) Radar plot visualization of the cell-type scores of glioblastoma cells in relation to the trained reference brain cell types. Color coding based on cell clusters (left) or cell-type lineages (right, blue: Rgl-lineage; green, PeriV-lineage). The position of each dot indicates the cell-type score between that cell and the trained reference cell types, which are indicated outside each wheel bend. Abbreviations are as in fig. S1F. (C) Heatmap of differential gene expression between PeriV-lineage and Rgl-lineage glioblastoma cells. Selected gene symbols are at the bottom. Color bar indicates the expression intensity at the top left. (D and E) Left: Radar plots show the cell-type scores of low-grade glioma and glioblastoma cells in relation to the trained reference brain cell types. Right: Donut charts show the quantitative distribution of cell type–defined glioblastoma cells. The inner donut layer represents the reference cell types that tumor cells are assigned to, and the outer layer represents the normal cell-type lineages. (F) The distribution of low-grade glioma and glioblastoma cells to defined reference cell-type lineages. ***P < 0.001. (G) Scatter chart represents the significant cell-type score of control (Ctrl) and oncostatin M (OSM)–treated glioblastoma multiforme (GBM) cells against each defined reference brain cell type. “Cell type defined” represents glioblastoma cells with high cell-type scores above the cutoff, and “cell type undefined” represents cells with low scores. Dot colors are indicated at the top. *P < 0.05.
Fig. 2.
Fig. 2.. Tumor subtype assignment, methylation status, and survival of deconvoluted bulk tumor data from TCGA/DFKN.
(A) Radar plot visualizes the cell-type scores for deconvoluted bulk glioblastoma in relation to trained reference brain cell types. Colors represent the TCGA-defined subtype of each tumor. (B) Violin swarm plot of the original gene expression of selected marker genes in the PeriV-lineage and Rgl-lineage of TCGA glioblastoma; blue background represents Rgl-lineage tumors and green background represents PeriV-lineage tumors. Dot colors represent the defined reference brain cell types of each tumor in (A). The dashed line in each violin plot represents the distribution quartiles. P value of Student’s t test on top. Abbreviations are as in fig. S2C. (C and D) Pie plots representing the composition of TCGA-classified subtypes in the PeriV-lineage (C, top), cell-type sublineages identified in the TCGA-mes subtype (C, bottom) of bulk glioblastoma, or cell-type sublineages identified in the TCGA-mes subtype of scRNA-seq glioblastoma cells (D). (E) Radar plot visualizes cell-type scores of state-defined glioblastoma cells in relation to trained reference brain cell types. (F) Dot plot represents the percentage of the defined cell states of glioblastoma cells in each originally defined cell-type state. Dot sizes from small to big represent the percentage from low to high. (G) Patient survival of isocitrate dehydrogenase 1 (IDH1) wild-type glioblastoma from the TCGA assigned as belonging to the Rgl-lineage and PeriV-lineage. (H) Heatmap representing the differential methylated site–based hierarchical clustering of the TCGA glioblastomas assigned to the PeriV-lineage and Rgl-lineage type. Selected target genes of the methylated sites are listed at the bottom. Color bar indicates the expression intensity at the top left. STAT6, signal transducer and activator of transcription 6. (I) Patient survival of glioblastoma from TCGA assigned to Rgl-lineage, PeriV-lineage, IDH1-mutant types, and nonclassified based on methylation.
Fig. 3.
Fig. 3.. Relation of glioblastoma cells to the developing central nervous system and neural crest.
(A) Plot of reference cells. UMAP visualization of cell clusters from the developing central nervous system and neural crest lineages (, –35). Abbreviations are as in fig. S3E. (B) Projection of all glioblastoma cells to the reference plot. Reference cells are indicated by “×” and glioblastoma cells are indicated by “dot,” which represent the projected developmental position of the individual glioblastoma cells to native reference cell types. (C) Principal tree plot summarizing the developmental status trajectory of the glioblastoma cells. Lineages are indicated by colors and text. Abbreviations are as in fig. S3M. (D) Visualization of normalized expression in tumor cells of pseudo-time marker genes for branches in the Rgl-lineage. (E) Left: Heatmap shows the normalized expression of pseudo-time genes according to the voltage peak along the neural crest trajectory. Right: Projection of the normalized expression in tumor cells of selected marker genes on the branching tree plot. Dark purple to yellow represents the minimal to maximal expression. (F) Quiver visualization of RNA velocity of glioblastoma cells on the branching tree plot. The arrow of each glioblastoma cell points to the direction of future status, extrapolated from RNA velocity estimates. (G and H) SWAPLINE projection and branching tree visualization of glioblastoma cells onto developmental mouse brain and neural crest reference plot from the mouse developmental brain atlas (16). Abbreviations are as in fig. S4J. (I) Marker gene expression in glioblastoma cells and visualized in the branching tree projected on the reference developmental mouse brain plot. Dark blue to red represents the minimal to maximal gene expression. Abbreviations are as in fig. S4J. (J) Quiver visualization of RNA velocity of glioblastoma cells onto developmental mouse brain and neural crest reference plot.
Fig. 4.
Fig. 4.. Conserved TF signatures between naïve brain and neural crest cells with Rgl- and PeriV-lineage glioblastoma.
(A to C) Violin plot of TF expression shared between tumor cells and normal reference cell types (A), of TFs unique to glioblastoma cells (B), and of TFs shared between Rgl- and PeriV-lineage glioblastoma cells (C). y axis, the relative expression level; x axis, TF gene names. Cell types and lineages are indicated at the top of the chart. Gray columns represent the significantly differential expression. “Diff” indicates tumor cells at the distal differentiation of the sublineage trajectories and “Hub” indicates stem-like cells of the Rgl and perivascular lineages corresponding to native radial glia and neural crest cells, respectively. (D and E) Validation of PROX1 and FOXC1 mRNA expression in Rgl-lineage– and PeriV-lineage–type patient-derived glioblastoma xenografts, respectively (D). Validation of SOX2 and POU3F2 mRNA expression in both PeriV-lineage–type and Rgl-lineage–type patient-derived glioblastoma xenografts, LUM was used as a marker of PeriV-lineage tumor (E). Tumor lineage type and gene names are at the top. Each bottom figure is a higher magnification from the gray frame of the top figure. Scale bars, 50 μm.
Fig. 5.
Fig. 5.. In vivo initiation of tumors from perivascular cells.
(A and B) In vitro proliferation (A) and colony formation (B) of brain vFB with/without carrying genetic alterations of patient-derived glioblastoma [genetically modified (GM), green]. Means ± SD, three independent measurements. Student’s t test, ***P < 0.001. (C) CNV analysis of control (blue) and GM fibroblasts (green). (D) Projection of control and genetic modified fibroblasts to the reference plot of normal reference cell types from Fig. 3A. (E) Quantification of the differentiation status of control (blue) and GM fibroblasts (green) along the developmental trajectory of in vivo differentiation of reference perivascular cells. The y axis represents the normalized cell density of projected fibroblasts in (D). The x axis represents the linearized developmental position between differentiated brain perivascular cells and neural crest progenitors. (F) Quantification of cycling phases of control (Ctrl) and GM fibroblasts. (G) Gene expression of top significant pathways enriched by up- and down-regulated genes in GM fibroblasts as compared to the naïve fibroblasts. (H and I) Representative fluorescence (H) or hematoxylin and eosin (I) staining of the coronal section from mouse xenograft of GM fibroblasts. Magnified tumor regions boxed. Green, GFP; red, anti-human lamin (LAM) A/C; blue, 4′,6-diamidino-2-phenylindole (DAPI). Scale bars (H and I): 1000 μm, whole section; 100 μm, magnified figures. (J) In vivo mRNA expression of indicated marker genes in xenograft tumor tissues of genetic modified fibroblasts. Human LUM and PDGFRB were used to label tumor cells. Gene names and color are indicated in each panel. Scale bars, 10 μm.

References

    1. Dunn G. P., Rinne M. L., Wykosky J., Genovese G., Quayle S. N., Dunn I. F., Agarwalla P. K., Chheda M. G., Campos B., Wang A., Brennan C., Ligon K. L., Furnari F., Cavenee W. K., Depinho R. A., Chin L., Hahn W. C., Emerging insights into the molecular and cellular basis of glioblastoma. Genes Dev. 26, 756–784 (2012). - PMC - PubMed
    1. Brennan C. W., Verhaak R. G. W., McKenna A., Campos B., Noushmehr H., Salama S. R., Zheng S., Chakravarty D., Sanborn J. Z., Berman S. H., Beroukhim R., Bernard B., Wu C. J., Genovese G., Shmulevich I., Barnholtz-Sloan J., Zou L., Vegesna R., Shukla S. A., Ciriello G., Yung W. K., Zhang W., Sougnez C., Mikkelsen T., Aldape K., Bigner D. D., van Meir E. G., Prados M., Sloan A., Black K. L., Eschbacher J., Finocchiaro G., Friedman W., Andrews D. W., Guha A., Iacocca M., O’Neill B. P., Foltz G., Myers J., Weisenberger D. J., Penny R., Kucherlapati R., Perou C. M., Hayes D. N., Gibbs R., Marra M., Mills G. B., Lander E., Spellman P., Wilson R., Sander C., Weinstein J., Meyerson M., Gabriel S., Laird P. W., Haussler D., Getz G., Chin L., Benz C., Barnholtz-Sloan J., Barrett W., Ostrom Q., Wolinsky Y., Black K. L., Bose B., Boulos P. T., Boulos M., Brown J., Czerinski C., Eppley M., Iacocca M., Kempista T., Kitko T., Koyfman Y., Rabeno B., Rastogi P., Sugarman M., Swanson P., Yalamanchii K., Otey I. P., Liu Y. S., Xiao Y., Auman J. T., Chen P. C., Hadjipanayis A., Lee E., Lee S., Park P. J., Seidman J., Yang L., Kucherlapati R., Kalkanis S., Mikkelsen T., Poisson L. M., Raghunathan A., Scarpace L., Bernard B., Bressler R., Eakin A., Iype L., Kreisberg R. B., Leinonen K., Reynolds S., Rovira H., Thorsson V., Shmulevich I., Annala M. J., Penny R., Paulauskis J., Curley E., Hatfield M., Mallery D., Morris S., Shelton T., Shelton C., Sherman M., Yena P., Cuppini L., DiMeco F., Eoli M., Finocchiaro G., Maderna E., Pollo B., Saini M., Balu S., Hoadley K. A., Li L., Miller C. R., Shi Y., Topal M. D., Wu J., Dunn G., Giannini C., O’Neill B. P., Aksoy B. A., Antipin Y., Borsu L., Berman S. H., Brennan C. W., Cerami E., Chakravarty D., Ciriello G., Gao J., Gross B., Jacobsen A., Ladanyi M., Lash A., Liang Y., Reva B., Sander C., Schultz N., Shen R., Socci N. D., Viale A., Ferguson M. L., Chen Q. R., Demchok J. A., Dillon L. A. L., Shaw K. R. M., Sheth M., Tarnuzzer R., Wang Z., Yang L., Davidsen T., Guyer M. S., Ozenberger B. A., Sofia H. J., Bergsten J., Eckman J., Harr J., Myers J., Smith C., Tucker K., Winemiller C., Zach L. A., Ljubimova J. Y., Eley G., Ayala B., Jensen M. A., Kahn A., Pihl T. D., Pot D. A., Wan Y., Eschbacher J., Foltz G., Hansen N., Hothi P., Lin B., Shah N., Yoon J. G., Lau C., Berens M., Ardlie K., Beroukhim R., Carter S. L., Cherniack A. D., Noble M., Cho J., Cibulskis K., DiCara D., Frazer S., Gabriel S. B., Gehlenborg N., Gentry J., Heiman D., Kim J., Jing R., Lander E. S., Lawrence M., Lin P., Mallard W., Meyerson M., Onofrio R. C., Saksena G., Schumacher S., Sougnez C., Stojanov P., Tabak B., Voet D., Zhang H., Zou L., Getz G., Dees N. N., Ding L., Fulton L. L., Fulton R. S., Kanchi K. L., Mardis E. R., Wilson R. K., Baylin S. B., Andrews D. W., Harshyne L., Cohen M. L., Devine K., Sloan A. E., VandenBerg S. R., Berger M. S., Prados M., Carlin D., Craft B., Ellrott K., Goldman M., Goldstein T., Grifford M., Haussler D., Ma S., Ng S., Salama S. R., Sanborn J. Z., Stuart J., Swatloski T., Waltman P., Zhu J., Foss R., Frentzen B., Friedman W., McTiernan R., Yachnis A., Hayes D. N., Perou C. M., Zheng S., Vegesna R., Mao Y., Akbani R., Aldape K., Bogler O., Fuller G. N., Liu W., Liu Y., Lu Y., Mills G., Protopopov A., Ren X., Sun Y., Wu C. J., Yung W. K. A., Zhang W., Zhang J., Chen K., Weinstein J. N., Chin L., Verhaak R. G. W., Noushmehr H., Weisenberger D. J., Bootwalla M. S., Lai P. H., Triche T. J. Jr., van den Berg D. J., Laird P. W., Gutmann D. H., Lehman N. L., VanMeir E. G., Brat D., Olson J. J., Mastrogianakis G. M., Devi N. S., Zhang Z., Bigner D., Lipp E., McLendon R., The somatic genomic landscape of glioblastoma. Cell 155, 462–477 (2013). - PMC - PubMed
    1. Sturm D., Witt H., Hovestadt V., Khuong-Quang D. A., Jones D. T. W., Konermann C., Pfaff E., Tönjes M., Sill M., Bender S., Kool M., Zapatka M., Becker N., Zucknick M., Hielscher T., Liu X. Y., Fontebasso A. M., Ryzhova M., Albrecht S., Jacob K., Wolter M., Ebinger M., Schuhmann M. U., van Meter T., Frühwald M. C., Hauch H., Pekrun A., Radlwimmer B., Niehues T., von Komorowski G., Dürken M., Kulozik A. E., Madden J., Donson A., Foreman N. K., Drissi R., Fouladi M., Scheurlen W., von Deimling A., Monoranu C., Roggendorf W., Herold-Mende C., Unterberg A., Kramm C. M., Felsberg J., Hartmann C., Wiestler B., Wick W., Milde T., Witt O., Lindroth A. M., Schwartzentruber J., Faury D., Fleming A., Zakrzewska M., Liberski P. P., Zakrzewski K., Hauser P., Garami M., Klekner A., Bognar L., Morrissy S., Cavalli F., Taylor M. D., van Sluis P., Koster J., Versteeg R., Volckmann R., Mikkelsen T., Aldape K., Reifenberger G., Collins V. P., Majewski J., Korshunov A., Lichter P., Plass C., Jabado N., Pfister S. M., Hotspot mutations in H3F3A and IDH1 define distinct epigenetic and biological subgroups of glioblastoma. Cancer Cell 22, 425–437 (2012). - PubMed
    1. Wang Q., Hu B., Hu X., Kim H., Squatrito M., Scarpace L., deCarvalho A. C., Lyu S., Li P., Li Y., Barthel F., Cho H. J., Lin Y.-H., Satani N., Martinez-Ledesma E., Zheng S., Chang E., Sauvé C.-E. G., Olar A., Lan Z. D., Finocchiaro G., Phillips J. J., Berger M. S., Gabrusiewicz K. R., Wang G., Eskilsson E., Hu J., Mikkelsen T., De Pinho R. A., Muller F., Heimberger A. B., Sulman E. P., Nam D.-H., Verhaak R. G. W., Tumor evolution of glioma-intrinsic gene expression subtypes associates with immunological changes in the microenvironment. Cancer Cell 32, 42–56.e6 (2017). - PMC - PubMed
    1. Neftel C., Laffy J., Filbin M. G., Hara T., Shore M. E., Rahme G. J., Richman A. R., Silverbush D., Shaw M. L., Hebert C. M., Dewitt J., Gritsch S., Perez E. M., Castro L. N. G., Lan X., Druck N., Rodman C., Dionne D., Kaplan A., Bertalan M. S., Small J., Pelton K., Becker S., Bonal D., Nguyen Q.-D., Servis R. L., Fung J. M., Mylvaganam R., Mayr L., Gojo J., Haberler C., Geyeregger R., Czech T., Slavc I., Nahed B. V., Curry W. T., Carter B. S., Wakimoto H., Brastianos P. K., Batchelor T. T., Stemmer-Rachamimov A., Martinez-Lage M., Frosch M. P., Stamenkovic I., Riggi N., Rheinbay E., Monje M., Rozenblatt-Rosen O., Cahill D. P., Patel A. P., Hunter T., Verma I. M., Ligon K. L., Louis D. N., Regev A., Bernstein B. E., Tirosh I., Suvà M. L., An integrative model of cellular states, plasticity, and genetics for glioblastoma. Cell 178, 835–849.e821 (2019). - PMC - PubMed