. 2022 Jun 22;144(24):10870-10887.
doi: 10.1021/jacs.2c03275. Epub 2022 Jun 8.

Molecular Dynamics Simulations Establish the Molecular Basis for the Broad Allostery Hotspot Distributions in the Tetracycline Repressor

Affiliations

Molecular Dynamics Simulations Establish the Molecular Basis for the Broad Allostery Hotspot Distributions in the Tetracycline Repressor

Yuchen Yuan et al. J Am Chem Soc. .

Abstract

It is imperative to identify the network of residues essential to the allosteric coupling for the purpose of rationally engineering allostery in proteins. Deep mutational scanning analysis has emerged as a function-centric approach for identifying such allostery hotspots in a comprehensive and unbiased fashion, leading to observations that challenge our understanding of allostery at the molecular level. Specifically, a recent deep mutational scanning study of the tetracycline repressor (TetR) revealed an unexpectedly broad distribution of allostery hotspots throughout the protein structure. Using extensive molecular dynamics simulations (up to 50 μs) and free energy computations, we establish the molecular and energetic basis for the strong anticooperativity between the ligand and DNA binding sites. The computed free energy landscapes in different ligation states illustrate that allostery in TetR is well described by a conformational selection model, in which the apo state samples a broad set of conformations, and specific ones are selectively stabilized by either ligand or DNA binding. By examining a range of structural and dynamic properties of residues at both local and global scales, we observe that various analyses capture different subsets of experimentally identified hotspots, suggesting that these residues modulate allostery in distinct ways. These results motivate the development of a thermodynamic model that qualitatively explains the broad distribution of hotspot residues and their distinct features in molecular dynamics simulations. The multifaceted strategy that we establish here for hotspot evaluations and our insights into their mechanistic contributions are useful for modulating protein allostery in mechanistic and engineering studies.


Figures
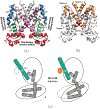
Figure 1:
Figure 1:
Key conformational states of TetR and allostery hotspot distributions from deep mutational scanning analysis. (a) The crystal structure of TetR with bound minocycline and Mg2+ (PDB code: 4AC0). Some key structural elements are highlighted in colors; DNA binding domain (DBD, α1–3): red; the ligand binding domain (LBD) includes several secondary structural elements surrounding the ligand, α4: green, α7: blue, α8: mauve, α6 – α7 linker (l6): orange. The prime (’) sign denotes structural elements in the other monomer. (b) Allosteric hotspots determined in deep mutational scanning experiments. The red and orange colors highlight strong and intermediate hotspots, respectively. They are defined as sites for which at least 50% and 22%, respectively, of mutations abolished induction, and are not in direct contact with the ligand in the crystal structure. As described in Ref. , the hotspot residues are distributed in four regions: region 1 is at the interface of the DBD and LBD on α4 and α6, region 2 is a short motif connecting α7 and α8, region 3 is at the dimer interface consisting of α8, and region 4 is at the C-terminus of α10. (c) A cartoon representation for the putative allostery mechanism of TetR induction,, which involves movements of several helices upon ligand (L) binding that ultimately propagate into the pendulum motion of α4 and reorientation of the DBDs; only one monomer is shown for clarity.
Figure 2:
Figure 2:
Structural parameters relevant to the structural transitions of the DBDs in TetR among different ligation states and their distributions in different MD ensembles. (a) A schematic diagram that illustrates the structural parameters commonly discussed for the structural transitions of the DBDs during induction, including the center-of-mass separation between the two DBDs (DBD distance), the angle between the long principal axes of the two DBDs (DBD twist) and the angle between the α4 during simulations and the reference orientation in the starting structure of the DNA bound state (α4 angle). (b-d) The corresponding probability distributions of these structural parameters. The vertical dashed lines denote the values in the DNA-bound crystal structure.
Figure 3:
Figure 3:
Structural properties of the LBD in TetR. (a) Chemical structure of the ligand. (b) The list of ligand-contacting residues (see text for the selection criterion), which is identical for the two monomers, includes α4: L60, H64; α4 – α5 linker (l4): F67; α5: N82, F86; α6: H100; α6 – α7 linker (l6): T103, R104, P105; α7: Q109, T112, L113, Q116, L117; α8: L131, L134, S135, E147’; α9: I174’, F177’. The side chains and the ligand are shown in licorice; the Mg2+ ion is shown as a pink sphere. (c-d) Representative distributions of pair-wise distances of the ligand-contacting residues identified as those that feature the largest JS divergence values between multi-μs ligand- and DNA-bound simulations; they suggest distinct compactness of the LBD among the ligand-bound, DNA-bound, and apo states. The difference is captured by (c) the distance between α7 and α8’ (represented by the Cα distance between Q109 and E147’); and (d) the distance between l6 and α9’ (represented by the Cα distance between T103 and F177’). More inter-helical or loop-helical distances that characterize the compactness of the ligand-binding site are included in Fig. S5.
Figure 4:
Figure 4:
Computed free energy landscapes for the three ligation states of TetR. The overlay of two-dimensional free energy landscapes for the ligand-bound (grey contour), DNA-bound (brown contour), and apo (green contour) states; individual free energy maps are shown in Fig. S9. Color bars are in the unit of kBT. In all landscapes, the horizontal axis is the first principal component (PC1) and the vertical axis in (a) is the α7 – α8’ distance, and in (b) is the l6-α9’ distance. PC1 mainly reflects the large-amplitude movement of the DBDs, while the inter-helical or helix-loop distances characterize the structural changes in the LBDs. Along both directions, the distributions of the bound states are clearly separated and the apo state ensemble features a broad landscape with multiple basins.
Figure 5:
Figure 5:
Comparison of average structures of different ligation states of TetR. RMSD per residue (in Å) between the ligand-bound state and (a) the apo state, or (b) the DNA-bound state. For both the apo state and the DNA-bound state, larger structural deviation occurs in the DBDs, residues close to the ligand, and some residues at the interface between LBDs and DBDs (e.g., the N-terminus of α4, l6, and the bottom of α8). Note that computed SAXS profiles for the apo and ligand-bound states show good agreement with experimental data (Fig. S12), supporting the validity of our MD ensembles.
Figure 6:
Figure 6:
Comparison of residual contact probabilities between ligand-bound and DNA-bound states of TetR reveals a set of polar residues near the LBD/DBD interface to undergo structural rearrangements and couple changes in the ligand binding sites and the DBDs. Rearrangements of polar interactions (dotted lines) among these residues in (a) the ligand-bound state and (b) the DNA-bound state, along with steric interactions discussed in previous work,, form the basis for the anti-cooperativity between ligand and DNA bindings. Evolution of minimal key polar distances (in Å) during MD simulations are shown for (c) R104–E157’, (d) R104–D178’, (e) E157’–R49, (f) T103–D53, (g) T103–E147’, (h) R158’–D53. At a given time, the minimal hydrogen-bonding distance of all possible protomer combinations is shown for each pair.
Figure 7:
Figure 7:
Dihedral angle comparison between the ligand-bound and the DNA-bound states of TetR. (a-c) Mapping of Jessen-Shannon (JS) divergence of dihedral angle (a: ϕ, b: ψ, and c: χ1) distributions based on multiple μs simulations. The majority of the distributions do not show significant deviations, and large JS divergences are mostly observed at the end of helices or loops, suggesting that the most structural differences are largely rigid-body in nature. (d) Red residues indicate that both the static (Fig. S15) and dynamic differences of at least one of the dihedral angles in these residues rank within the top 50. For the comparison between the apo and ligand-bound states, see Fig. S17.
Figure 8:
Figure 8:
Motional correlations among residues are stronger in the apo state of TetR. (a) Pearson correlation coefficients matrices of (a) the ligand-bound (upper triangle) and the DNA-bound (lower triangle) states; (b) the apo state. Only moderate correlations with absolute values between 0.3 and 0.7 are shown. (c) Residues (in red) that have moderate correlations with the ligand-contacting residues but weak correlations with the DBD residues in the apo state. For a similar analysis of residues with moderate correlations with DNA binding site but weak correlation with ligand-contacting residues, see Fig. S20. (d) Top 50 residues frequently sampled in suboptimal path analysis that connect the LBDs and DBDs in the apo state.
Figure 9:
Figure 9:
An MWC-like model that qualitatively distinguishes two types of allostery hotspots related to the deep mutational scanning analysis of TetR. (a) Both the LBD (L) and DBD (D) can adopt two conformations; the relaxed/inactive conformation is incapable of binding, while the active conformation is binding competent but lies at a higher free energy (ϵL for L and ϵD for D); there is an unfavorable coupling free energy γ that disfavors both domains from adopting the active conformations. The intrinsic binding free energies for the active conformations are indicated as ΔGL and ΔGD in the schematic free energy diagrams in (b-d). A complete description is included in Fig. S23. (b) The qualitative free energy diagram for the WT protein, which generally favors the ligand-bound state as the dominant population (red), is consistent with the induction function of TetR. (c) Mutations of allostery hotspots that control γ lead to the dead (non-inducible) phenotype since the doubly-bound state becomes the dominant population (red). (d) Mutations of allostery hotspots that control ϵL can also lead to the non-inducible phenotype by reducing the binding-competent population of L, resulting in the DNA-bound state as the dominant state (red).

Similar articles

Cited by

References

    1. Monod J; Wyman J; Changeux J-P On the nature of allosteric transitions: a plausible model. J. Mol. Biol 1965, 12, 88–118. - PubMed
    1. Koshland DEJ; Nemethy G; Filmer D Comparison of experimental binding data and theoretical models in proteins containing subunits. Biochem. 1966, 5, 365–385. - PubMed
    1. Alberts B; Bray D; Lewis J; Raff M; Roberts K; Watson JD Molecular biology of the cell; Garland Publishing, Inc., 1994.
    1. Yu EW; Koshland DEJ Propagating conformational changes over long (and short) distances in proteins. Proc. Natl. Acad. Sci. U.S.A 2001, 98, 9517–9520. - PMC - PubMed
    1. Changeux J-P; Edelstein SJ Allosteric mechanisms of signal transduction. Science 2005, 308, 1424–1428. - PubMed

Publication types