. 2022 Jun 14;39(11):110952.
doi: 10.1016/j.celrep.2022.110952. Epub 2022 May 27.

Broadly recognized, cross-reactive SARS-CoV-2 CD4 T cell epitopes are highly conserved across human coronaviruses and presented by common HLA alleles

Affiliations

Broadly recognized, cross-reactive SARS-CoV-2 CD4 T cell epitopes are highly conserved across human coronaviruses and presented by common HLA alleles

Aniuska Becerra-Artiles et al. Cell Rep. .

Abstract

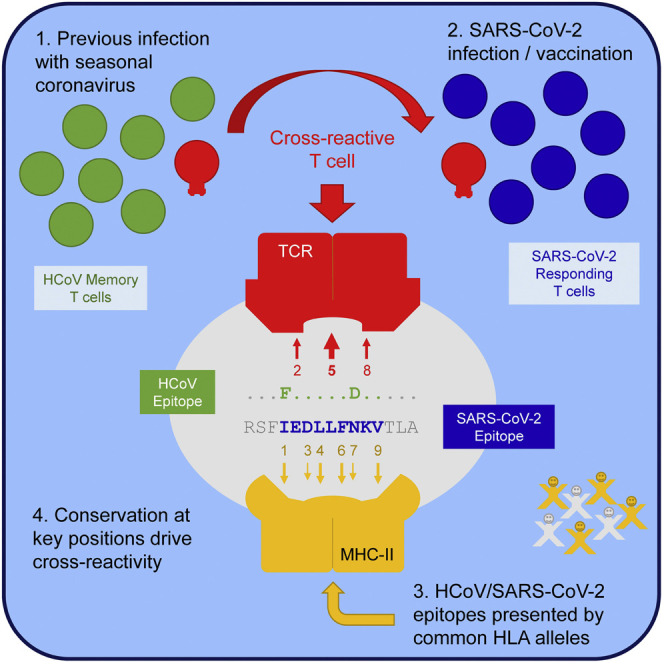
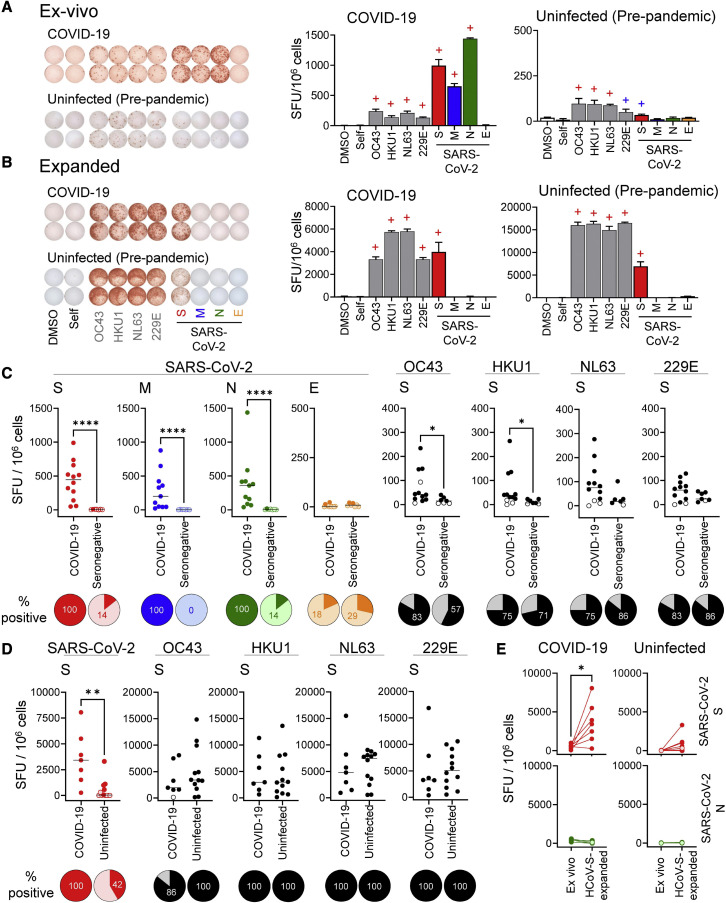
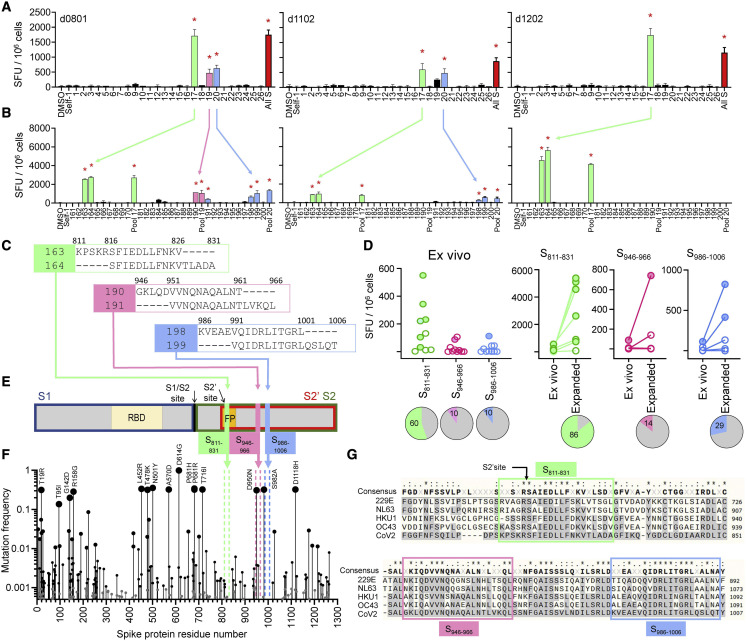
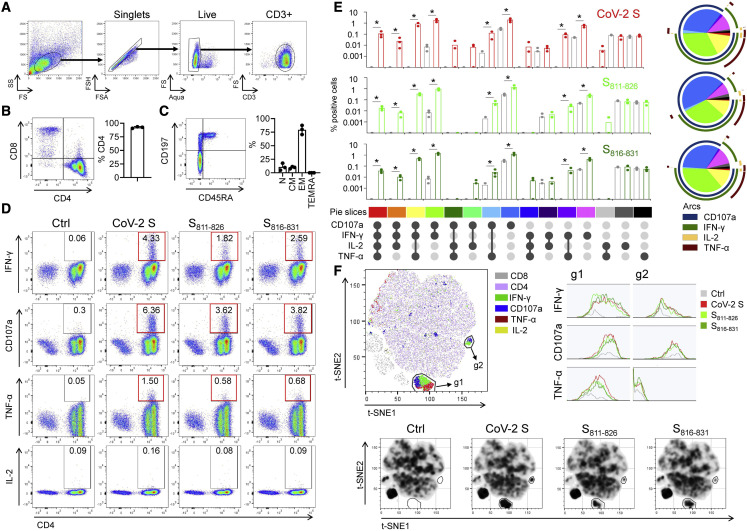
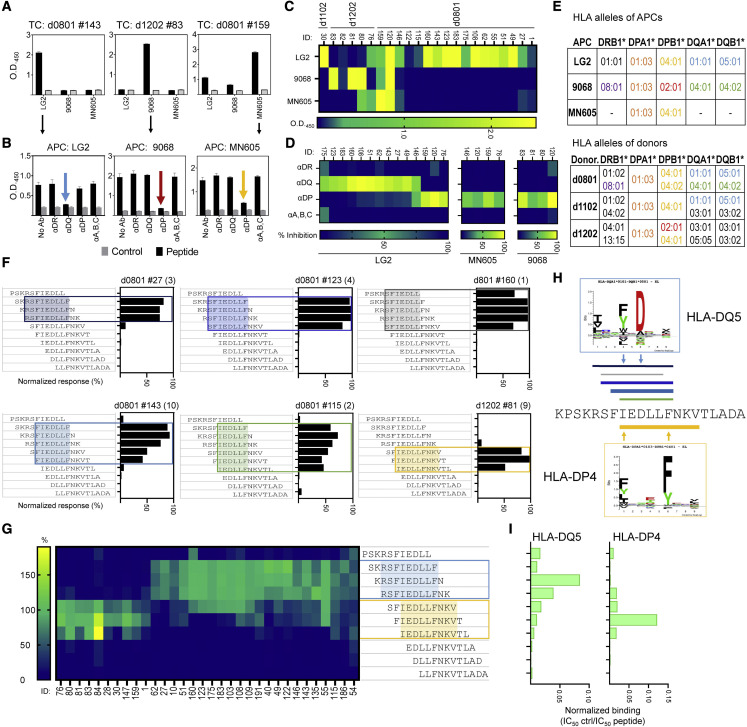
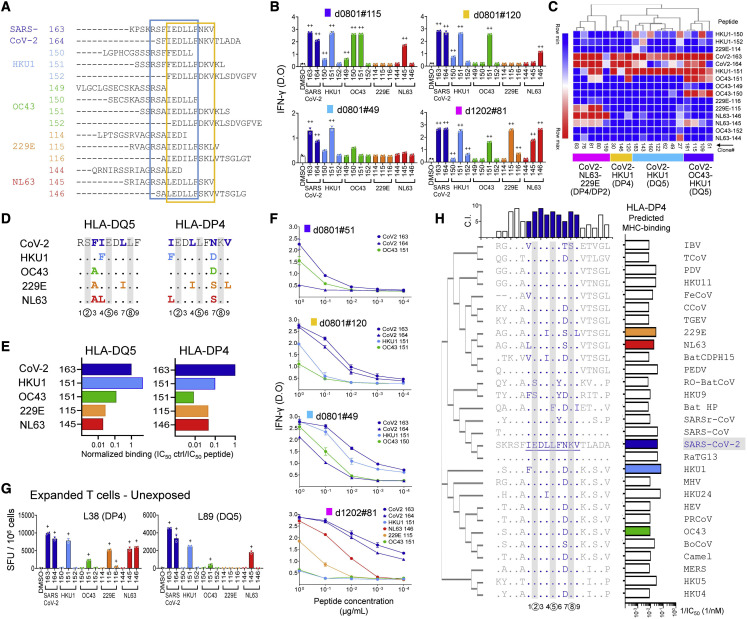
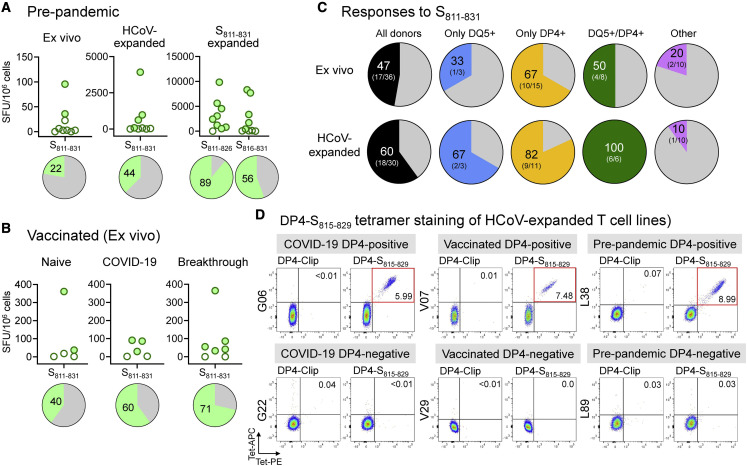
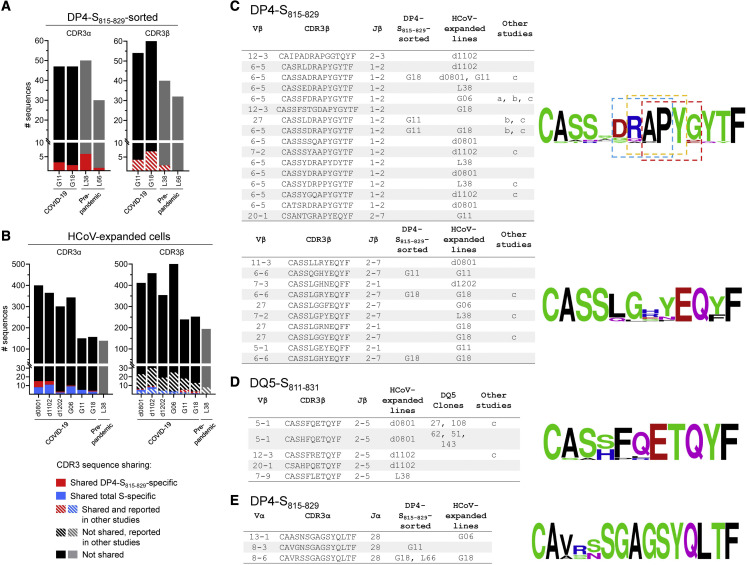
Sequence homology between SARS-CoV-2 and common-cold human coronaviruses (HCoVs) raises the possibility that memory responses to prior HCoV infection can affect T cell response in COVID-19. We studied T cell responses to SARS-CoV-2 and HCoVs in convalescent COVID-19 donors and identified a highly conserved SARS-CoV-2 sequence, S811-831, with overlapping epitopes presented by common MHC class II proteins HLA-DQ5 and HLA-DP4. These epitopes are recognized by low-abundance CD4 T cells from convalescent COVID-19 donors, mRNA vaccine recipients, and uninfected donors. TCR sequencing revealed a diverse repertoire with public TCRs. T cell cross-reactivity is driven by the high conservation across human and animal coronaviruses of T cell contact residues in both HLA-DQ5 and HLA-DP4 binding frames, with distinct patterns of HCoV cross-reactivity explained by MHC class II binding preferences and substitutions at secondary TCR contact sites. These data highlight S811-831 as a highly conserved CD4 T cell epitope broadly recognized across human populations.

Keywords: CD4 T cells; CP: Immunology; CP: Microbiology; T cell receptor repertoire; heterologous immunity; major histocompatibility complex; seasonal coronavirus; spike fusion peptide proximal region.


Conflict of interest statement

Declaration of interests The authors declare no competing interests.

Figures

None
Graphical abstract
Figure 1
Figure 1
Responses to coronavirus antigens in COVID-19 and uninfected donors (A) Representative ex vivo responses for a COVID-19 donor and a pre-pandemic donor to S pools from OC43, HKU1, NL63, and 229E (gray), and S (red), M (blue), N (green), and E (orange) pools from SARS-CoV-2. (B) Responses to re-stimulation after in vitro expansion with HCoV S pools in the same donors. IFN-γ ELISpot images and bar graphs (means ± standard deviations) are presented; +, positive responses by DFR1X (blue) or DFR2X (red) tests (Moodie et al., 2012). (C) Summary of ex vivo responses in 12 COVID-19 donors at convalescence and 7 seronegative donors (pre-pandemic donors are shown in Figure S1). (D) Summary of responses of HCoV-expanded T cells in 7 convalescent COVID-19 and 12 uninfected donors (both pre-pandemic and seronegative). (E) Responses to SARS-CoV-2 S or control N pools, before and after expansion with HCoV S pools, in convalescent COVID-19 and uninfected donors; paired t test: p = 0.021. For (C) and (D), Mann-Whitney test (∗∗p < 0.01; ∗∗∗∗p < 0.001); pies: percentage of positive responses (dark color) for each group/condition. For (C)–(E), positive responses by distribution free resampling (DFR) are indicated by dark-colored circles.
Figure 2
Figure 2
Identification of cross-reactive peptides (A) IFN-γ ELISpot responses of in vitro HCoV-expanded lines from 3 COVID-19 donors to re-stimulation with SARS-CoV-2 S overlapping peptide pools (pool number on x axis; all S, all S peptides; DMSO and Self-1, negative controls). (B) Deconvolution of positive pools (peptide number on x axis; parent pool included). (C) Amino acid sequences of candidate epitopes: S811–826/S816–831 (green), S946–961/S951–966 (pink), and S986–1,001/S991–1,006 (blue). (D) Ex vivo responses to candidate epitopes in 10 COVID-19 donors, comparison of ex vivo and in vitro expanded responses (filled circles, positive; empty circles, negative by DFR2X). Pies: percentage of positive responses. (E) Schematic of SARS-CoV-2 S protein with location of candidate epitopes. RBD, receptor binding domain; FP, fusion peptide; cleavage sites (S1/S2 and S2′) and cleavage products S1 (blue box), S2 (green box), and S2ʹ (red box). (F) Mutation frequency is indicated by size of circles. Location of candidate epitopes in the protein shown by colored broken vertical lines. Common mutations are also indicated. (G) Sequence alignment of S proteins from SARS-CoV-2 (bottom) and HCoVs (229E, NL63, HKU1, and OC43) in the region of the candidate epitopes (enclosed in boxes). For (A) and (B), bar graphs: means ± standard deviations; red stars: positive responses by DFR2X.
Figure 3
Figure 3
Functional characterization of in vitro-expanded cross-reactive T cells (A) Gating. (B) Representative plot of CD4/CD8 distribution in the CD3+ population and percentage of CD4+ cells (bar graph) in cells expanded from 3 donors. (C) Representative plot of CD45RA/CD197 in the CD4+ population and summary of the percentage of naive (N), central memory (CM), effector memory (EM), and EM re-expressing RA (TEMRA) populations in expanded cells (n = 3). (D) Representative ICS plots for IFN-γ, TNF-α, and IL-2 production, and CD107a mobilization, in the CD3+ population after re-stimulation of expanded cells with SARS-CoV-2 S pool (CoV-2 S) or peptides S811–826 and S816–831; positive responses shown in red boxes (>3-fold background). (E) Visualization of the polyfunctional response using Simplified Presentation of Incredibly Complex Evaluations (SPICE) (Roederer et al., 2011): bar graph (means ± standard deviations) for each stimulating antigen (red for CoV-2, light green for S811–826, dark green for S816–831) and comparison to control (gray) (p < 0.05, Wilcoxon rank-sum test); pie and arcs show the combined contribution of each marker (pie slice colors correspond to colors shown at the bottom of the bar graphs). (F) t-SNE analysis of concatenated data from 3 donors for stimulation with same antigens, showing density plots for each condition. Two gates (g1 and g2) were drawn, indicating major differences among stimulated and unstimulated samples. Histograms show IFN-γ, TNF-α, and CD107a in each gate. Representative density plots for responses of d0801 are shown (see also Figure S2).
Figure 4
Figure 4
HLA restriction and epitope mapping for S811–831 (A) IFN-γ responses (ELISA) of 3 representative T cell clones with confirmed reactivity to S811–831 presented by partially HLA-matched APCs (LG2, 9068, MN605); Bar graphs: means ± standard deviations, with responses to S811–831 in black and DMSO control in gray. (B) Antigen presentation blocking assays using T cell clones presented in A, and antibodies to DR, DQ, DP, and MHC class I. Inhibition indicated by colored arrows. Bar graphs: means ± standard deviations. (C) Summary of T cell clone responses (clone number on top of graph) to S811–831; color scale represents the ΔOD450 (peptide-DMSO). (D) Summary of blocking assay; color scale represents the percentage of inhibition. (E) HLA alleles expressed by APCs shared with donors originating the T cell clones. (F) Responses to a set of 11-mer peptides covering S811–831; bars: response (%) of each truncated peptide relative to the full-length peptide. Representative clones for different reactivity patterns are shown; clone number on top; number of clones exhibiting a similar pattern in parentheses. Minimal sequence required to explain reactivity is highlighted. (G) Summary of the 2 partially overlapping patterns observed in 32 clones (boxed in blue for DQ and yellow for DP). (H) Location of minimal epitopes from (F), shown aligned with S811–831 (color of lines match color of boxes; thickness of line represents approximate frequency of the pattern). Binding motifs for DQ5 and DP4 are shown as sequence logos. (I) Normalized binding (half-maximal inhibitory concentration[IC50]-positive control/IC50 peptide) for truncated peptides to purified DQ5 or DP4 (see also Figures S2, S3 and S4).
Figure 5
Figure 5
Cross-reactive recognition of S811–831 homologs (A) Sequences of SARS-CoV-2 S811–831 and corresponding HKU1, OC43, 229E, and NL63 peptides; boxes enclose the DQ5 (blue) and DP4 (yellow) 9-mer core epitopes. (B) Responses of representative T cell clones to the peptides (IFN-γ ELISA). Bar graphs: means ± standard deviations) (C) Hierarchical clustering of responses of 19 T cell clones to different homologs. Four major groups were defined: CoV2-OC43-HKU1/DQ5 (purple), CoV2-HKU1/DQ5 (cyan), CoV2-HKU1/DP4 (gold), and CoV2-NL63-229E/DP4-DP2 (magenta). (D) Sequence alignment of DP4 and DQ5 core epitopes from SARS-CoV-2 and HCoVs. Numbers at bottom indicate peptide position, with T cell contacts encircled. Changes relative to SARS-CoV-2 shown in color; T cell contacts with gray bars. (E) Normalized binding of homolog peptides relative to S811–831. (F) Dose response of selected T cell clones to homolog peptides (IFN-γ ELISA). Symbols show means ± standard deviations. (G) Responses of in vitro expanded cells from unexposed donors (expanded with SARS-CoV-2 peptides) to homolog peptides (IFN-γ ELISpot; +, positive response by DFR2X); relevant HLA shown in parentheses. (H) Sequence alignment of S811–831 and positional homologs in 28 coronaviruses that sample the Orthocoronavirinae subfamily (Table S4). Complete SARS-CoV-2 sequence and differences for other viruses are shown. DP4 core epitope in blue, T cell contact positions with gray bars. Phylogenetic tree of the S proteins shown at left; conservation index (C.I.) for each position at top; predicted DP4 binding affinities at right (see also Figure S5).
Figure 6
Figure 6
Broad recognition of S811–831 in the population (A) Responses (IFN-γ ELISpot) to S811–831 in 9 pre-pandemic donors, ex vivo and after in vitro expansion with HCoV S pools or SARS-CoV-2 S811–831. (B) Ex vivo responses to S811–831 in vaccinated donors (naive: no previous COVID-19; COVID-19, previous COVID-19; breakthrough, COVID-19 after vaccination). Pies show percentage of positive responses in (A) and (B). (C) Responses to S811–831ex vivo and in HCoV-expanded cells for donors categorized according to DQ5 and DP4 status: all donors: donors regardless of DQ5/DP4 status; only DQ5: express DQ5 but not DP4; only DP4: express DP4 but not DQ5; DQ5/DP4: express both alleles; other: express neither allele. Percentage of donors with a positive response and number of positive and total donors are shown. (D) Representative DP4-S815–829 double-tetramer staining (PE and APC) of HCoV-expanded T cells from COVID-19, vaccine recipients, and unexposed donors in CD4+ population, for donors expressing DP4 (top) or not expressing DP4 (bottom). DP4-Clip tetramers used as controls (see also Figures S6 and S7).
Figure 7
Figure 7
Analysis of cross-reactive TCR repertoires from COVID-19 and pre-pandemic donors (A) Summary of CDR3α and CDR3β clonotypes identified in DP4-S815-829 tetramer-sorted cells. Sequences shared among different donors shown in red, hatched lines show sequences also reported in other studies. (B) Same as previous panel, but for clonotypes identified in polyclonal lines expanded with HCoV S pool. Sequences shared among different donors shown in blue; hatched lines show sequences reported by others. (C) Selected TCR-β DP4-specific convergence groups (CGs) identified in DP4-S815–829-tetramer sorted samples, HCoV-expanded polyclonal lines, and in other studies: a=(Nolan et al., 2020); b=(Low et al., 2021); c=(Dykema et al., 2021). Sequence logos associated with the two CGs (scores 2.8E-14 and 4.4E-14) are shown at right. Three sequence motifs identified in the first CG are boxed (Motifs: RAPY [p<0.001], APYG [p<0.001], DRAP [p<0.001]). CGs identified using GLIPH (Glanville et al., 2017). (D) TCR-β DQ5-specific CG identified in HCoV-expanded polyclonal lines, DQ5-restricted T cell clones, and reported in other studies. CG score: 2.5E-15. CGs identified using GLIPH (Glanville et al., 2017) (E) TCR-α DP4-specific cluster identified in DP4- S815-829-tetramer-sorted samples and HCoV-expanded polyclonal lines. Sequence cluster identified using TCRdist (Dash et al., 2017).

References

    1. Bacher P., Rosati E., Esser D., Martini G.R., Saggau C., Schiminsky E., Dargvainiene J., Schroder I., Wieters I., Khodamoradi Y., et al. Low-avidity CD4(+) T cell responses to SARS-CoV-2 in unexposed individuals and humans with severe COVID-19. Immunity. 2020;53:1258–1271.e5. doi: 10.1016/j.immuni.2020.11.016. - DOI - PMC - PubMed
    1. Becerra-Artiles A., Cruz J., Leszyk J.D., Sidney J., Sette A., Shaffer S.A., Stern L.J. Naturally processed HLA-DR3-restricted HHV-6B peptides are recognized broadly with polyfunctional and cytotoxic CD4 T-cell responses. Eur. J. Immunol. 2019;49:1167–1185. doi: 10.1002/eji.201948126. - DOI - PubMed
    1. Bolotin D.A., Poslavsky S., Mitrophanov I., Shugay M., Mamedov I.Z., Putintseva E.V., Chudakov D.M. MiXCR: software for comprehensive adaptive immunity profiling. Nat. Methods. 2015;12:380–381. doi: 10.1038/nmeth.3364. - DOI - PubMed
    1. Bonifacius A., Tischer-Zimmermann S., Dragon A.C., Gussarow D., Vogel A., Krettek U., Godecke N., Yilmaz M., Kraft A.R.M., Hoeper M.M., et al. COVID-19 immune signatures reveal stable antiviral T cell function despite declining humoral responses. Immunity. 2021;54:340–354.e6. doi: 10.1016/j.immuni.2021.01.008. - DOI - PMC - PubMed
    1. Busch R., Doebele R.C., von Scheven E., Fahrni J., Mellins E.D. Aberrant intermolecular disulfide bonding in a mutant HLA-DM molecule: implications for assembly, maturation, and function. J. Immunol. 1998;160:734–743. - PubMed

Publication types