. 2022 Aug;28(8):1089-1109.
doi: 10.1261/rna.079102.122. Epub 2022 Jun 8.

Comparison of CpG- and UpA-mediated restriction of RNA virus replication in mammalian and avian cells and investigation of potential ZAP-mediated shaping of host transcriptome compositions

Affiliations

Comparison of CpG- and UpA-mediated restriction of RNA virus replication in mammalian and avian cells and investigation of potential ZAP-mediated shaping of host transcriptome compositions

Valerie Odon et al. RNA. 2022 Aug.

Abstract

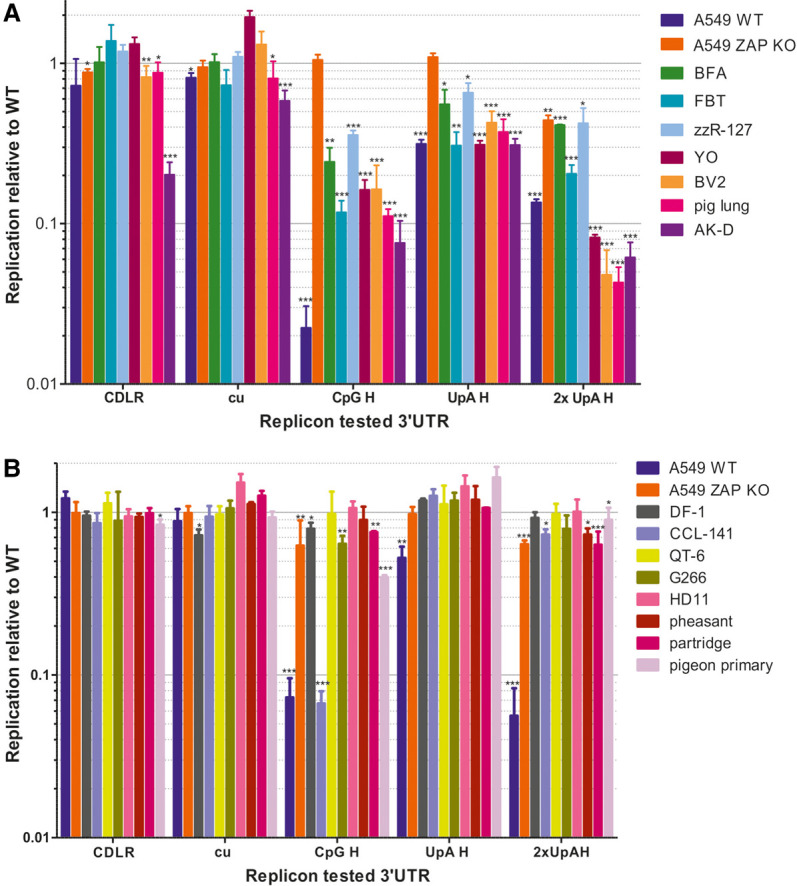
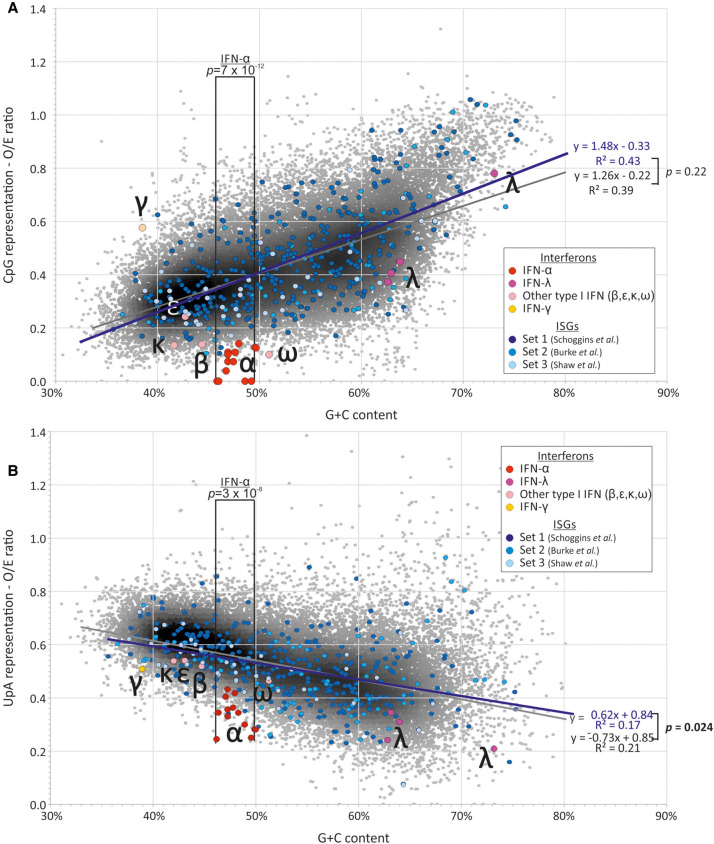
The ability of zinc finger antiviral protein (ZAP) to recognize and respond to RNA virus sequences with elevated frequencies of CpG dinucleotides has been proposed as a functional part of the vertebrate innate immune antiviral response. It has been further proposed that ZAP activity shapes compositions of cytoplasmic mRNA sequences to avoid self-recognition, particularly mRNAs for interferons (IFNs) and IFN-stimulated genes (ISGs) expressed during the antiviral state. We investigated whether restriction of the replication of mutants of influenza A virus (IAV) and the echovirus 7 (E7) replicon with high CpG and UpA frequencies varied in different species of mammals and birds. Cell lines from different bird orders showed substantial variability in restriction of CpG-high mutants of IAV and E7 replicons, whereas none restricted UpA-high mutants, in marked contrast to universal restriction of both mutants in mammalian cells. Dinucleotide representation in ISGs and IFN genes was compared with those of cellular transcriptomes to determine whether potential differences in inferred ZAP activity between species shaped dinucleotide compositions of highly expressed genes during the antiviral state. While mammalian type 1 IFN genes typically showed often profound suppression of CpG and UpA frequencies, there was no oversuppression of either in ISGs in any species, irrespective of their ability to restrict CpG- or UpA-high mutants. Similarly, genome sequences of mammalian and avian RNA viruses were compositionally equivalent, as were IAV strains recovered from ducks, chickens and humans. Overall, we found no evidence for host variability in inferred ZAP function shaping host or viral transcriptome compositions.

Keywords: RNA virus; dinucleotide; interferon; interferon-stimulated gene; trancriptome; zinc finger antiviral protein.


Figures

FIGURE 1.
FIGURE 1.
Replication of E7 replicons in control A549 and chicken DF-1 cell line. Cells were transfected with 50 ng/well of in vitro transcribed RNA of E7 replicon with a 3′UTR variant WT, permuted (CDLR), CpG low (cu) and elevated of CpG (CpG-H) and UpA (UpA-H) and assayed for luciferase expression at 6 h post transfection. Relative replication in control human cell lines A549, A549 ZAP k/o, and DF-1 cells. Significance of differences from WT replication were calculated by two-tailed paired t-test; asterisks show significance values as follows: (***) P < 0.001, (**) P < 0.01, and (*) P < 0.05
FIGURE 2.
FIGURE 2.
Replication of E7 replicons in a range of (A) mammalian and (B) avian cell lines. Cells were transfected with 50 ng/well of in vitro transcribed RNA of E7 replicons as described in Figure 1. The bar heights depict mean replication relative to the WT replicon in each cell line; the data were derived from three biological replicates; error bars show standard deviations. Significance of differences from WT replication were calculated by two-tailed paired t-test; asterisks show significance values as follows: (***) P < 0.001, (**) P < 0.002, and (*) P < 0.033. Abbreviations: mammalian cell lines: BFA: bovine fetal aorta (host species Bos taurus); FBT: fetal bovine turbinate; zzR-127 (Bos taurus): goat fetal tongue cell line; YO: derived from a hybrid myeloma YB2/3HL (Capra hircus); BV2: microglial cells (Mus musculus); AK-D: fetal cat lung (Felis catus). Avian cell lines: DF-1: chicken embryo fibroblast (Gallus gallus); CCL-141: duck embryo (Anas platyrhynchos); QT6: Japanese quail fibrosarcoma (Coturnix japonica); G266: male zebra finch (Taeniopygia guttata); HD11 chicken macrophage-like (G. gallus); primary cells from pigeon, partridge, and quail.
FIGURE 3.
FIGURE 3.
Comparison of the replication kinetics of WT IAV with mutants with elevated (A) CpG and (B) UpA dinucleotide frequencies in segment 4. Replication was assayed in mutants in the avian cell lines QT6 (Japanese Quail fibrosarcoma—Coturnix japonica), DF-1 (chicken embryo fibroblast—Gallus gallus) and CCL-141 (duck embryo—Anas platyrhynchos). Cells were infected at an MOI of 0.001, and at specified times supernatant was collected and titrated by infectivity using A549 ZAP k/o cells—TCID50 values shown on the y-axis. Data points represent the mean of two biological replicates; the reduced replication in the replication of the CpG-H compared to WT was significant in unpaired value t-test at 24 h and 36 h time points, (*) P = 0.03, (**) P = 0.04, and by two-way ANOVA (P = 0.022). No other comparisons of mutant (CpG-H or UpA-H) or time point with WT were significant at the P = 0.05 level.
FIGURE 4.
FIGURE 4.
Induction of IFN-β and ZAP after poly(I:C) stimulation. RNA extracted from cell lysates of (A) DF-1 chicken and (B) CCL-141 duck cell lines at different time points post-stimulation was quantified for ZAP and IFN-β mRNA expression by qRT-PCR. Data shows mean fold-change in expression relative to unstimulated control.
FIGURE 5.
FIGURE 5.
Diversity and positive selection analysis of avian ZAP. (A) Using an alignment of 13 avian ZAP sequences (Supplemental Data Table S4A) and following trimming to remove a region of no homology between the fourth and fifth zinc-finger motifs, a sliding-window analysis of sequence diversity was conducted using 100 bp windows and 1 bp increment size. Diversity was calculated as the average pairwise number of variant sites per 100 bp window. The four domains of ZAP are shown in colored blocks, including the NAD+ binding sites in the PARP domain (yellow). Superimposed in red points are positively selected sites as determined by M2a in PAML. Nucleotide position refers to the position in the alignment following trimming—original coordinates of the chicken sequence can be found in Supplemental Data Table S4B. (B) Using the same alignment, the free-ratios model in PAML was implemented to determine along which branches positive selection has been strongest. Each branch is labeled with its respective dN/dS value, and branches are colored according to dN/dS.
FIGURE 6.
FIGURE 6.
Comparison of dinucleotide frequencies of human ISGs and IFN genes with the bulk human mRNA transcriptome. A comparison of (A) CpG and (B) UpA dinucleotide representation in human ISGs and interferon genes with the bulk human mRNA transcriptome (of coding sequence lengths ≥450 bases). CpG and UpA representations (observed frequency/frequency expected base on mononucleotide frequencies) of IFN-α paralogs were compared with human mRNA sequences in the G + C content range spanning the former (40.2%–50.0%) using an independent samples t-test. CpG and UpA representations in ISGs and mRNA were compared using regression analysis (see Results text; values for individual ISG data sets are shown in Table 2). Sources of ISG sequences: Set 1: Schoggins et al. (2014); Set 2: Burke et al. (2019); Set 3: Shaw et al. (2021).
FIGURE 7.
FIGURE 7.
(A) CpG and (B) UpA representation in mammalian interferon genes. Comparison of dinucleotide representations of IFN-α, IFN-β, and IFN-γ in mammalian species with the bulk human mRNA transcriptome (IFN gene accession numbers and host species are listed in Supplemental Data Table S8). Differences in values over defined G + C content ranges specific for each IFN gene class were analyzed using the independent samples t-test.
FIGURE 8.
FIGURE 8.
CpG and UpA dinucleotide representation in the chicken transcriptome, ISGs and avian inteferon-α and -γ genes. A comparison of (A) CpG and (B) UpA dinucleotide representation in chicken ISGs and avian interferon genes (listed in Supplemental Data Tables S8, S10) with chicken mRNA transcriptome sequences (of coding sequence lengths ≥450 bases). Chicken ISGs were identified through homology searching for homologs of human ISGs listed in Supplemental Data Table S8, Schoggins et al. (2014), Burke et al. (2019), and Shaw et al. (2021). Differences in dinucleotide representations over defined G + C content ranges specific for each IFN gene class were analyzed using the independent samples t-test.
FIGURE 9.
FIGURE 9.
Summary comparison of over- and underpresentation of (A) CpG and (B) UpA composition in mammalian and avian mRNA sequences and in ISG and IFN subsets. Observed/expected frequencies of CpG and UpA of gene sequences were compared to values predicted from their G + C content using regression formulae for line of best fit for human and chicken mRNA sequences (shown in Figs. 6, 8). Means values and ranges for overrepresentation (positive values) and underrepresentation (negative values) for each sequence are shown in Tukey plots; source listed in Supplemental Data Table S6.
FIGURE 10.
FIGURE 10.
Comparison of CpG and UpA composition in RNA viruses infecting mammals and birds. Observed/expected ratios of (A) CpG and (B) UpA RNA viruses (listed in Supplemental Data Tables S11, S12) infecting mammals and birds. Ratios have been overlaid on values for avian (chicken) mRNA sequences to provide context. Analysis restricted to coding sequences of length >450 bases.
FIGURE 11.
FIGURE 11.
Differences in G + C content and CpG and UpA representation in gene sequences of RNA viruses infecting mammals and birds. Comparison of virus composition between viruses infecting mammals and birds, expressed as fractional differences in G + C content and CpG and UpA dinucleotide representation calculated as f(M)–f(A)/f(All), where f(M) is the mean composition of mammalian viruses, f(A) is of avian viruses, and f(All) is the overall mean. Analyses were performed separately for (A) different virus families and (B) for different segments of flu strains isolated from mammalian (human) and avian sources (duck, chicken). Further analyses of differences between duck and chicken hosts, analyses where recently zoonotic H5N1 strains have been excluded and CpG and UpA representations calculated independently of protein coding are provided in Supplemental Data Table S15. Source sequences are listed in Supplemental Data Tables S10, S11.
FIGURE 12.
FIGURE 12.
Comparison of (A) CpG and (B) UpA compositions of mammalian and avian IAV strains. Distributions of CpG and UpA representations plotted against G + C content for IAV strains derived from different hosts; source sequences and serotype totals listed in Supplemental Data Tables S13, S14.

Similar articles

Cited by

References

    1. Barber MR, Aldridge JR Jr, Webster RG, Magor KE. 2010. Association of RIG-I with innate immunity of ducks to influenza. Proc Natl Acad Sci 107: 5913–5918. 10.1073/pnas.1001755107 - DOI - PMC - PubMed
    1. Beutler E, Gelbart T, Han JH, Koziol JA, Beutler B. 1989. Evolution of the genome and the genetic code: selection at the dinucleotide level by methylation and polyribonucleotide cleavage. Proc Natl Acad Sci 86: 192–196. 10.1073/pnas.86.1.192 - DOI - PMC - PubMed
    1. Bick MJ, Carroll JW, Gao G, Goff SP, Rice CM, MacDonald MR. 2003. Expression of the zinc-finger antiviral protein inhibits alphavirus replication. J Virol 77: 11555–11562. 10.1128/JVI.77.21.11555-11562.2003 - DOI - PMC - PubMed
    1. Bird AP. 1980. DNA methylation and the frequency of CpG in animal DNA. Nucleic Acids Res 8: 1499–1504. 10.1093/nar/8.7.1499 - DOI - PMC - PubMed
    1. Burke JM, Moon SL, Matheny T, Parker R. 2019. RNase L reprograms translation by widespread mRNA turnover escaped by antiviral mRNAs. Mol Cell 75: 1203–1217.e1205. 10.1016/j.molcel.2019.07.029 - DOI - PMC - PubMed

Publication types

LinkOut - more resources