. 2022 Jun 8;13(1):3295.
doi: 10.1038/s41467-022-31012-0.

Genome-wide mapping of individual replication fork velocities using nanopore sequencing

Affiliations

Genome-wide mapping of individual replication fork velocities using nanopore sequencing

Bertrand Theulot et al. Nat Commun. .

Abstract

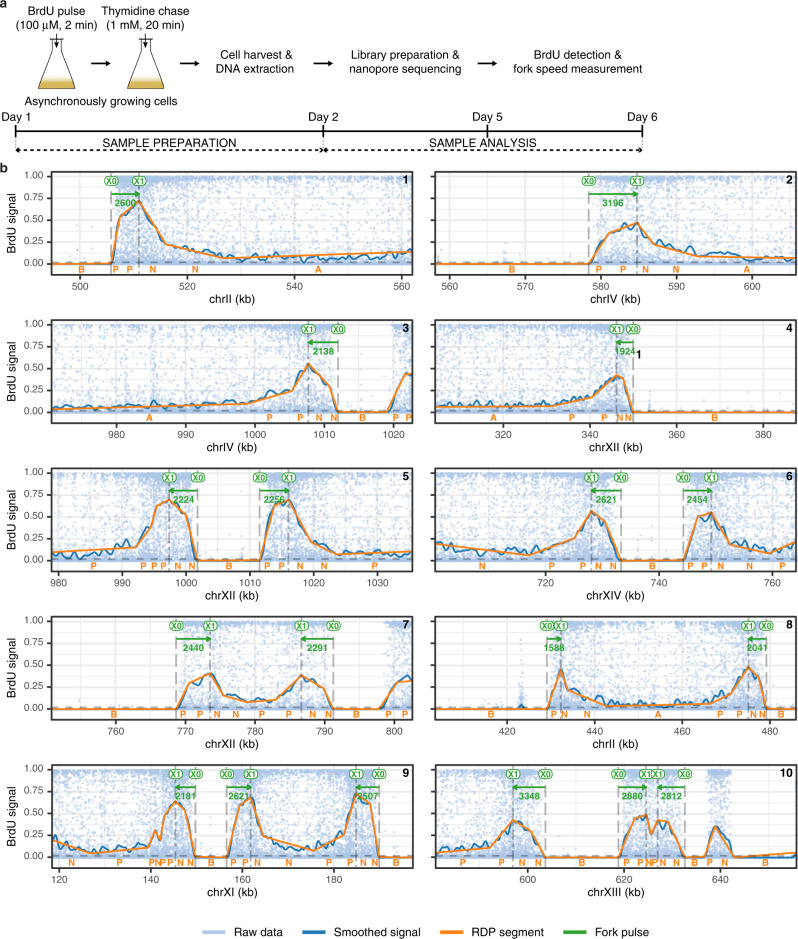
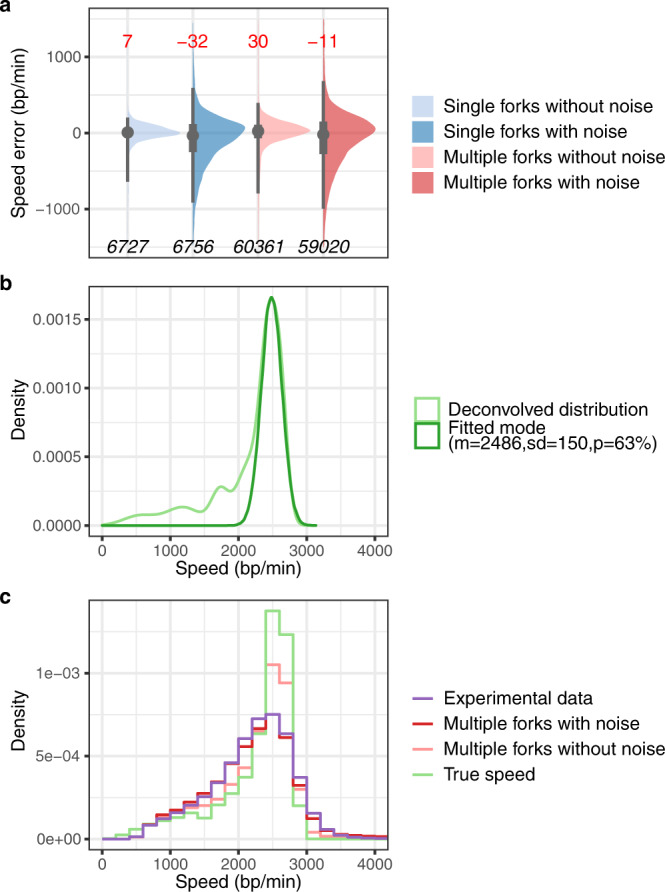
Little is known about replication fork velocity variations along eukaryotic genomes, since reference techniques to determine fork speed either provide no sequence information or suffer from low throughput. Here we present NanoForkSpeed, a nanopore sequencing-based method to map and extract the velocity of individual forks detected as tracks of the thymidine analogue bromodeoxyuridine incorporated during a brief pulse-labelling of asynchronously growing cells. NanoForkSpeed retrieves previous Saccharomyces cerevisiae mean fork speed estimates (≈2 kb/min) in the BT1 strain exhibiting highly efficient bromodeoxyuridine incorporation and wild-type growth, and precisely quantifies speed changes in cells with altered replisome progression or exposed to hydroxyurea. The positioning of >125,000 fork velocities provides a genome-wide map of fork progression based on individual fork rates, showing a uniform fork speed across yeast chromosomes except for a marked slowdown at known pausing sites.


Conflict of interest statement

The authors declare no competing interests.

Figures

Fig. 1
Fig. 1. Replication fork speed measurement procedure by NFS.
a Scheme of the protocol for BrdU pulse-labelling of DNA replication in BT1 cells. The usual timeline is indicated. b BrdU content profiles of nanopore sequencing reads of genomic DNA from pulse-labelled BT1 cells processed by NFS. Panels show typical replication signals, namely rightward, leftward, diverging and converging forks. Light blue dots, raw data from Megalodon (dots represent the probability of BrdU at each thymidine position); blue curve, smoothed signal; orange lines, segments resulting from the piecewise linear simplification method using the Ramer-Douglas-Peucker algorithm (RDP) to detect and orient BrdU tracks (B, flat segments with background BrdU level; A, flat segments with a BrdU level above background; P, segments with a positive slope; N, segments with a negative slope); X0, estimated position of the start of BrdU incorporation; X1, estimated position of the start of the thymidine chase; green arrow, fork direction, with fork velocity (bp/min, in green) indicated below.
Fig. 2
Fig. 2. Measurement of replication fork speed in yeast by NFS.
a, b Replication fork speed in BT1 cells grown at 30 °C (a) or 25 °C (b). Half-eye plots of individual fork velocities detected by NFS on sequencing reads from MinION, multiplexed MinION or PromethION runs performed on pulse-labelled DNA from independent BT1 cell cultures (the two PromethION samples are technical replicates). Red line, mean speed, value indicated in red on top; grey dot, median speed; thick and thin grey vertical lines, 50 and 95% intervals, respectively; bottom, number of individual fork speed measurements; dotted line in a, average fork speed of all samples (2128 bp/min). The name of the sequencing run is indicated below each plot; detailed run information is presented in Supplementary Data 1.
Fig. 3
Fig. 3. Evaluation of NFS accuracy and estimation of the true fork speed distribution in yeast using simulated replication forks.
a Half-eye plots showing the distribution of measurement errors made by NFS on simulated forks. Fork velocities were determined by NFS on simulated reads containing either a single or multiple forks of known speed, with or without noise, and differences between NFS measurements and true speeds were computed (see ‘Methods’). Grey dot, median speed error, value indicated in red on top; thick and thin grey vertical lines, 50% and 95% intervals, respectively; bottom, number of measurements. b Deconvolved distribution of individual fork speeds in yeast (light green curve) and Gaussian distribution fitting its main peak (green curve). m, mean speed (bp/min); sd, standard deviation (bp/min); p, percentage (correction factor to fit the Gaussian distribution to the deconvolved distribution). See text and ‘Methods’ for details. c Histograms showing fork speed distribution on 100,000 reads with one or multiple forks simulated according to the deconvolved true fork speed distribution (True Speed, light green), fork speed distribution after NFS processing of these reads without (pink) or with (red) noise, and the experimental distribution of >125,000 individual fork velocities from BT1 cells at 30 °C (purple).
Fig. 4
Fig. 4. Measurement of replication fork speed in yeast by NFS in conditions of altered replisome progression.
a Replication fork speed in BT1 cells grown in the presence of increasing concentrations of hydroxyurea (HU). b Replication fork speed in mutant strains with altered fork progression. a, b Grey dot, mean fork speed of a sample; red centre line, average value of all mean fork speeds of the corresponding category, indicated in red on top; red whiskers, standard deviation; bottom, number of samples. Two-sided contrast comparisons between untreated BT1 cells and each HU concentration in a and between BT1 cells and each mutant in b are indicated by a star (p ≤ 0.05) or n.s. (not significant). Statistical analyses are detailed in Supplementary Table 2.
Fig. 5
Fig. 5. Replication fork progression map of yeast chromosomes.
Shown are chromosomes XI to XIV. Panels from top to bottom: (1) median of experimental fork speeds (blue line) with 98% confidence interval of the median (light blue) and median of reshuffled speeds (red line) with 98% confidence interval of the median (light red) computed in 20 kb windows (dotted line, median fork speed in the whole genome); (2) results of Mann–Whitney-Wilcoxon tests with Holm correction (one-sided) performed along the chromosome to compare the speed distribution in a given window of a given width (1, 2, 3, 4, 5, 6, 7, 8, 9, 10, 15 and 20 kb) to the speed distribution on the whole genome (purple, regions of lower fork speed; green, regions of higher fork speed; white, n.s., not significant; statistical significance was set to p < 0.01; grey, N/A, not applicable, regions with no fork); (3) position of selected genomic features (CEN, centromere; TEL, telomeres; ORI, known S. cerevisiae replication origins from ref. ); (4) coverage of individual replication fork velocities (dotted line, median coverage of the genome). N/A peaks in panel 2 and droughts in coverage in panel 4 essentially map to the position of active origins since fork pairs at initiation sites cannot be resolved by our analysis (see text for details).
Fig. 6
Fig. 6. Analysis of replication fork progression in the yeast genome.
a Replication fork speed at selected genomic features. Please note that “telomeres” correspond to subtelomeric sequences and do not comprise the terminal stretch of telomeric repeats. b Replication fork speed at tRNA genes with a direction of transcription in the same (Co-directional, 129 genes) or opposite (Head-on, 115 genes) orientation to the main direction of fork progression determined using BT1 RFD profile (see ‘Methods’ and Supplementary Fig. 3). c Replication fork speed on the leading and lagging strands. ac Grey dot, mean speed of forks overlapping the corresponding DNA element (a, b) or progressing on the leading or lagging strand (c) in a sample; red centre line, average value of all mean fork speeds of the corresponding category, indicated in red on top; red whiskers, standard deviation; bottom, number of samples (nrDNA = 19 since no fork overlapped the rDNA locus in 3 samples). Two-sided contrast comparisons between a given genomic feature and the rest of the genome in a, between co-directional and head-on tRNA genes in b and between the leading and lagging strands in c are indicated by a star (p ≤ 0.05) or n.s. (not significant). Statistical analyses are detailed in Supplementary Table 2. d Fork speed versus replication timing (data from ref. normalized between 0 and 1 corresponding to the start and end of S phase, respectively) plotted as a 2D density plot using hexagonal bins. Coefficient (ρ) and p-value of Spearman’s correlation test (two-sided) between fork speed and replication timing are indicated.

References

    1. Gaillard H, García-Muse T, Aguilera A. Replication stress and cancer. Nat. Rev. Cancer. 2015;15:276–289. doi: 10.1038/nrc3916. - DOI - PubMed
    1. Kapp, L. N. & Painter, R. B. in International Review of Cytology (eds Bourne, G. H., Danielli, J. F. & Jeon, K. W.) (Academic Press, 1982).
    1. Liapunova, N. A. in International Review of Cytology (eds Jeon, K. W. & Jarvik, J.) (Academic Press, 1994).
    1. Técher H, et al. Replication dynamics: biases and robustness of DNA fiber analysis. J. Mol. Biol. 2013;425:4845–4855. doi: 10.1016/j.jmb.2013.03.040. - DOI - PubMed
    1. Yurov YB. Rate of DNA replication fork movement within a single mammalian cell. J. Mol. Biol. 1980;136:339–342. doi: 10.1016/0022-2836(80)90378-2. - DOI - PubMed

Publication types

MeSH terms

Substances

LinkOut - more resources