. 2022 Jun 8;5(1):558.
doi: 10.1038/s42003-022-03447-0.

Spotted lanternfly predicted to establish in California by 2033 without preventative management

Affiliations

Spotted lanternfly predicted to establish in California by 2033 without preventative management

Chris Jones et al. Commun Biol. .

Abstract

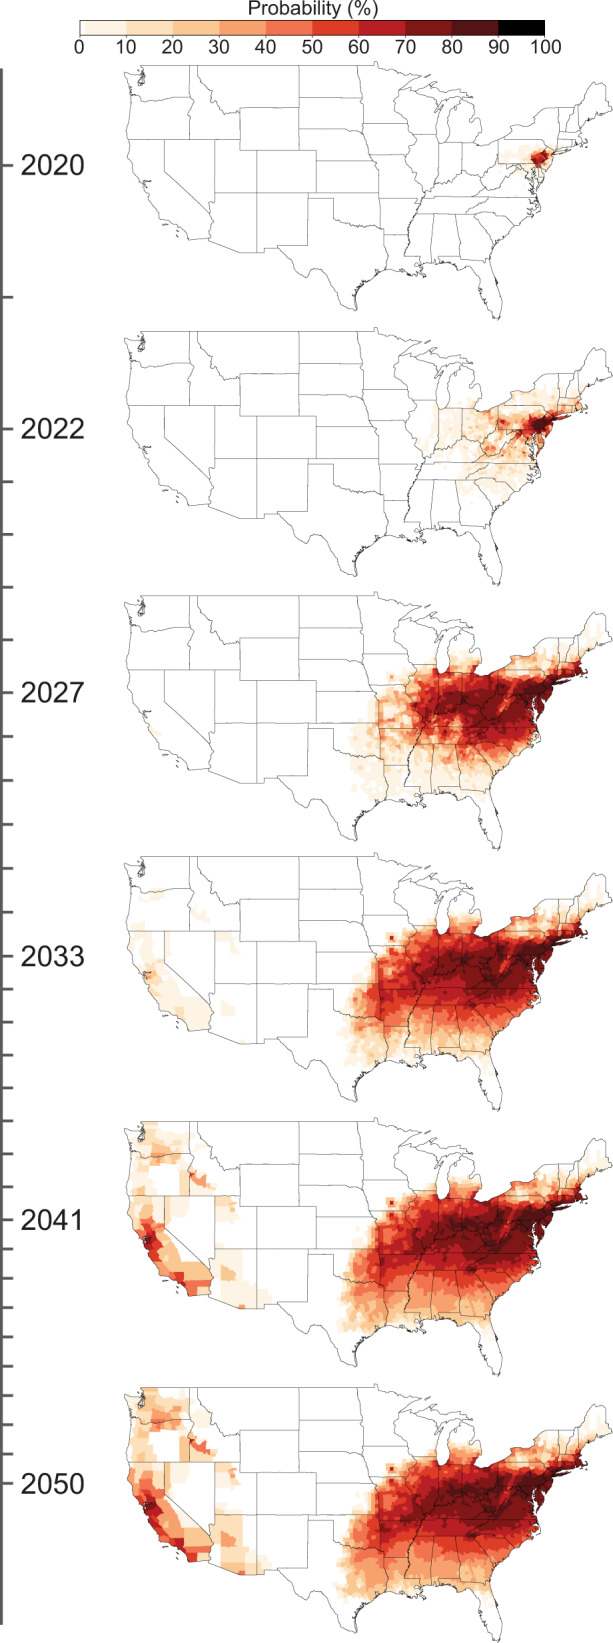
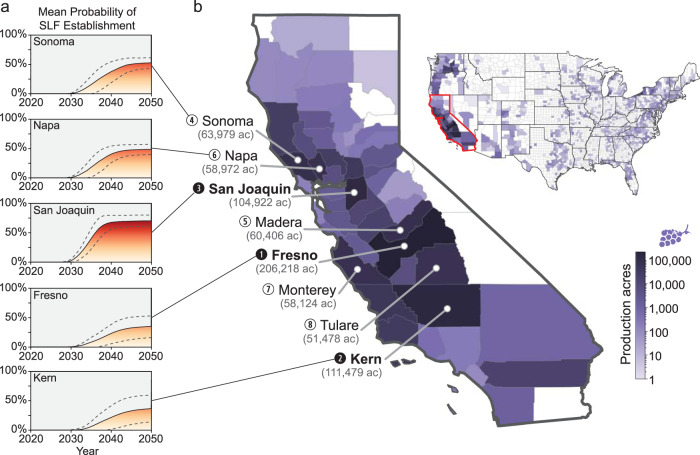
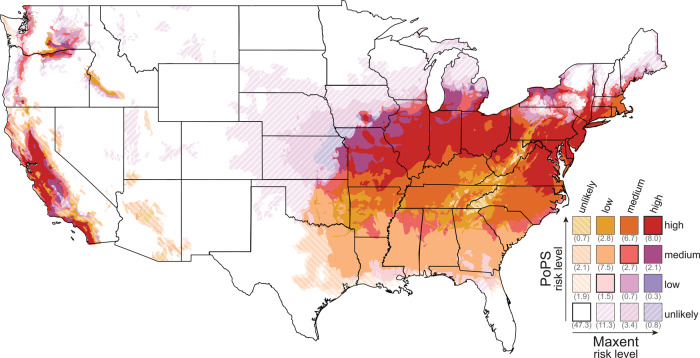
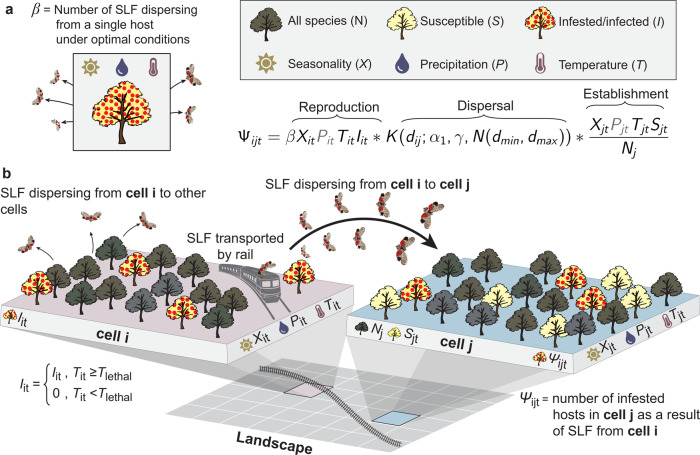
Models that are both spatially and temporally dynamic are needed to forecast where and when non-native pests and pathogens are likely to spread, to provide advance information for natural resource managers. The potential US range of the invasive spotted lanternfly (SLF, Lycorma delicatula) has been modeled, but until now, when it could reach the West Coast's multi-billion-dollar fruit industry has been unknown. We used process-based modeling to forecast the spread of SLF assuming no treatments to control populations occur. We found that SLF has a low probability of first reaching the grape-producing counties of California by 2027 and a high probability by 2033. Our study demonstrates the importance of spatio-temporal modeling for predicting the spread of invasive species to serve as an early alert for growers and other decision makers to prepare for impending risks of SLF invasion. It also provides a baseline for comparing future control options.


Conflict of interest statement

The authors declare no competing interests.

Figures

Fig. 1
Fig. 1. Spread probability over time using the mean of all raster cells in a county.
By 2027 there is a low probability of SLF infestation in California, and by 2033 the first county in California has a high probability of SLF occurrence.
Fig. 2
Fig. 2. Crops at risk from SLF and total value.
ai Probability of SLF establishment over time for major crops. j The economic value of each crop. All acreage and economic data are from the USDA National Agricultural Statistics Service 2017 census.
Fig. 3
Fig. 3. Crop production for top at-risk commodities.
USDA county-level production data in acres for crops from the National Agricultural Statistics Service Census 2017 by county (a) grapes, b almonds, c apples, d walnuts, e cherries, f hops, g peaches, h plums, i apricots.
Fig. 4
Fig. 4. Probability of SLF establishment in grape-growing counties.
a Mean probability of SLF establishment over time (average of all pixel probabilities in the county), based on PoPS output, in the three grape-producing California counties with production >100,000 acres, plus Sonoma and Napa Counties, which produce high-value wine grapes. Asymptotes do not reach 100% probability, because some pixels in each county are unsuitable for SLF and have a 0% probability of establishment; asymptotes are reached when all suitable pixels in a county are predicted to be infested by SLF. Dotted lines represent standard deviation across runs. b Grape acreage under production based on the USDA National Agricultural Statistics Service 2017 census, highlighting the eight counties with the most grape production.
Fig. 5
Fig. 5. MaxEnt and PoPS model comparison.
Comparison of SLF risk predicted by the MaxEnt model of Wakie et al. versus PoPS output for the year 2050. The percentage of total land area in each risk category is provided in parentheses in the legend.
Fig. 6
Fig. 6. Model structure for spotted lanternfly (SLF, Lycorma delicatula).
Unused modules in the PoPS model are gray in the equation. a The number of pests that disperse from a single host under optimal environmental conditions (β) is modified by the number of currently infested hosts (I) and environmental conditions in a location (i) at a particular time (t); environmental conditions include seasonality (X) and temperature (T) (see supplementary Fig. 3 for details on temperature). Dispersal is a function of gamma (γ), which is the probability of short-distance dispersal (alpha-1, α1) or long-distance via the rail network (N (dmin, dmax)). For the natural-distance Cauchy kernel, the direction is selected using 0-359 with 0 representing North. For the network kernel, the direction along the rail is selected randomly, and then travel continues in that direction until the drawn distance is reached. Once SLF has landed in a new location, its establishment depends on environmental conditions (X, T) and the availability of suitable hosts (number of susceptible hosts [S] divided by total number of potential hosts [N]). b We used a custom host map for tree of heaven (Ailanthus altissima) to determine the locations of susceptible hosts. The number of newly infested hosts (ψ) is predicted for each cell across the contiguous US.
Fig. 7
Fig. 7. Parameter distributions.
a Reproductive rate (β), b natural dispersal distance (α1), c percent natural dispersal (γ), d minimum distance (dmin), e maximum distance (dmax).

References

    1. Wakie TT, Neven LG, Yee WL, Lu Z. The establishment risk of Lycorma delicatula (Hemiptera: Fulgoridae) in the United States and gobally. J. Econ. Entomol. 2020;113:306–314. - PubMed
    1. Namgung H, Kim M-J, Baek S, Lee J-H, Kim H. Predicting potential current distribution of Lycorma delicatula (Hemiptera: Fulgoridae) using MaxEnt model in South Korea. J. Asia-Pac. Entomol. 2020;23:291–297. doi: 10.1016/j.aspen.2020.01.009. - DOI
    1. Jung J-M, Jung S, Byeon D, Lee W-H. Model-based prediction of potential distribution of the invasive insect pest, spotted lanternfly Lycorma delicatula (Hemiptera: Fulgoridae), by using CLIMEX. J. Asia-Pac. Biodivers. 2017;10:532–538. doi: 10.1016/j.japb.2017.07.001. - DOI
    1. Hao T, Elith J, Guillera‐Arroita G, Lahoz‐Monfort JJ. A review of evidence about use and performance of species distribution modelling ensembles like BIOMOD. Divers. Distrib. 2019;25:839–852. doi: 10.1111/ddi.12892. - DOI
    1. Meentemeyer RK, et al. Epidemiological modeling of invasion in heterogeneous landscapes: spread of sudden oak death in California (1990-2030) Ecosphere. 2011;2:art17. doi: 10.1890/ES10-00192.1. - DOI

Publication types