. 2022 Jun;606(7916):999-1006.
doi: 10.1038/s41586-022-04809-8. Epub 2022 Jun 8.

The renal lineage factor PAX8 controls oncogenic signalling in kidney cancer

Affiliations

The renal lineage factor PAX8 controls oncogenic signalling in kidney cancer

Saroor A Patel et al. Nature. 2022 Jun.

Abstract

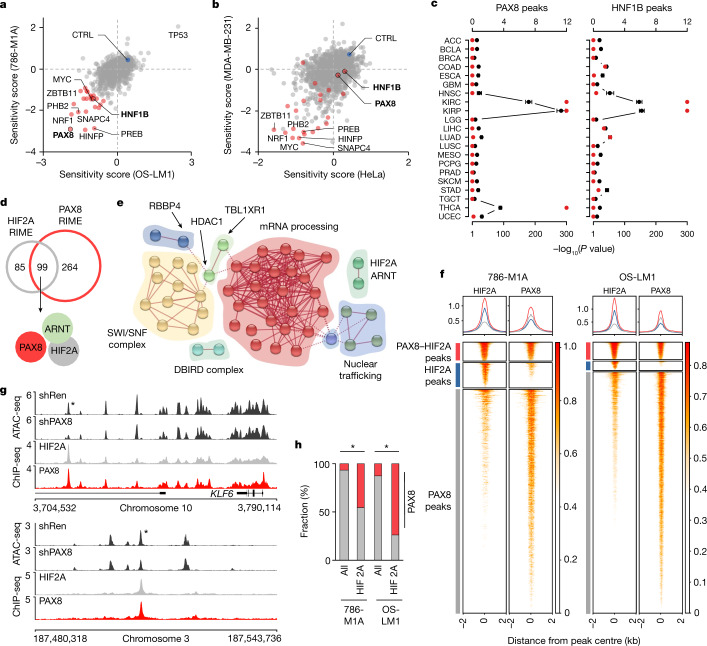
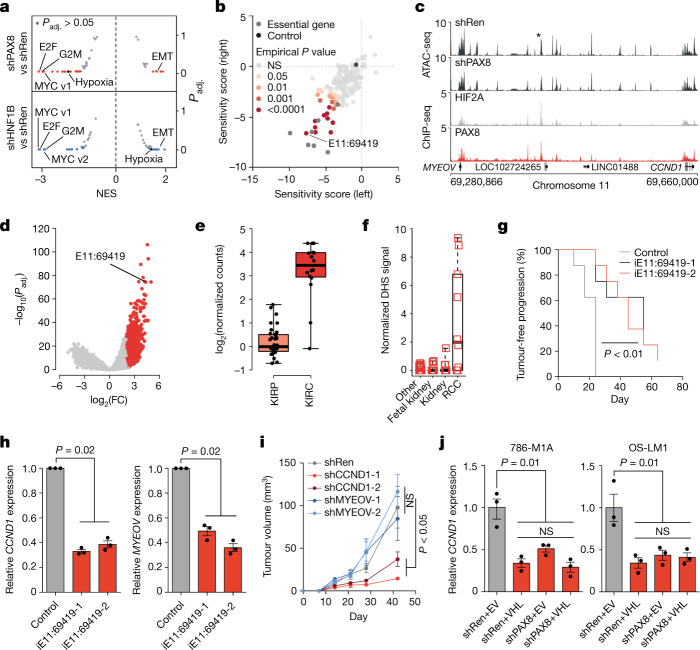
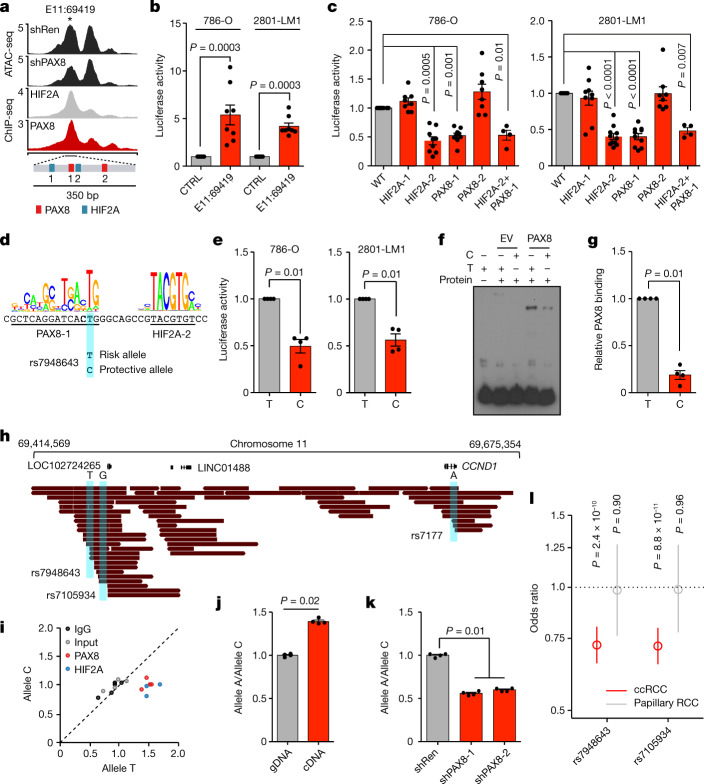
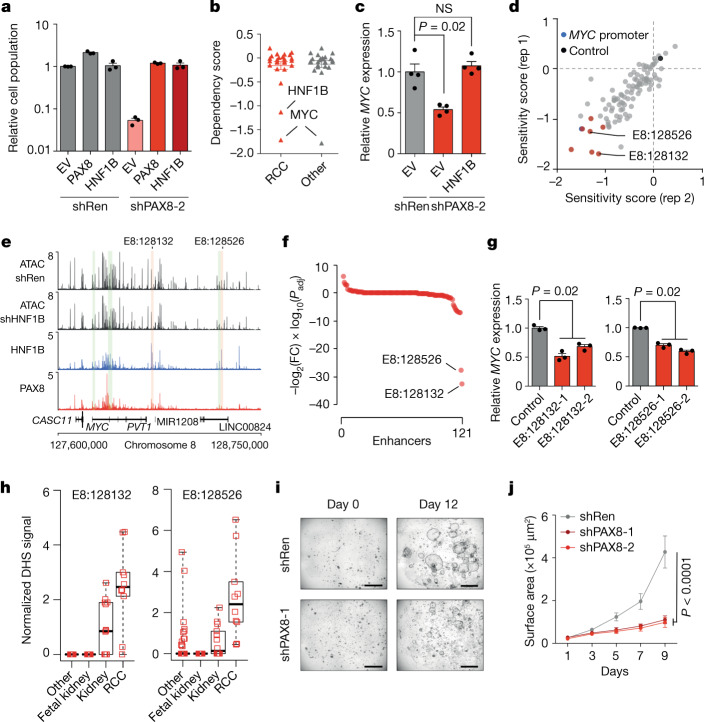
Large-scale human genetic data1-3 have shown that cancer mutations display strong tissue-selectivity, but how this selectivity arises remains unclear. Here, using experimental models, functional genomics and analyses of patient samples, we demonstrate that the lineage transcription factor paired box 8 (PAX8) is required for oncogenic signalling by two common genetic alterations that cause clear cell renal cell carcinoma (ccRCC) in humans: the germline variant rs7948643 at 11q13.3 and somatic inactivation of the von Hippel-Lindau tumour suppressor (VHL)4-6. VHL loss, which is observed in about 90% of ccRCCs, can lead to hypoxia-inducible factor 2α (HIF2A) stabilization6,7. We show that HIF2A is preferentially recruited to PAX8-bound transcriptional enhancers, including a pro-tumorigenic cyclin D1 (CCND1) enhancer that is controlled by PAX8 and HIF2A. The ccRCC-protective allele C at rs7948643 inhibits PAX8 binding at this enhancer and downstream activation of CCND1 expression. Co-option of a PAX8-dependent physiological programme that supports the proliferation of normal renal epithelial cells is also required for MYC expression from the ccRCC metastasis-associated amplicons at 8q21.3-q24.3 (ref. 8). These results demonstrate that transcriptional lineage factors are essential for oncogenic signalling and that they mediate tissue-specific cancer risk associated with somatic and inherited genetic variants.


Conflict of interest statement

The authors declare no competing interests.

Figures

Fig. 1
Fig. 1. Chromatin level interaction between the renal lineage factor PAX8 and oncogenic HIF2A in ccRCC.
a,b, Pooled CRISPR–Cas9 loss-of-function screen results of ccRCC cell lines (a) and non-ccRCC cell lines (b). Sensitivity score, log2 of the mean of the top three depleted sgRNAs per gene, two replicates per condition, at the end of the assay compared with the start of the assay. ccRCC dependencies are in red. CTRL, average of non-targeting controls. c, Overlap between cancer-type-specific ATAC-seq peaks in TCGA data and those with reduced accessibility after PAX8 and HNF1B depletion in ccRCC cells. Top axis, odds ratio of overlap (black), 95% confidence interval. Bottom axis, P value, one-sided Fisher’s exact test (red). d, Overlap between PAX8- and HIF2A-interacting proteins as determined by RIME in 786-M1A cells. e, Network presentation of physical connections between 89 shared nuclear proteins from HIF2A and PAX8 interactomes. Protein names are provided in Extended Data Fig. 4a. f, Heatmaps of HIF2A and PAX8 ChIP-seq signals from 786-M1A and OS-LM1 xenografts (three tumours each) across regions with strong PAX8–HIF2A co-binding (red), predominant HIF2A binding (blue) and predominant PAX8 binding (grey). Top panels show the average signal within each of the three categories in the same colours. g, HIF2A and PAX8 co-bound genomic regions with reduced accessibility following PAX8 depletion. Median ATAC-seq signal from 786-M1A cells expressing a control RNAi construct (shRen, N = 6) or PAX8-targeting RNAi constructs (shPAX8, N = 6). Median HIF2A and PAX8 ChIP-seq signals from 786-M1A and OS-LM1 xenografts, three tumours each. Asterisk indicates a region of interest. h, Fraction of PAX8 peaks (red) in all high-confidence open chromatin regions (all) and HIF2A ChIP-seq peaks in 786-M1A and OS-LM1 xenograft tumours. Asterisk indicates P < 1.0 × 10−300, two-sided Fisher’s exact test. Source data
Fig. 2
Fig. 2. PAX8–HIF2A interactions support oncogene activation in ccRCC.
a, Gene set enrichment analysis with MSigDB Hallmark gene sets on the effects of PAX8 and HNF1B depletion compared with a control RNAi construct (shRen). Two PAX8-targeting (shPAX8) and HNF1B-targeting (shHNF1B) RNAi constructs and cell lines (786-M1A and OS-LM1) were combined for each gene, respectively. Significantly changed gene sets are in colour (blue or red). EMT, epithelial-to-mesenchymal transition; NES, normalized enrichment score. b, Pooled in vivo CRISPRi screening. Normalized average depletion for the two most depleted constructs per region presented for 30 tumours in two groups (left versus right mouse flank). Essential genes, positive control genes. Control, average of non-targeting constructs. Empirical one-sided P values based on 10,000 permutations. c, Median ATAC-seq signals from shRen control (N = 6) and shPAX8 (N = 6) cells. Median HIF2A and PAX8 ChIP-seq signals from 786-M1A and OS-LM1 xenografts, three tumours each. Asterisk indicates E11:69419. d, Differential DNA accessibility. TCGA ATAC-seq data, 410 human tumours, 562,709 pan-cancer peaks. ccRCCs compared to all other tumour types by DESeq2. e, Normalized DNA accessibility at E11:69419, TCGA ATAC-seq data. ccRCC (KIRC), N = 16; papillary RCC (KIRP), N = 34. f, Normalized DNAse hypersensitivity (DHS) signal for E11:69419, 733 samples from different cell types. g, Tumour-free survival of mice inoculated with 786-M1A cells. iE11:69419, E11:69419 targeted by CRISPRi. log-rank test. N = 8 tumours for each group. h, RT–qPCR results of E11:69419 targeted by CRISPRi in 786-M1A cells. i, Subcutaneous tumour growth, 786-M1A cells. shRen (control RNAi construct), shCCND1-1 and shCCND1-2 (two RNAi constructs that target CCND1), N = 8; shMYEOV-1 and shMYEOV-2 (two RNAi constructs that target MYEOV), N = 10 tumours per group. Mean and s.e.m. Two-sided Kruskal–Wallis test. j, RT–qPCR results. EV, empty vector. For e and f, box plots show the median and interquartile range, and whiskers show the data range. For h and j, data points indicate independent RNA preparations (N = 3). Mean and s.e.m. Two-sided Kruskal–Wallis test. Source data
Fig. 3
Fig. 3. The ccRCC risk allele at rs7948643 increases PAX8-dependent activation of an oncogenic enhancer.
a, Chromosome 11:69,417,866-69,422,866, median shRen (N = 6) and shPAX8 (N = 6) ATAC-seq signals, and median 786-M1A and OS-LM1 xenograft (N = 3 tumours each) HIF2A and PAX8 ChIP-seq signals. Asterisk indicates E11:69419, with the relative orientation of HIF2A and PAX8 DNA-binding motifs highlighted. b, Reporter assay showing E11:69419 enhancer activity, fold change over control, arbitrary units. N = 8. c, Reporter assay showing the effect of mutated HIF2A and PAX8 sites on E11:69419 activity. 786-O: wild type (WT), N = 10; HIF2A-1, N = 8; HIF2A-2, N = 8; PAX8-1, N = 9; PAX8-2, N = 8; HIF2A-2+PAX8-1, N = 4. 2801-LM1: WT, N = 12; HIF2A-1, N = 9; HIF2A-2, N = 11; PAX8-1, N = 10; PAX8-2, N = 8; HIF2A-2+PAX8-1, N = 4. d, PAX8- and HIF2A-binding motifs at E11:69419, with the ccRCC risk-associated SNP rs7948643 highlighted. e, Reporter assay showing the effect of the T>C change at rs7948643 on E11:69419 activity. N = 4. f,g, Electrophoretic mobility shift assay. Representative image (f) and quantification (g) of independent experiments (N = 4). Protein from MDA-MB-231 cells expressing EV or PAX8, oligonucleotides with the T or C allele at rs7948643. h, Long DNA reads used for phasing of the 11q13.3 RCC risk allele in RCC-JF cells. i, Allele-specific HIF2A, PAX8 or IgG ChIP qPCR in RCC-JF cells at rs7948643, normalized to allele ratio of input control. Data points indicate independent immunoprecipitation reactions. HIF2A, N = 3; other conditions N = 5. j, Allele-specific RT–qPCR results of rs7177 in RCC-JF cells, normalized to the allele ratio in genomic DNA (gDNA). k, Allele-specific RT–qPCR results of rs7177 in RCC-JF cells after PAX8 depletion, normalized to shRen control. l, Subtype-specific RCC risk associated with rs7948643 and rs7105934. Minor allele frequency of 0.07 for both variants. ccRCC, 5,648 cases and 15,010 controls; papillary RCC, 563 cases and 14,840 controls. Odds ratio shown, with whiskers representing 95% confidence intervals. For b, c and e, data points indicate the average of three technical replicates, independent transfections. For j and k, data points indicate independent RNA preparations (N = 4). For b, c, e, g, j and k, mean and s.e.m. shown. Two-sided Kruskal–Wallis test. Source data
Fig. 4
Fig. 4. Co-option of a normal lineage factor programme for oncogenesis in ccRCC-associated 8q21.3-q24.3 amplifications.
a, Competitive proliferation assay against EV-shRen control cells. Relative proportion of the indicated cells on day 12 compared with day 0. 786-M1A cells. Data points indicate technical replicates (N = 3). Mean and s.e.m. b, Average dependency score (CERES score) in the DepMap dataset for 25 shared genes downregulated by PAX8 and HNF1B inhibition. c, RT–qPCR results of 786-M1A cells. Data points indicate independent RNA preparations (N = 4). Mean and s.e.m. Two-sided Kruskal–Wallis test. d, Pooled CRISPRi-based proliferative screen for putative MYC enhancers in 786-M1A cells. Normalized average depletion for the two most depleted constructs per region presented for the two technical replicates (rep 1 and 2). Control, average of non-targeting control constructs. e, Median ATAC-seq signals in 786-M1A shRen (N = 5) and shHNF1B (N = 6) cells, and PAX8 and HNF1B ChIP-seq signals in 786-M1A and OS-LM1 xenografts (3 tumours each) for the MYC locus. Enhancers that support ccRCC proliferation are highlighted (enhancers containing a HNF1B motif in red, others in green). f, Effect of HNF1B depletion on chromatin accessibility at the enhancers in the MYC locus. Fold changes and adjusted two-sided P values derived by DESeq2. g, RT–qPCR results following CRISPRi-mediated targeting of E8:128132 and E8:128526 in 786-M1A cells. Data points indicate independent RNA preparations (N = 3). Mean and s.e.m. Two-sided Kruskal–Wallis test. h, Normalized DHS signal for E8:128132 and E8:128526, 733 samples from different cell types. Box plots show the median and interquartile range, and whiskers the data range. i, j, Growth of normal human renal epithelial organoids with and without PAX8 depletion. Representative images (i) and quantification (j). Scale bar, 1 mm. N = 21 random growing organoids per condition and time point. Mean and s.e.m. Two-sided Kruskal–Wallis test. Source data
Extended Data Fig. 1
Extended Data Fig. 1. PAX8 and HNF1B are transcriptional dependencies in ccRCC.
a. PAX8 and HNF1B dependency (CERES score) across 788 cell lines in the DepMap data set. b. CRISPR-Cas9-based competitive proliferation assay against non-targeting sgRNA control cells in different cell lines. Data points, technical replicates (N = 3). Mean and standard deviation. c. Western blot showing PAX8 and HNF1B expression in the cells used for competition assays in panel (b). d. Correlation between protein expression in panel (c) and relative cell abundance in panel (b). PCC, Pearson’s correlation coefficient. e. CRISPRi-based competition assay in 786-M1A cells. Data points, technical replicates (N = 3). Mean and standard deviation. Two-sided Kruskal-Wallis. f. Western blot showing PAX8 and HNF1B expression in the cells used for competition assays in panel (e). g. Western blot showing PAX8 and HNF1B expression in the cells used for in vivo tumour assays in panel (h). h. Subcutaneous tumour growth in athymic mice. PAX8 KO: sgCTRL, N = 8; sgPAX8-4 and sgPAX8-8, N = 6; HNF1B KO: N = 10 tumours for each group. Mean and SEM. Two-sided Kruskal-Wallis test. Source data
Extended Data Fig. 2
Extended Data Fig. 2. PAX8 and HNF1B expression patterns in normal kidney and ccRCC.
a. PAX8 and HNF1B mRNA expression as determined by RNA-seq in the GTex data set of normal tissues and the TCGA cancer data set. Median expression shown for each cancer and tissue type. b. PAX8 and HNF1B immunohistochemistry in ccRCC and normal kidney (representative images from TMA in panel e). Scale bar, 100μm. c. Western blot showing PAX8 and HNF1B expression in cell lines (N = 16 biological replicates of cells of renal origin, N = 3 biological replicates of cells of other origins; representative images, N = 2 technical replicates). d. PAX8 and HNF1B expression in ccRCCs when compared to normal kidney in the TCGA data set (Normal N = 72, T1 N = 252, T2 N = 66, T3-4 N = 189). Mean and SEM. Two-sided Kruskal-Wallis with Dunn’s multiple comparison test. e. Immunohistochemistry (IHC) for PAX8 and HNF1B expression in a tissue microarray of ccRCCs. N = 350 (PAX8), N = 361 (HNF1B). f. Unsupervised UMAP analysis of scRNA-seq data from fetal human kidney. Different cell types labelled in different colours. g. PAX8 and HNF1B expression across different cell types in the fetal human kidney. h. PAX8 and HNF1B expression in the cell types identified in scRNA-seq data from fetal human kidney. Source data
Extended Data Fig. 3
Extended Data Fig. 3. PAX8 and HNF1B support chromatin accessibility at distal enhancers.
a. Relative PAX8 and HNF1B mRNA expression as determined by qRT-PCR in 786-M1A cells. Data points, independent RNA preps (shPAX8 N = 4, shHNF1B N = 3). Mean and SEM. Two-sided Kruskal-Wallis test. b. Western blot showing PAX8 and HNF1B expression in 786-M1A cells (representative image, N = 2). c. ATAC-seq data analysis identifying genomic regions with altered accessibility upon shRNA-mediated PAX8 and HNF1B depletion in 786-M1A cells (two shRNAs with three replicates each). Adjusted two-sided p-values and fold changes derived by DESeq2. d. Heatmap showing ATAC-seq signal in the indicated cell lines for regions with reduced accessibility upon PAX8 and HNF1B depletion, respectively (three replicates for each shRNA). e-f. The most significant de novo DNA motif enriched in the peak set with reduced accessibility upon PAX8 (e) and HNF1B (f) depletion. g. Distribution of ATAC-seq peaks that change upon PAX8 or HNF1B depletion in relation to known transcripts. TTS, transcription termination site. h. Overlap between the peak sets with reduced accessibility upon PAX8 and HNF1B depletion in ccRCC cells and peaks sets characteristic of normal kidney and renal cancer identified by DNAse I hypersensitivity mapping in ref. . Top axis, odds ratio of overlap (black), 95% confidence interval. Bottom axis, p-value, one-sided Fisher’s exact test (red). i. Enrichment of known DNA motifs in the peak set that shows reduced accessibility upon PAX8 depletion. j. Enrichment of known DNA motifs in the peak set that shows reduced accessibility upon HNF1B depletion. k. Enrichment of known DNA motifs in the peak set that shows increased accessibility upon PAX8 depletion. l. Enrichment of known DNA motifs in the peak set that shows increased accessibility upon HNF1B depletion. m–n. Mean normalised counts within ccRCC (KIRC)-specific (m) and KIRP-specific (n) ATAC-seq regions in comparison to all other cancer types in the TCGA data set. P-values indicate the significance of enrichment of the de novo PAX8 and HNF1B motifs in the ccRCC and KIRP-specific peak sets. Boxplot, median and interquartile range. Whiskers, data range. N = 26,633 regions for KIRC; N = 68,966 regions for KIRP. Source data
Extended Data Fig. 4
Extended Data Fig. 4. Interaction between PAX8 and HIF2A in ccRCC.
a. Network presentation of the highest confidence experimental and database-derived physical connections between the 89 shared nuclear proteins from HIF2A and PAX8 interactomes as determined by String 11.0. Shading reflects MCL clustering. Isolated nodes are removed. b. PAX8 locus. Median ATAC-seq signal from shRen control (N = 6) and shPAX8 (N = 6) cells. Median HIF2A and PAX8 ChIP-seq signal from 786-M1A and OS-LM1 xenografts, 3 tumours each. c. Overlap of HIF2A and PAX8 ChIP-seq peaks in 786-M1A (top) and OS-LM1 (bottom) cells. d. Enrichment of known DNA motifs in the 1,948 peaks with most significantly increased DNA accessibility in ccRCCs when compared to KIRP tumours in the TCGA data set (Fold change 2, two-sided padj < 0.001 as determined by DESeq2). e. The most significant de novo DNA motif enriched in the ccRCC-specific peaks as described in panel (d). f. Distribution of distances between the centres of PAX8 and HIF2A DNA motifs in ccRCC-specific ATAC-seq regions. Cartoons in each quadrant demonstrate the motif orientation. The 18bp distance seen in the common ERV1 endogenous retrovirus highlighted. g. Co-immunoprecipitation with antibodies targeting HIF2A and PAX8 in C-M1AHIF2A-/- cells with HIF2A reintroduction (PAX8-HIF2A interaction, N = 3 independent IP reactions; HIF2A-HIF1B interaction N = 1). h. Global gene expression changes by RNA-seq in 786-M1A and OS-LM1 ccRCC cells upon PAX8 and HNF1B depletion when compared to non-targeting controls. Pooled analysis of both cell lines and targeting constructs. Adjusted two-sided p-value derived by DESeq2. i. Pseudotime analysis of the different stages of the proximal renal epithelium lineage in fetal human kidney for the cell types shown in Extended Data Fig. 2f. j. Expression of PAX8, HNF1B and the respective gene signatures from ccRCC cell lines as a function of the proximal renal epithelium lineage pseudotime in the fetal human kidney. Source data
Extended Data Fig. 5
Extended Data Fig. 5. In vivo CRISPRi screen for oncogenic HIF2A enhancers.
a. Western blot showing doxycycline-dependent HIF2A expression in C-M1AHIF2A-/- cells (representative image, N = 3). b. Proliferation of C-M1AHIF2A-/- cells with or without HIF2A. ΔbHLH-HIF2A, DNA-binding domain HIF2A mutant. Data points, mean of three replicates per condition, SEM. c. Tumour-free survival of athymic mice upon inoculation of C-M1AHIF2A-/- cells with or without doxycycline-dependent HIF2A reintroduction. ΔbHLH-HIF2A, DNA-binding domain HIF2A mutant. Logrank test. EV (3 x 10⁵ cells), N = 10; EV (5 x 10⁵ cells), N = 9; HIF2A (3 x 10⁵ cells), N = 20; HIF2A (5 x 10⁵ cells), N = 51; ΔbHLH-HIF2A (5 x 10⁵ cells), N = 10. d–e. HIF2A protein expression at different time points after doxycycline withdrawal as determined by immunohistochemistry in xenograft tumours formed by C-M1AHIF2A-/- cells with doxycycline-inducible HIF2A reintroduction. Mean and SEM. 0h, 72h, N = 4; 28h N = 3; 24 h, 48 h, 32 h, N = 6 tumour regions. f. mRNA expression of 205 genes identified as downregulated at 32h post doxycycline withdrawal with sustained low expression at 72h post doxycycline withdrawal in vivo in C-M1AHIF2A-/- cells. Red line shows HIF2A expression. Boxplot, median and interquartile range. Whiskers, data range. g. Hierarchical clustering based on Pearson’s correlation coefficient of the in vivo CRISPRi screening data. C1 and C2, control samples collected on day 0 before inoculation into mice. PLAS, plasmid DNA. T1-T30, individual tumours. h. Average distribution of sgRNA construct abundance calculated based on all tumours in relation to initial abundance in the plasmid library (red). Expected distribution (grey) based on 10,000 permutations. i. Percentage of constructs recovered in tumours from in vivo CRISPRi screen. j. HIF2A and PAX8 ChIP-seq tracks for the loci of the top enhancer dependencies from Fig. 2b. HIF2A and PAX8 ChIP-seq tracks overlapped from 786-M1A and OS-LM1 xenografts, 3 tumours each. Source data
Extended Data Fig. 6
Extended Data Fig. 6. CCND1 expression depends on PAX8 and HIF2A in ccRCC cells.
a. CCND1, MYEOV and non-essential gene (ADAM18) dependency (CERES score) across 12 ccRCC cell lines in the DepMap data set. Two-sided Kruskal-Wallis test with Dunn’s multiple comparison test. Boxplot, median and interquartile range. Whiskers, min-max. b. Relative CCND1 and MYEOV expression as determined by qRT-PCR in 786-M1A cells. c. Relative CCND1 expression as determined by qRT-PCR following PAX8 knockdown in 786-M1A and OS-LM1 cells. d. PAX8 and CCND1 protein expression following PAX8 knock-down in 786-M1A and OS-LM1 cells as determined by Western blotting (N = 2 biological replicates in different cell lines, N = 1 technical replicate). e–f. Relative mRNA expression as determined by qRT-PCR. g. VHL, CCND1 and B-actin protein expression as determined by Western blotting in 786-M1A cells (N = 1). h–i. Relative mRNA expression as determined by qRT-PCR. EV, empty vector. j. HIF1A, CCND1 and B-actin protein expression as determined by Western blotting in OS-LM1 cells (representative image, N = 2). k–n. Relative mRNA expression as determined by qRT-PCR. EV, empty vector. o. Correlation between HIF2A and CCND1, and PAX8 and CCND1 mRNA levels, respectively, in the TCGA ccRCC data set. PCC, Pearson’s correlation coefficient. b,c,e,f,h,i,k,l,m,n. Data points, independent RNA preps (N = 3). Mean and SEM. Two-sided Kruskal-Wallis test. Source data
Extended Data Fig. 7
Extended Data Fig. 7. Transcriptional activation of E11:69419 by PAX8 and HIF2A.
a. Luciferase reporter assay showing E11:69419 activity in 786-O cells with and without HIF2A inhibition. Data points, average of three technical replicates, independent transfections (N = 3). Mean and SEM. Two-sided Kruskal-Wallis test. b. PAX8 protein expression in MDA-MB-231 cells used in EMSA in Fig. 3f, g as determined by Western blotting (N = 1). c. Relative ccRCC risk and protective allele fractions at E11:69419 in ATAC-seq data from three replicates of RCC-JF cells (grey) and four heterozygous human ccRCC samples (red). d. VHL-resistant HIF2A protein expression in HK2 cells as determined by Western blotting (representative image, N = 2). e. Luciferase reporter assay showing E11:69419 activity in HK2 cells from panel (d). Data points, average of three technical replicates, independent transfections (EV N = 4, HIF2A N = 7). Mean and SEM. Two-sided Kruskal-Wallis test. f. Median ATAC-seq signal from RCC-JF cells and HK2 cells from panel (d) six weeks after transduction with HIF2A. Three replicates in each condition. g. Relative mRNA expression as determined by qRT-PCR in HK2 cells. Data points, independent RNA preps (N = 3). Mean and SEM. Two-sided Kruskal-Wallis test. h. Graphical representation of the long DNA reads used for phasing of the RCC protective allele in the rs7948643-heterozygous ccRCC cell line RCC-JF. Variants of interest highlighted. i-j. ChIP qPCR at E11:69419 and PAX8-independent region E14:34035. 786-M1A cells with and without PAX8 depletion immunoprecipitated with HIF2A antibodies or IgG (i) and C-M1AHIF2A-/- cells with and without HIF2A immunoprecipitated with PAX8 antibodies or IgG (j). Data points, independent IP reactions (N = 3). Mean and SEM. Two-sided Kruskal-Wallis test. k. Relative PAX8 mRNA expression as determined by qRT-PCR in RCC-JF cells. Data points, independent RNA preps (N = 3). Mean and SEM. Two-sided Kruskal-Wallis test. l. ChIP qPCR at E11:69419 and at a PAX8-bound HNF1B enhancer (E17:37813) in papillary RCC cells immunoprecipitated with PAX8 antibodies or IgG. Data points, independent IP reactions (N = 3). Mean and SEM. Source data
Extended Data Fig. 8
Extended Data Fig. 8. Genetic variants at 11q13.3 are association with increased ccRCC risk.
Regional association plots for ccRCC (top) and papillary RCC (bottom). D’/R2 estimated and plot generated by LDassoc. Regulatory potential estimated by RegulomeDB. Recombination rate overlaid on the plot. Blue line, genome-wide significance (P < 5 x 10⁸). Rug plots show variant density, nearby genes and transcripts plotted at the bottom.
Extended Data Fig. 9
Extended Data Fig. 9. PAX8 controls HNF1B expression in ccRCC.
a–b. Relative PAX8 and HNF1B mRNA expression as determined by qRT-PCR. c. PAX8 and HNF1B protein expression as determined by Western blotting. Doxycycline-inducible shRNA constructs targeting PAX8 (N = 6 biological replicates across different cell lines, N = 1 technical replicates for each condition). d. Correlation between PAX8 and HNF1B expression in the samples from panel (c). PCC, Pearson’s correlation coefficient. e. Relative PAX8 and HNF1B mRNA expression as determined by qRT-PCR in 786-M1A cells. f. Competitive proliferation assay against EV-shRen control cells in the UOK101 and OS-LM1 ccRCC models. Relative proportion of the indicated cells on day 12 when compared to day 0. Data points, technical replicates (N = 3). Mean and SEM. g. Western blot showing PAX8 and HNF1B expression in the OS-LM1 cells used in the competition assay in panel (N = 3 biological replicates across different cell lines, N = 1 technical replicate) (f). h. Competitive proliferation assay against EV-sgCTRL control condition in the 786-M1A cells. Cells expressing sgHNF1B-8 were transduced with either an EV control construct or a construct expressing HNF1B* where the sgHNF1B-8 target site is mutated. Data points, technical replicates (N = 3), SEM. Two-sided Kruskal-Wallis test. i. HNF1B expression by Western blotting in the cells used for competition assays in panel (N = 1 technical replicate) (h). a,b,e. Data points, independent RNA preps (shPAX8 N = 4, shHNF1B N = 3). Mean and SEM. Two-sided Kruskal-Wallis test. Source data
Extended Data Fig. 10
Extended Data Fig. 10. The PAX8-HNF1B module regulates MYC expression in ccRCC cells.
a. Dependency score (CERES score) in the DepMap CRISPR-Cas9 screen data set for 41 shared genes upregulated by PAX8 or HNF1B inhibition. b. Relative MYC mRNA expression as determined by qRT-PCR. Data points, independent RNA preps (shPAX8 N = 4, shHNF1B N = 3). Mean and SEM. Two-sided Kruskal-Wallis test. c-e. Western blot in 786-M1A, OS-LM1 and RFX-631 cells (N = 3 and N = 2 biological replicates across different cell lines for shPAX8 and shHNF1B, respectively; N = 1 technical replicate for each biological replicate). f. Relative MYC mRNA expression as determined by qRT-PCR in the 786-M1A and OS-LM1 cells used in the competition assay in panel (g). Data points, independent RNA preps (N = 3). Mean and SEM. Two-sided Kruskal-Wallis test. g. Competitive proliferation assay against shRen control cells. Data points, technical replicates (N = 3), standard deviation. Two-sided Kruskal-Wallis test. Source data
Extended Data Fig. 11
Extended Data Fig. 11. Lineage factor dependent MYC expression in normal renal epithelial cells.
a. Fluorescence in situ hybridisation in one nucleus of 786-M1A cells (representative image, N = 4). Blue, DAPI staining; green, chromosome 8q telomere; orange MYC 5’. b–c. ATAC-seq tracks overlapped for 786-M1A cells upon HNF1B depletion. shRen, N = 5; shHNF1B, N = 6. d. Inhibitory effect of PAX8 depletion on chromatin accessibility at the enhancers in the MYC locus. Fold changes and adjusted two-sided p-values derived by DESeq2. e. Competitive proliferation assay against shRen control cells in HK2 cells. Data points, technical replicates (N = 3), standard deviation. Two-sided Kruskal-Wallis test. f–j. Relative mRNA expression as determined by qRT-PCR. Data points, independent RNA preps (N = 3). Mean and SEM. Two-sided Kruskal-Wallis test. k. Summary. PAX8 is required for tissue-specific oncogenic programmes by integrating signals from inherited and acquired genetic alterations: inactivating mutations in VHL and the common ccRCC predisposition SNP rs7948643 upstream of CCND1, as well as metastasis-associated 8q21.3-q24.3 amplifications upstream of MYC, which co-opt the physiological PAX8-HNF1B program that supports MYC expression in proliferating normal renal epithelial cells. Source data

Comment in

References

    1. Campbell PJ, et al. Pan-cancer analysis of whole genomes. Nature. 2020;578:82–93. - PMC - PubMed
    1. Priestley P, et al. Pan-cancer whole-genome analyses of metastatic solid tumours. Nature. 2019;575:210–216. - PMC - PubMed
    1. Fletcher O, Houlston RS. Architecture of inherited susceptibility to common cancer. Nat. Rev. Cancer. 2010;10:353–361. - PubMed
    1. Purdue MP, et al. Genome-wide association study of renal cell carcinoma identifies two susceptibility loci on 2p21 and 11q13.3. Nat. Genet. 2011;43:60–65. - PMC - PubMed
    1. Scelo G, et al. Genome-wide association study identifies multiple risk loci for renal cell carcinoma. Nat. Commun. 2017;8:15724. - PMC - PubMed

MeSH terms

Substances