. 2022 Jun;606(7915):812-819.
doi: 10.1038/s41586-022-04803-0. Epub 2022 Jun 8.

Cohesin-mediated loop anchors confine the locations of human replication origins

Affiliations

Cohesin-mediated loop anchors confine the locations of human replication origins

Daniel J Emerson et al. Nature. 2022 Jun.

Abstract

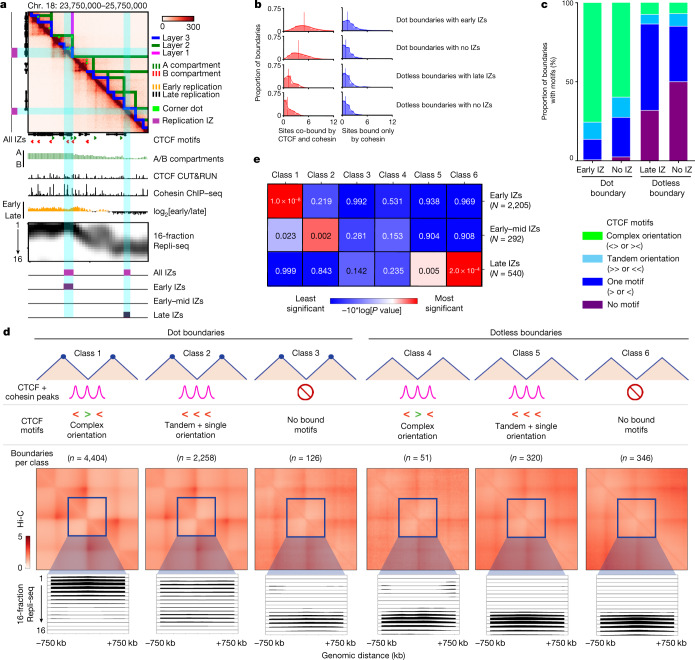
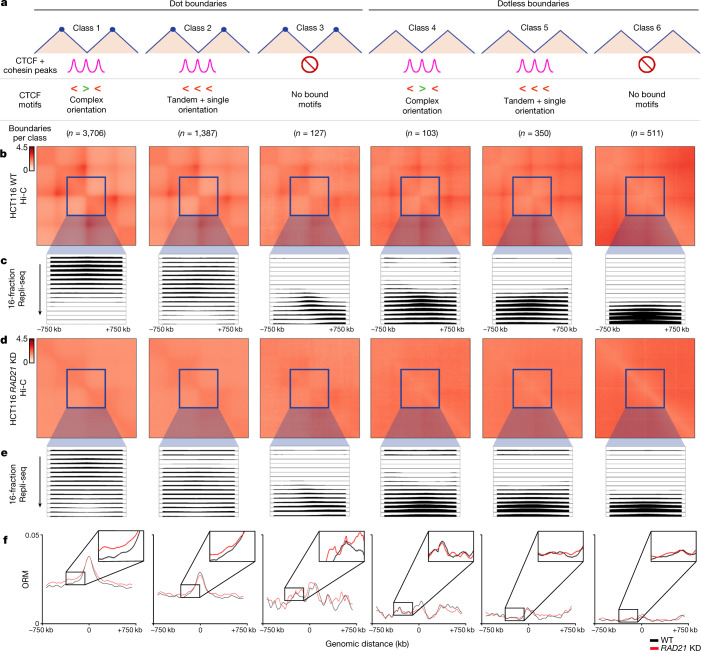
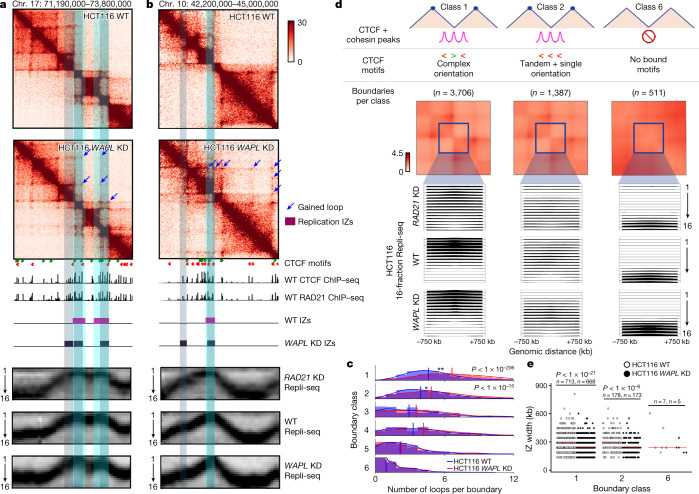
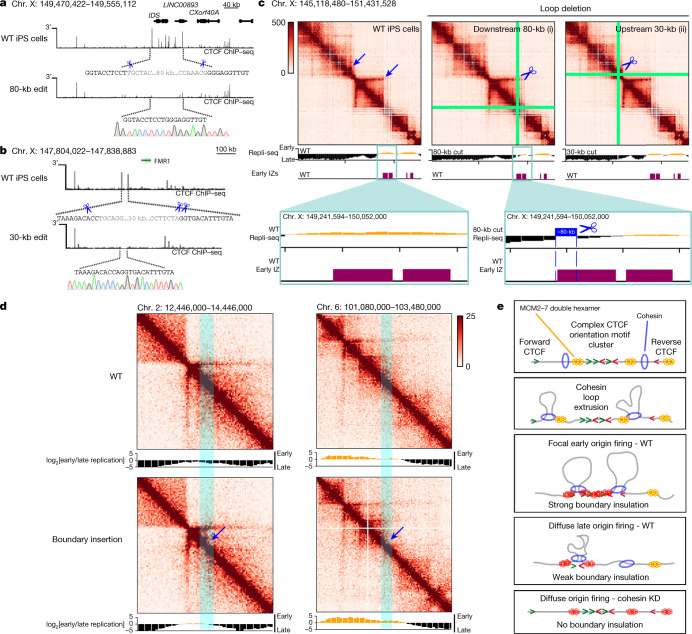
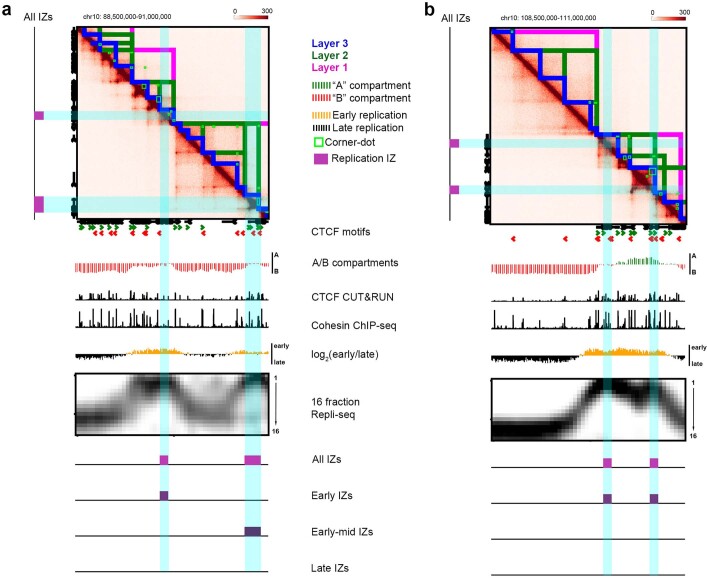
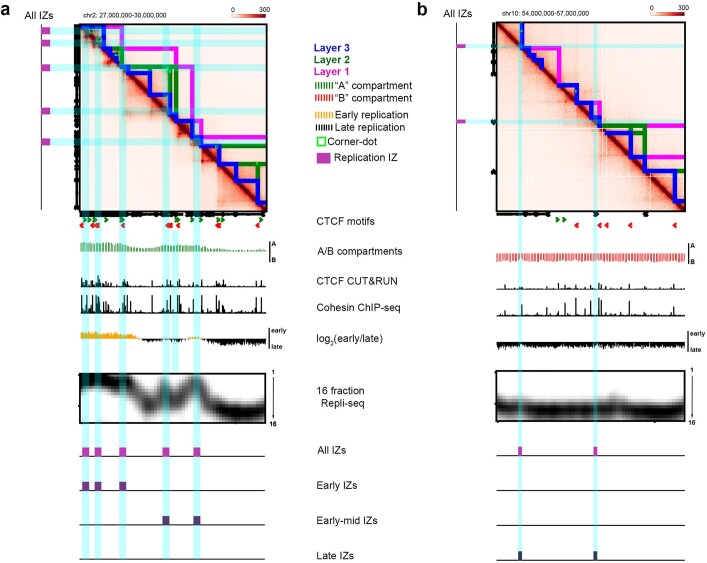
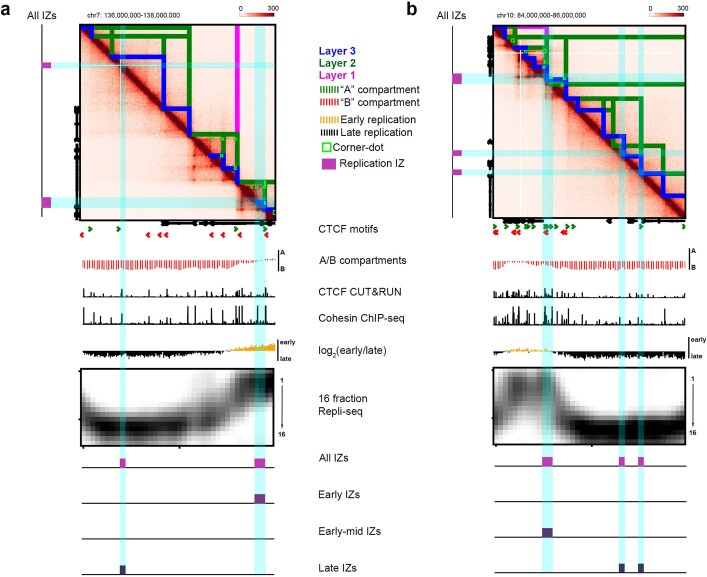
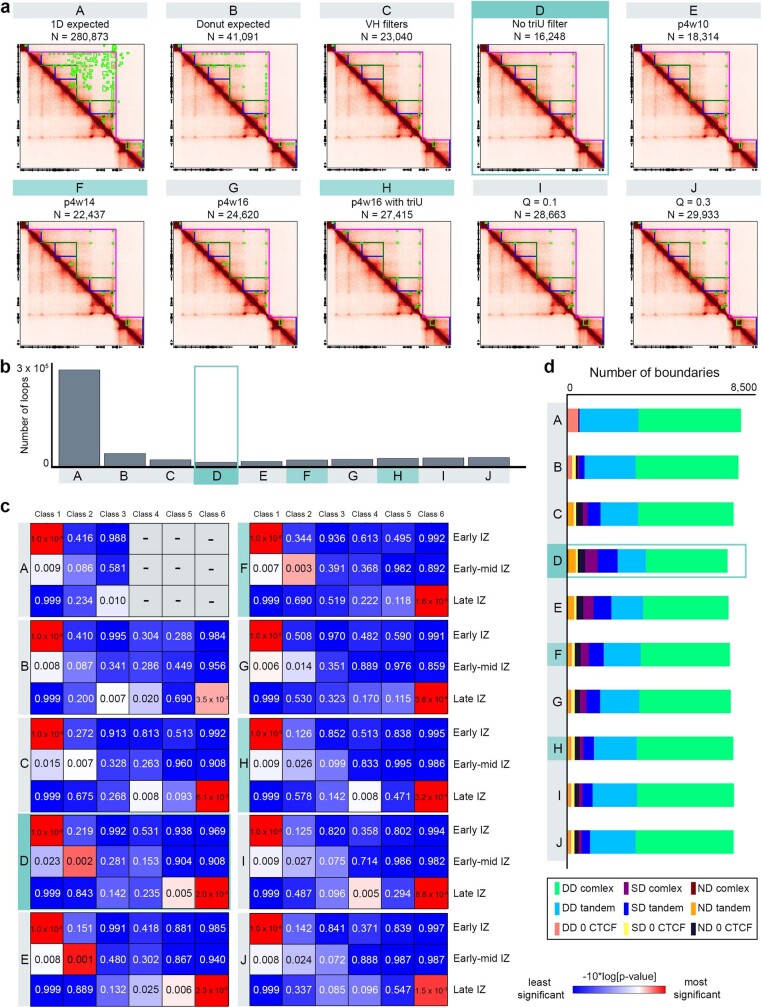
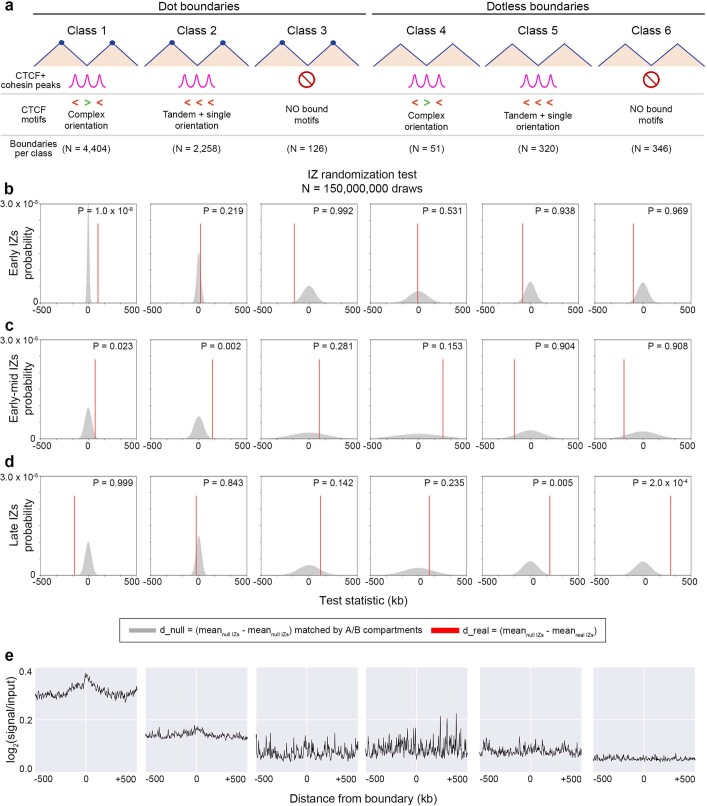
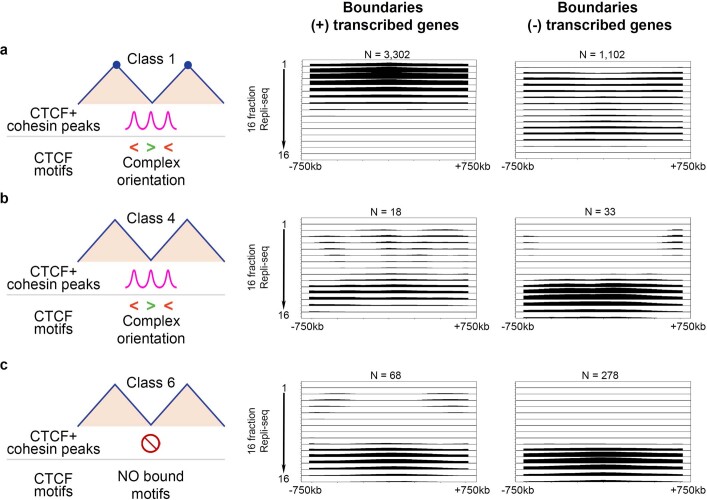
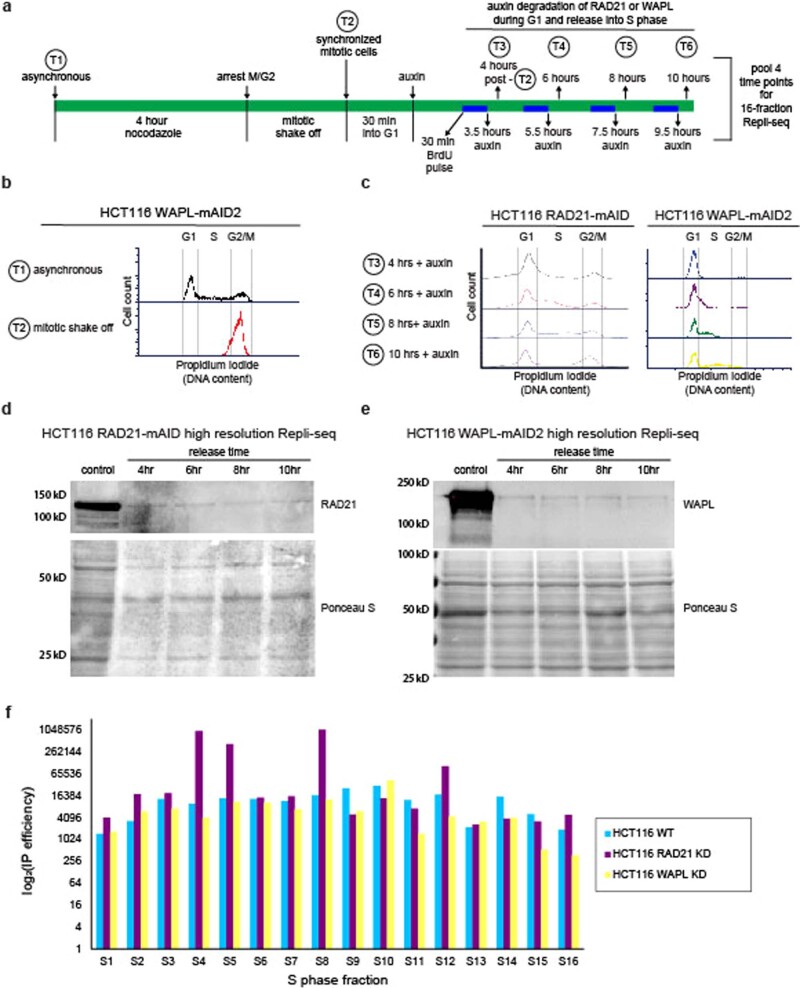
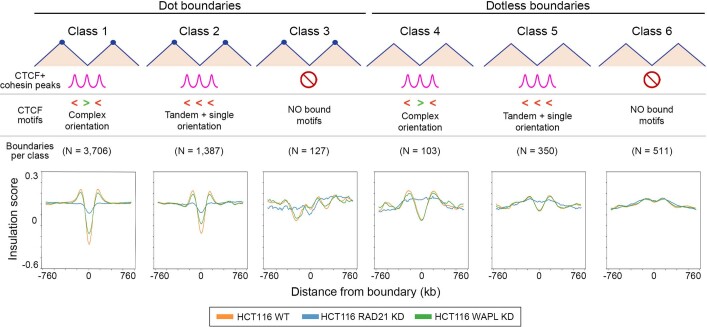
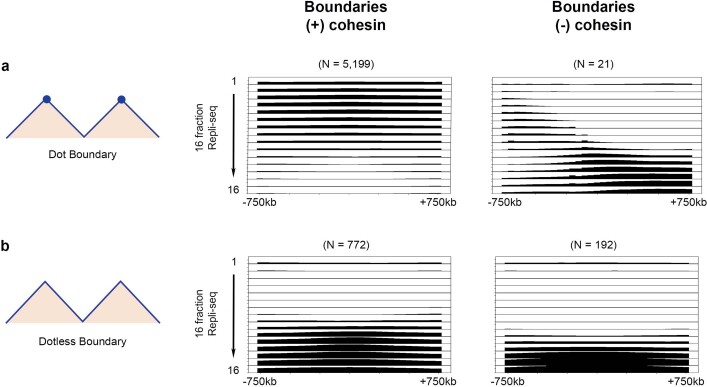
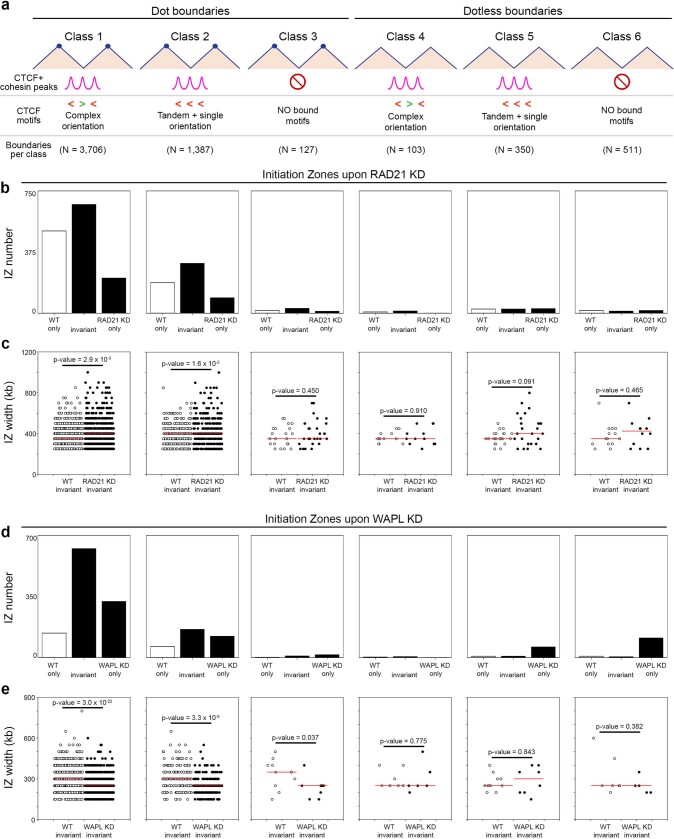
DNA replication occurs through an intricately regulated series of molecular events and is fundamental for genome stability1,2. At present, it is unknown how the locations of replication origins are determined in the human genome. Here we dissect the role of topologically associating domains (TADs)3-6, subTADs7 and loops8 in the positioning of replication initiation zones (IZs). We stratify TADs and subTADs by the presence of corner-dots indicative of loops and the orientation of CTCF motifs. We find that high-efficiency, early replicating IZs localize to boundaries between adjacent corner-dot TADs anchored by high-density arrays of divergently and convergently oriented CTCF motifs. By contrast, low-efficiency IZs localize to weaker dotless boundaries. Following ablation of cohesin-mediated loop extrusion during G1, high-efficiency IZs become diffuse and delocalized at boundaries with complex CTCF motif orientations. Moreover, G1 knockdown of the cohesin unloading factor WAPL results in gained long-range loops and narrowed localization of IZs at the same boundaries. Finally, targeted deletion or insertion of specific boundaries causes local replication timing shifts consistent with IZ loss or gain, respectively. Our data support a model in which cohesin-mediated loop extrusion and stalling at a subset of genetically encoded TAD and subTAD boundaries is an essential determinant of the locations of replication origins in human S phase.


Conflict of interest statement

The authors declare no competing interests.

Figures

Fig. 1
Fig. 1. High-efficiency IZs localize specifically to corner-dot TAD/subTAD boundaries with high-density arrays of CTCF + cohesin-binding sites in complex orientations.
a, A Hi-C map from H1 human ES cells for the locus chromosome (chr.) 18: 23.75 Mb–25.75 Mb, hg38, showing TADs, subTADs, loops, CTCF motifs, A/B compartments, CTCF cleavage under targets and release using nuclease (CUT&RUN), cohesin chromatin immunoprecipitation with sequencing (ChIP–seq), two-fraction Repli-seq, 16-fraction Repli-seq and IZs. b, Distribution of the number of sites co-bound by CTCF and cohesin (red) or bound only by cohesin (blue) per boundary for: dot boundaries colocalized with early IZs (n = 2,200); dot boundaries colocalized with no IZs (n = 4,087); dotless boundaries colocalized with late IZs (n = 66); and dotless boundaries colocalized with no IZs (n = 628). c, Proportion of boundaries with no CTCF motif, one single CTCF motif, CTCF motifs in a tandem orientation, and CTCF motifs in a complex divergent or convergent orientation. Boundaries are stratified into dot and dotless boundaries with either early/late IZs or no IZs. d, Top: boundary classification as detailed in the Supplementary Methods and Supplementary Table 7. Middle: aggregate peak analysis of the average observed/expected interaction frequency of the domains centred on each boundary classification. Bottom: averaged 16-fraction Repli-seq signal for each S-phase fraction centred on boundaries ±750 kb. Boundaries, TADs and Repli-seq data were normalized to the same genomic length scale. Boundary numbers are provided only for autosomal chromosomes. e, We computed right-tailed, one-tailed empirical P values using a randomization test with early-, early–mid- and late-S-phase IZs and size- and A/B compartment-matched null IZs (Supplementary Methods).
Fig. 2
Fig. 2. Loss of cohesin-mediated TADs/subTADs severely disrupts the genomic placement of DNA replication IZs.
a, Boundary classification in HCT116 wild-type (untreated HCT116 RAD21–mAID) cells conducted as in human ES cells (Fig. 1d) with boundary counts as listed in Supplementary Table 14. The boundary numbers in the figure are provided for autosomal chromosomes alone. b,d, Aggregate peak analysis of the Hi-C observed/expected average interaction frequency of the domains centred on each boundary classification in HCT116 wild-type (WT; untreated HCT116 RAD21–mAID; b) and HCT116 RAD21-knockdown (KD; auxin-treated HCT116 RAD21–mAID; d) cells after cohesin degradation with auxin treatment. The Hi-C source data are from ref. . c,e, High-resolution 16-fraction Repli-seq data in wild-type HCT116 (WT; untreated HCT116 RAD21–mAID; c) and HCT116 RAD21-knockdown (KD; auxin-treated HCT116 RAD21–mAID; e) cells. Each row represents a temporal fraction from S phase, with 16 rows/fractions in total. The Repli-seq signal plotted represents an average across all boundaries in a particular class for that fraction (y-axis) in 50-kb bins across a ±750-kb genomic distance centred on the midpoint of the boundaries (x-axis). Sample sizes for each class are shown in a. f, ORM data for wild-type (untreated HCT116 RAD21–mAID; black) and RAD21-knockdown (auxin-treated HCT116 RAD21–mAID; red) cells.
Fig. 3
Fig. 3. Gain of looping with WAPL degradation narrows the genomic placement of early IZs at dot boundaries with a complex CTCF motif orientation.
a,b, Hi-C maps from wild-type HCT116 (WT; untreated HCT116 WAPL–mAID2) and HCT116 WAPL-knockdown (KD; auxin-treated HCT116 WAPL–mAID2) cells for the loci chromosome 17: 71.19–73.8 Mb, hg38 (a) and chromosome 10: 42.2–45 Mb, hg38 (b). The tracks show CTCF motifs, CTCF ChIP–seq, RAD21 ChIP–seq, high-resolution 16-fraction Repli-seq and IZs. c, Distribution of loops per boundary for each of the six boundary classes. Vertical lines demarcate mean number of loops per boundary within each sample and boundary class. Two-tailed Mann–Whitney U-test between HCT116 WAPL-knockdown and HCT116 wild-type cells for class 1 P = 2.0 × 10−207 and class 2 P = 1.2 × 10−16. d, Averaged Repli-seq for each of the 16 fractions in a ±750-kb window at boundary classes 1, 2 and 6 as detailed in the Supplementary Methods and Supplementary Table 14. Boundary numbers are provided in the figure for autosomal chromosomes alone. Each Repli-seq row represents a temporal fraction from S phase, there are 16 rows/fractions, and the Repli-seq signal plotted represents an average across all boundaries in a particular class for that fraction (y-axis) in 50-kb bins across a ±750-kb genomic distance centred on the midpoint of boundaries (x-axis). e, Width of all IZs colocalized with boundary classes 1, 2 and 6. Two-tailed Mann–Whitney U comparing HCT116 wild-type to HCT116 WAPL-knockdown cells for class 1 P = 3.0 × 1022 and class 2 P = 3.3 × 109.
Fig. 4
Fig. 4. Targeted perturbation leading to gain and loss of structural boundaries can deterministically shift replication timing from early to late S phase.
a, Schematic showing a CRISPR-mediated 80-kb deletion encompassing the IDS gene (coordinates of deletion: hg38, chromosome X: 149,470,422–149,555,112). b, Schematic showing a CRISPR-mediated 30-kb deletion encompassing two CTCF sites approximately 100 kb upstream from the FMR1 gene (coordinates of deletion: hg38, chromosome X: 147,804,022–147,838,883). CTCF ChIP–seq tracks for wild-type induced pluripotent stem (iPS) cells and the edited clone are shown. Scissors represent the location of the cut sites verified with Sanger sequencing. c, 5C heatmaps (chromosome X: 145,118,480–151,431,528, hg38) and two-fraction Repli-seq tracks in wild-type iPS cells, and iPS cells with an 80-kb (i) or a 30-kb (ii) loop anchor deletion. Tracks for IZs in human ES cells are overlaid. d, Gain of boundary Hi-C and Repli-seq at chromosome 2: ≈13M (hg19) and chromosome 6: ≈102M (hg19) in HAP1 cells with a transposon inserted boundary and replication timing. e, Model of DNA replication initiation determined by high-likelihood cohesin extrusion stalling against strong TAD/subTAD boundaries created high-density arrays of CTCF + cohesin-bound motifs with a complex orientation (early replicating IZs) or low-likelihood cohesin pausing against weak TAD/subTAD boundaries formed by single CTCF motifs (late replicating IZs). Yellow double hexamers depict the MCM2–7 complex at licensed origins. Red double hexamers represent the subset of licensed origins that are activated.
Extended Data Fig. 1
Extended Data Fig. 1. Hi-C and 16-fraction Repli-seq in H1 human ES cells.
Hi-C maps showing (a) chr10: 88.5 - 91.0 Mb locus and (b) chr10: 108 - 111 Mb locus. Blue lines, Layer 3 most nested TADs/subTADs. Green lines, Layer 2 intermediate TAD/subTAD nesting. Magenta lines, Layer 1 highest-layer non-nested TADs/subTADs. Green rectangles, corner-dots. Tracks show CTCF motifs at colocalized CTCF+cohesin peaks (green, forward; red, reverse), A/B compartments (green, A compartment; red, B compartment), CTCF CUT&RUN and cohesin ChIP-seq (black), low-resolution two-fraction replication timing domains (yellow, early replication timing; black, late replication timing), 16-fraction Repli-seq data, and initiation zones (magenta, all IZs; purple, Early/Early-mid/Late IZs). Genome build, hg38.
Extended Data Fig. 2
Extended Data Fig. 2. Hi-C and 16-fraction Repli-seq in H1 human ES cells.
Hi-C maps showing (a) chr2: 27 - 30 Mb locus and (b) chr10: 54 - 57 Mb locus. Blue lines, Layer 3 most nested TADs/subTADs. Green lines, Layer 2 intermediate TAD/subTAD nesting. Magenta lines, Layer 1 highest-layer non-nested TADs/subTADs. Green rectangles, corner-dots. Tracks show CTCF motifs at colocalized CTCF+cohesin peaks (green, forward; red, reverse), A/B compartments (green, A compartment; red, B compartment), CTCF CUT&RUN and cohesin ChIP-seq (black), low-resolution two-fraction replication timing domains (yellow, early replication timing; black, late replication timing), 16-fraction Repli-seq data, and initiation zones (magenta, all IZs; purple, Early/Early-mid/Late IZs). Genome build, hg38.
Extended Data Fig. 3
Extended Data Fig. 3. Hi-C and 16-fraction Repli-seq in H1 human ES cells.
Hi-C maps showing (a) chr7: 136 – 138 Mb locus and (b) chr10: 84 – 86 Mb locus. Blue lines, Layer 3 most nested TADs/subTADs. Green lines, Layer 2 intermediate TAD/subTAD nesting. Magenta lines, Layer 1 highest-layer non-nested TADs/subTADs. Green rectangles, corner-dots. Tracks show CTCF motifs at colocalized CTCF+cohesin peaks (green, forward; red, reverse), A/B compartments (green, A compartment; red, B compartment), CTCF CUT&RUN and cohesin ChIP-seq (black), low-resolution two-fraction replication timing domains (yellow, early replication timing; black, late replication timing), 16-fraction Repli-seq data, and initiation zones (magenta, all IZs; purple, Early/Early-mid/Late IZs). Genome build, hg38.
Extended Data Fig. 4
Extended Data Fig. 4. Loop calling in H1 human ES Hi-C across a series of single-variable parameter changes.
(a) Example genomic locus in human ES cells (chr4: 52.9 - 54.9 Mb, hg38, scale 0–200) with 10 methodological variants of corner-dot detection (Options A through J detailed in the Supplementary Methods). In teal, we highlight Options D, F, and H as our recommended loop calling parameters in Hi-C 2.5 generated from human ES cells for conservative, intermediate, and permissive calls respectively. Option D – our conservative loop calling set – is indicated by a teal box and was used to call loops for the analysis in the main paper. (b) Bar graph showing the number of loops called across autosomes for loop calling parameters Options A through J. (c) We computed right-tailed, one-tailed empirical p-values using a randomization test with Early, Early-mid, and Late S phase IZs and size- and A/B compartment-matched null IZs (Supplemental Methods) across boundaries derived from Options A-J dot calling variants. (d) Number of TAD/subTAD boundaries from autosomal chromosomes classified into the following categories: double-dot complex CTCF motif orientation (DD complex), double-dot tandem + single CTCF motif orientation (DD tandem), double-dot no CTCF (DD 0 CTCF), single-dot CTCF complex motif orientation (SD complex), single-dot CTCF tandem + single motif orientation (SD tandem), single-dot no CTCF (SD 0 CTCF), dotless complex CTCF motif orientation (ND complex), dotless tandem + single CTCF motif orientation (ND tandem), and dotless no CTCF (ND 0 CTCF).
Extended Data Fig. 5
Extended Data Fig. 5. Statistical test and SNS-seq in H1 human ES cells reveals the enrichment of Early IZs at class 1 boundaries.
(a) Boundary classification schematic in human ES cells with the following boundary counts: (i) N = 4,404, (ii) N = 2,258, (iii) N = 126, (iv) N = 51, (v) N = 320, (vi) N = 346. Boundary class numbers in figure and caption provided for autosomal chromosomes only. (b-d) Statistical test computing proximity of IZs to TAD/subTAD boundaries compared to expectation in hES Hi-C autosomes. We computed right-tailed, one-tailed empirical p-values using a randomization test with (b) early, (c) early-mid, and (d) late S phase IZs and size- and A/B compartment-matched null IZs (Supplemental Methods). Test statistic for real IZs (red line) represents the difference between the average null IZ distance to closest boundary and average real IZ distance to closest boundary (detailed in Supplemental Methods). Null distribution represents the difference between the average distance to the closest boundary of two reshuffled sets of null IZs. (e) We plotted the average SNS-seq signal (reads per million) 500 kb up- and down-stream of the 6 boundary classes. SNS-seq data in human ES cells was acquired from Besnard et al51. The overall level of SNS-seq signal at Dot boundaries was also higher than Dotless boundaries, reinforcing the shared propensity of SNS-seq origins and corner-dot TADs/subTADs to both be enriched in the same genomic compartment (A compartment), which we controlled for in our statistical tests.
Extended Data Fig. 6
Extended Data Fig. 6. Patterns of 16-fraction Repli-seq in boundaries +/− transcribed genes in H1 human ES cells.
Repli-seq was averaged for each of the 16 fractions in a +/− 750 kb window at (a) Boundary class 1, dot boundaries with complex CTCF motif orientation, (b) Boundary class 4, dotless boundaries with complex CTCF motif orientation, and (c) Boundary class 6, dotless boundaries with no CTCF, further stratified by colocalization with transcribed genes (+ transcription) vs. no genes & no transcribed genes (- transcription) within +/− 100 kb of the midpoint of the boundary. 16 Fraction Repli-seq images pileup scale 0.6–1.85. Boundary numbers provided in figure for autosomal chromosomes only.
Extended Data Fig. 7
Extended Data Fig. 7. HCT116 characterization leading to the generation of wild type, WAPL knock-down, and RAD21 knock-down genomics libraries .
(a) Treatment and sample collection timeline of HCT116 RAD21-mAID and HCT116 WAPL-mAID2 cells for high-resolution 16-fraction Repli-seq. (b-c) Propidium Iodide FACS histograms measuring DNA content for (b) HCT116 WAPL-mAID2 cells in asynchronous cultures and immediately after mitotic shake-off conditions, (c) auxin-treated HCT116 RAD21-mAID cells and HCT116 WAPL-mAID2 cells at specified time points after mitotic shake-off. No clear defect in cell cycle progression was observed. (d) Western blot of RAD21 protein in HCT116 RAD21-mAID cells for untreated control and timepoints after auxin treatment post mitotic shake off. Ponceau S stain for total protein. Blot run on one set of samples.(e) Western blot of WAPL protein in HCT116 WAPL-mAID2 cells for untreated control and timepoints after auxin treatment post mitotic shake off. Ponceau S stain for total protein. Blot run on one set of samples. (f) Total IP efficiency (genomic DNA over mitochondrial DNA) for each of 16 S phase fractions of high-resolution 16-fraction Repli-seq for HCT116 WT, HCT116 RAD21-mAID KD, and HCT116 WAPL-mAID2 KD cells.
Extended Data Fig. 8
Extended Data Fig. 8. Insulation score changes at Boundary classes 1–6 in HCT116 cells upon cohesin and WAPL knock-down.
Average insulation score for each of the six boundary classes in a +/− 760 kb window for wild type HCT116 (WT; untreated HCT116 WAPL-mAID2), HCT116 with cohesin knock-down (RAD21 KD; auxin-treated HCT116 RAD21-mAID), and HCT116 with WAPL knock-down (WAPL KD; auxin-treated HCT116 WAPL-mAID2). The six boundary classes have the following boundary counts (i) N = 3,706 (ii) N = 1,387, (iii) N = 127, (iv) N = 103, (v) N = 350, (vi) N = 511. Boundary numbers provided in figure and caption for autosomal chromosomes only.
Extended Data Fig. 9
Extended Data Fig. 9. Patterns of 16-fraction Repli-seq in Dot versus Dotless boundaries +/- cohesin in HCT116.
Repli-seq was averaged for each of the 16 fractions in a +/− 750 kb window at (a) all boundaries with demarcating dot TAD/subTADs on one or both sides, Boundary classes 1–3, or (b) all boundaries with dotless TADs/subTADs on both sides, Boundary classes 4–6, further stratified by the colocalization with cohesin ChIP-seq peaks (+ cohesin) vs. no cohesin peaks (- cohesin) within +/− 100 kb of the boundary. 16 Fraction Repli-seq images with cohesin pileup scale 5.0–9.8, no cohesin pileup scale 5.0–13.0. Boundary numbers provided in figure for autosomal chromosomes only.
Extended Data Fig. 10
Extended Data Fig. 10. Number and width of IZs in HCT116 cells upon cohesin and WAPL knock-down.
(a) Boundary classes in HCT116 with the following boundary counts (i) N = 3,706 (ii) N = 1,387, (iii) N = 127, (iv) N = 103, (v) N = 350, (vi) N = 511. Boundary numbers provided in figure and caption for autosomal chromosomes only. (b) Number of IZs in WT only (unique to wild type HCT116 – white bar), invariant (wild type HCT116 overlapping auxin-treated HCT116 RAD21-mAID KD – middle black bar), and RAD21 KD only (unique to auxin-treated HCT116 RAD21-mAID KD – right black bar). (c) Width of all IZs colocalized with Boundary classes 1 - 6 in HCT116 WT and HCT116 RAD21 KD conditions. Median value indicated by red line. Two-tailed Mann-Whitney U comparing overlapping IZs in HCT116 WT and HCT116 RAD21 KD samples. Only IZs overlapping in both HCT116 wild type and HCT116 RAD21 knock-down are plotted. (d) Number of IZs in WT only (unique to wild type HCT116 – white bar), invariant (wild type HCT116 overlapping auxin-treated HCT116 WAPL-mAID2 KD – middle black bar), and WAPL KD only (unique to auxin-treated HCT116 WAPL-mAID2 KD – right black bar). (e) Width of all IZs colocalized with Boundary classes 1 - 6 in HCT116 WT and HCT116 WAPL KD conditions. Median value indicated by red line. Two-tailed Mann-Whitney U comparing overlapping IZs in HCT116 WT and HCT116 WAPL KD samples. Only IZs overlapping in both HCT116 wild type and HCT116 WAPL knock-down are plotted.

References

    1. Bellush JM, Whitehouse I. DNA replication through a chromatin environment. Philos. Trans. R. Soc. B. 2017;372:20160287. doi: 10.1098/rstb.2016.0287. - DOI - PMC - PubMed
    1. Mechali M. Eukaryotic DNA replication origins: many choices for appropriate answers. Nat. Rev. Mol. Cell Biol. 2010;11:728–738. doi: 10.1038/nrm2976. - DOI - PubMed
    1. Dixon JR, et al. Topological domains in mammalian genomes identified by analysis of chromatin interactions. Nature. 2012;485:376–380. doi: 10.1038/nature11082. - DOI - PMC - PubMed
    1. Nora EP, et al. Spatial partitioning of the regulatory landscape of the X-inactivation centre. Nature. 2012;485:381–385. doi: 10.1038/nature11049. - DOI - PMC - PubMed
    1. Hou C, Li L, Qin ZS, Corces VG. Gene density, transcription, and insulators contribute to the partition of the Drosophila genome into physical domains. Mol. Cell. 2012;48:471–484. doi: 10.1016/j.molcel.2012.08.031. - DOI - PMC - PubMed