. 2022 Jun;606(7914):535-541.
doi: 10.1038/s41586-022-04822-x. Epub 2022 Jun 8.

Genome evolution and diversity of wild and cultivated potatoes

Affiliations

Genome evolution and diversity of wild and cultivated potatoes

Dié Tang et al. Nature. 2022 Jun.

Abstract

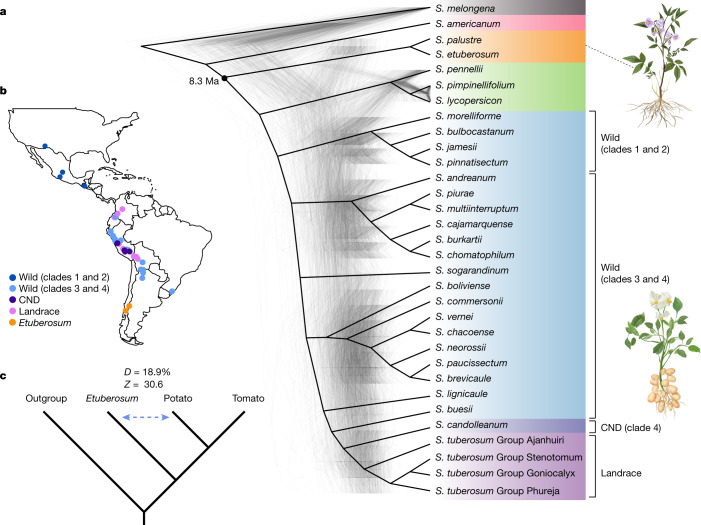
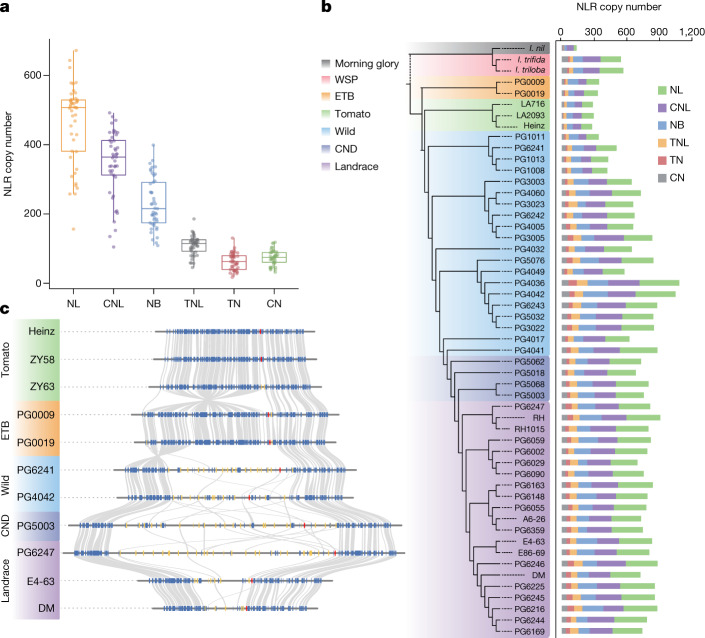
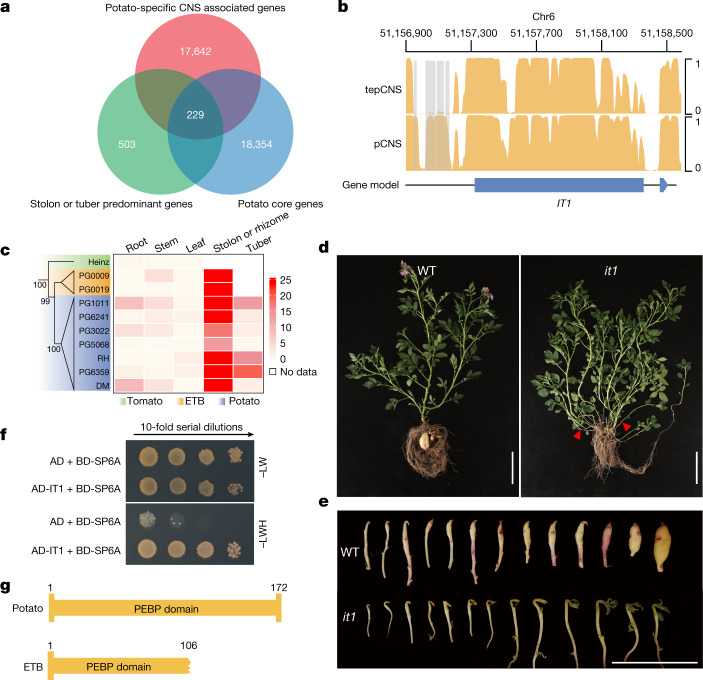
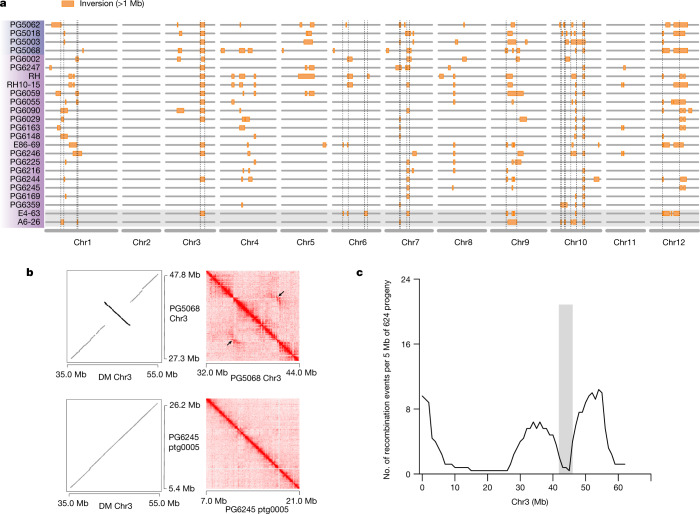
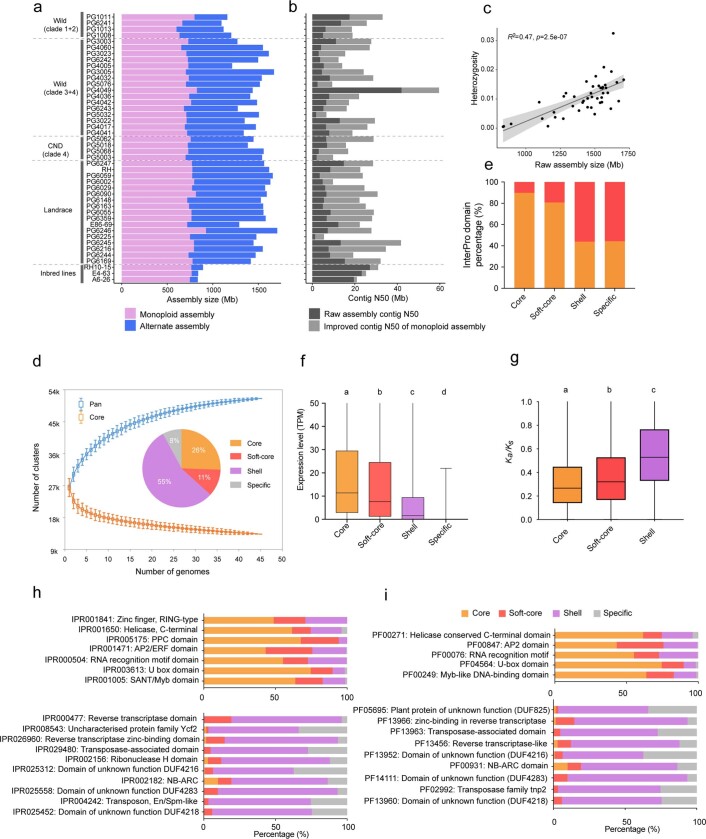
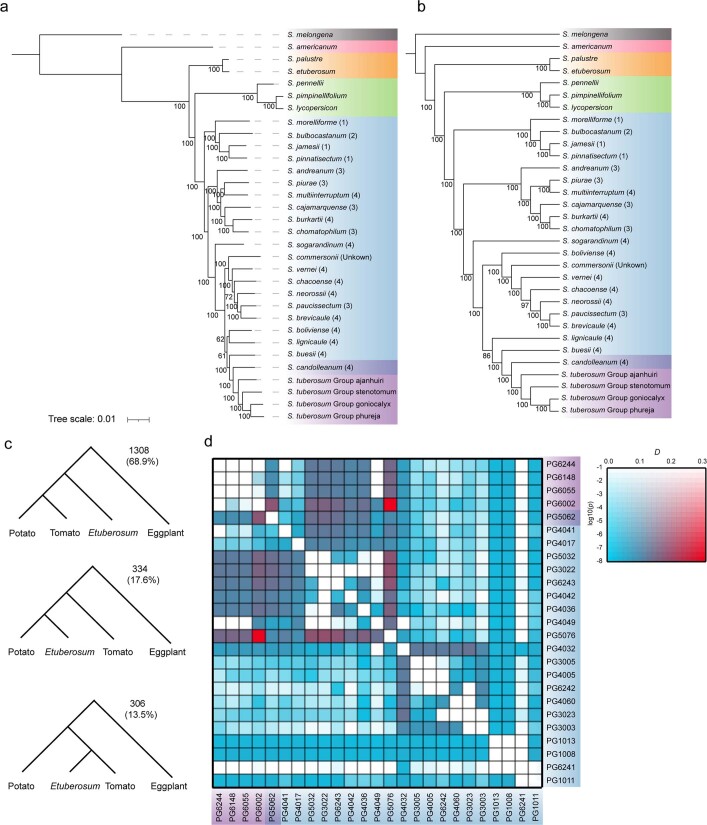
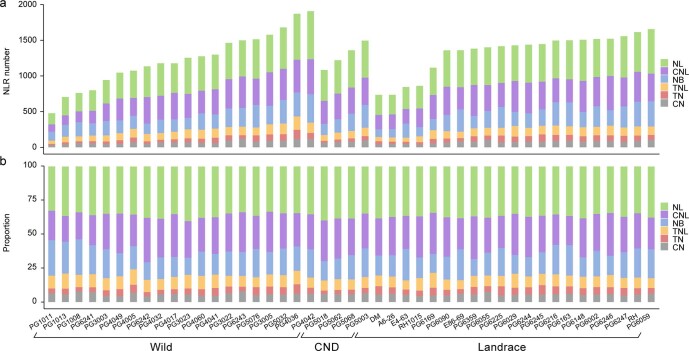
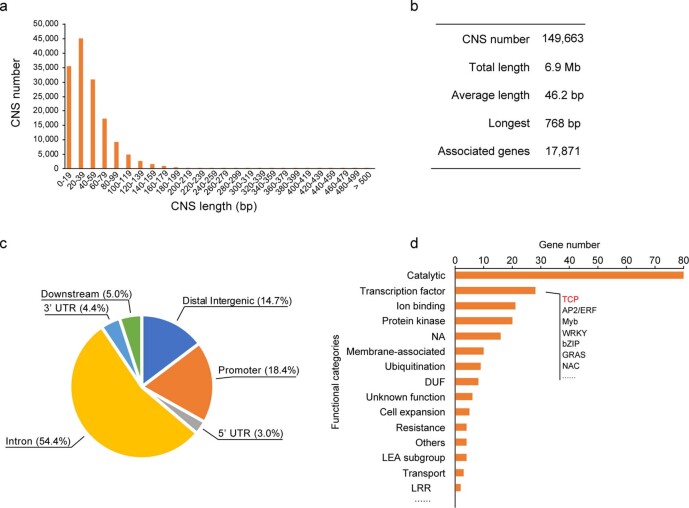
Potato (Solanum tuberosum L.) is the world's most important non-cereal food crop, and the vast majority of commercially grown cultivars are highly heterozygous tetraploids. Advances in diploid hybrid breeding based on true seeds have the potential to revolutionize future potato breeding and production1-4. So far, relatively few studies have examined the genome evolution and diversity of wild and cultivated landrace potatoes, which limits the application of their diversity in potato breeding. Here we assemble 44 high-quality diploid potato genomes from 24 wild and 20 cultivated accessions that are representative of Solanum section Petota, the tuber-bearing clade, as well as 2 genomes from the neighbouring section, Etuberosum. Extensive discordance of phylogenomic relationships suggests the complexity of potato evolution. We find that the potato genome substantially expanded its repertoire of disease-resistance genes when compared with closely related seed-propagated solanaceous crops, indicative of the effect of tuber-based propagation strategies on the evolution of the potato genome. We discover a transcription factor that determines tuber identity and interacts with the mobile tuberization inductive signal SP6A. We also identify 561,433 high-confidence structural variants and construct a map of large inversions, which provides insights for improving inbred lines and precluding potential linkage drag, as exemplified by a 5.8-Mb inversion that is associated with carotenoid content in tubers. This study will accelerate hybrid potato breeding and enrich our understanding of the evolution and biology of potato as a global staple food crop.


Conflict of interest statement

The authors declare no competing interests.

Figures

Fig. 1
Fig. 1. Geographical distribution and phylogeny of the Solanum genus.
a, Five hundred phylogenetic window trees (light grey lines) were randomly selected for visualization from 100-kb non-overlapping regions across the genome. The main cladogram shown here was built from 3,971 single-copy genes, based on 29 species (32 accessions, in which 4 are from S. tuberosum) (Supplementary Table 1). The number labelled beside the tree indicates the estimated divergence time. The pictures illustrate the morphological differences of tuber-bearing and non-tuber-bearing species. b, Geographical origin of 39 samples (Supplementary Table 1) for which the longitude and latitude information are available. The base map was generated using the function mapBubbles() in the R package rworldmap. c, ABBA-BABA analysis of gene flow between Petota and Etuberosum species. Significant introgression events are detected between Petota and Etuberosum. Source data
Fig. 2
Fig. 2. Evolution of resistance genes in potato.
a, Canonical NLR copy number in potato. The upper and lower edges of the boxes represent the 75% and 25% quartiles, the central line denotes the median and the whiskers extend to 1.5 times the interquartile range (IQR). NL, NB-LRR; CNL, CC-NB-LRR; TNL, TIR-NB-LRR; TN, TIR-NB; CN, CC-NB; NB, NB domain only (see ‘Reannotation and classification of nucleotide-binding resistance genes’ in the Methods for detailed definitions of the abbreviations). Each NLR class contains 45 potato genomes. ETB, Etuberosum; WSP, wild relatives of sweet potato. b, Comparison of NLR copy numbers among different accessions. The NLRs from the potato monoploid assembled contigs were kept. The various colour backgrounds indicate accessions from different clades. c, Synteny plots of the R3a locus from 11 representative accessions. Red boxes indicate R3a orthologues in each accession. Yellow boxes indicate for NLR gene models and blue boxes denote other genes. Grey lines identify syntenic gene pairs. Source data
Fig. 3
Fig. 3. Identification of a potato tuber identity gene.
a, Venn diagram describing the identification of 229 candidate genes that are involved in regulating stolon or tuber development. b, Conserved CNSs around the Identity of Tuber1 (IT1) locus. tepCNS, conservative score for each site calculated from tomato, Etuberosum and potato genomes; pCNS, conservative score for each site calculated from 45 potato genomes. Grey blocks show potato-specific CNSs. c, Expression pattern of IT1 and its orthologues in five tissues of Etuberosum, tomato and potato species. The 5-kb sequences up- and downstream of IT1 from tomato, Etuberosum and potato were used to infer the phylogenetic relationships. d, Phenotypes of the it1 knockout mutant. Red arrowheads indicate several abnormally developed stolons in the it1 mutant. Scale bars, 10 cm. WT, wild type. e, Comparison of potato tuber development between wild type and the it1 mutant. Scale bar, 5 cm. f, IT1 directly interacts with SP6A, as validated in a yeast-two-hybrid assay. Three independent biological experiments were performed. g, Domain architecture of SP6A in potato and Etuberosum species. AD, Gal 4 activation domain; BD, Gal4 DNA-binding domain; -LW, synthetic dropout medium without Leu and Trp; -LWH, synthetic dropout medium without Leu, Trp and His. Source data
Fig. 4
Fig. 4. Pan-genome-based map of large inversions.
a, Inversion map of 20 landraces and 4 CND accessions. The orange rectangles denote megabase-scale inversions. The dashed lines mark the regions containing inversions presented in either E4-63 or A6-26. b, The Hi-C-validated 5.8 Mb inversion event, using DM as the reference genome. Hi-C contact maps at 25-kb resolution for accession PG5068 (wild/CND haplotype) and PG6245 (DM haplotype), using Hi-C data from the homozygous line A6-26 (DM haplotype). Wild/CND haplotype, accessions carrying the inversion; DM haplotype, accessions without the inversion. c, Number of recombination events per 5 Mb on chromosome 3. The grey bar indicates the region with reduced recombination around the 5.8-Mb inversion. Source data
Extended Data Fig. 1
Extended Data Fig. 1. Pan-genome of 45 potato accessions.
a, Assembled size of monoploid assembled contigs (MTGs) and alternate assembled contigs (ATGs). b, Contig N50 of raw assembled contigs and improved contig N50 of MTGs. c, Correlation between raw assembly size and heterozygosity. The grey shaded region indicates the 95% confidence interval using a linear model (‘lm’). d, Simulation of pan- and core-genome sizes, in terms of number of gene clusters and pan-genome composition. At each given number of genomes, the number of combinations is 500 with 30 times of replication. e, Percentage of genes in core, soft-core, shell and accession-specific gene subsets with annotated InterPro protein domains. Orange bars show the proportion of genes with InterPro domains, whereas red bars depict the genes without those domains. f, Expression profiles of genes belonging to core (13,123), soft-core (5,732), shell (5,009) and accession-specific (134) gene families. g, Non-synonymous/synonymous substitution ratios (Ka/Ks) within core, soft-core, and shell genes. Kruskal-Wallis test was used to determine significance. Multiple comparisons were performed, using the Fisher's least significant difference. The level of significance used in the post hoc test was 0.001. Number of gene pairs used in core, soft-core and shell genes are 52,148, 28,363 and 31,654, respectively. The upper and lower edges of the boxes represent the 75% and 25% quartiles, the central line denotes the median and the whiskers extend to 1.5 × IQR in d, f and g. h, InterPro protein domain enrichments of core and soft-core (upper panel) and shell and accession-specific (lower panel) genes relative to pan genes. i, Pfam protein families enriched in core and soft-core (upper panel) and shell and accession-specific (lower panel) genes, relative to pan genes. Source data
Extended Data Fig. 2
Extended Data Fig. 2. Genome-wide alignments among 45 genome accessions.
Whole-genome alignments of 44 MTGs to DM reference genome. Alignments with length greater than 10 kb and showing greater than 90% identity are kept for visualization. Black dashed rectangles indicate the specially focused regions.
Extended Data Fig. 3
Extended Data Fig. 3. Phylogenetic analysis of the 32 representative accessions.
a, Maximum likelihood super-matrix tree based on 3,971 single-copy ortholog genes. The scale bar represents branch lengths, which corresponds to the mean number of substitutions per site in the alignments. b, Coalescent tree based on 3,971 single-copy ortholog genes, accounting for ILS. c, The proportion of different tree topologies among 1,899 non-overlapping window trees. d, Heat map of the most significant D scores observed between two given potato accessions (P2 and P3) across all possible individuals in P1 species. D scores and log10(p) values are shown in different colour schemes. Lycopersicon, Etuberosum, S. americanum and S. melongena are used as an outgroup. The P values are calculated using a standard block-jackknife procedure as in ref. . Source data
Extended Data Fig. 4
Extended Data Fig. 4. Landscape of NLRs in the potato genome.
a, NLR copy number in six canonical classes. NL: NB-LRR, CNL: CC-NB-LRR, NB: NB domain only, TNL: TIR-NB-LRR, TN: TIR-NB, CN: CC-NB. b, Proportion of each NLR class in 45 potato genomes. Source data
Extended Data Fig. 5
Extended Data Fig. 5. Features of potato-specific CNSs and categories of 229 candidate genes.
a, CNS length distribution. b, Summary of CNSs in potato. c, Pie chart shows the distribution of CNSs in potato genome. d, Functional categories of 229 CNS-associated potato core genes displaying stolon or tuber predominant expression. Source data
Extended Data Fig. 6
Extended Data Fig. 6. Phenotypes of the it1 knockout mutant.
a, The IT1 CRISPR/Cas9 knockout mutant. b, The it1 mutant shows an impaired tuberization phenotype. The main stems were removed. Red arrows indicate it1 stolons that convert to branches. The white arrow shows a small tuber formed on it1.
Extended Data Fig. 7
Extended Data Fig. 7. Interaction, sequence synteny and expression of SP6A.
a, Interaction between IT1 and SP6A revealed by the firefly luciferase complementation imaging assay. Three independent experiments are performed. b, Synteny plot of SP6A genomic sequences from representative Etuberosum and potato species. Blue boxes indicate the exons of SP6A, and grey blocks show collinear regions among these genomes. c, The protein sequence alignment of SP6A between DM and PG0019. d, The SP6A expression in potato (E4-63) and Etuberosum (PG0019) leaves at ZT4. ** P-value = 1.59e-04 in two-sided Student's t-test. ETB: Etuberosum. LD: long-day. SD: short-day. Data presented in mean ± SD, n = 3. Three independent experiments are carried out. Source data
Extended Data Fig. 8
Extended Data Fig. 8. Genome-wide sequence variation of the 44 potato genomes.
a, Genomic architecture of heterozygosity distribution in 44 diploid potato genomes revealed by alignment to the DM reference genome; heterozygous (blue) and homozygous (pink) regions, respectively. b, Local synteny (DM chr12: 53.57–54.31 Mb) illustration surrounding the GLYCOALKALOID METABOLISM 4 (GAME4) locus. c, Local synteny (DM chr01: 0.65–1.13 Mb) illustration surrounding FLAVIN-BINDING KELCH REPEAT F-BOX PROTEIN (FKF1). Genes from four potato landraces (DM, A6-26, E4-63, and RH) and four cultivated tomatoes (Heinz 1706, BGV006865, EA00371 and M82) are shown. d, SV allele frequency among the 44 potatoes. e, Number of SVs localized at regulatory, genic and intergenic regions. The upper and lower edges of the boxes represent the 75% and 25% quartiles, the central line denotes the median and the whiskers extend to 1.5 × IQR. The number of genomes investigated in each category is 44. Source data
Extended Data Fig. 9
Extended Data Fig. 9. Association between tuber flesh colour, BCH expression level and the presence of the 5.8-Mb inversion.
a, Phenotypes of tuber colour for accessions E4-63, A6-26, PG6359 and PG5068. b, Expression level (log2TPM) of BCH in five tissues of wild, CND and landrace accessions/haplotypes. Orange dot denotes DM haplotype, and grey dot denotes wild/CND haplotype. DM haplotype: accessions without the inversion; Wild/CND haplotype: accessions carrying the inversion. c, Expression level (TPM) of BCH in tubers of 22 accessions/haplotypes, including 4 DM haplotypes, and 18 wild/CND haplotypes. *** P-value = 1.462e-07 in two-sided Student's t-test. Source data

Comment in

References

    1. Lindhout P, et al. Towards F1 hybrid seed potato breeding. Potato Res. 2011;54:301–312. doi: 10.1007/s11540-011-9196-z. - DOI
    1. Li Y, Li G, Li C, Qu D, Huang S. Prospects of diploid hybrid breeding in potato. Chinese Potato J. 2013;27:96–99.
    1. Zhang C, et al. Genome design of hybrid potato. Cell. 2021;184:3873–3883. doi: 10.1016/j.cell.2021.06.006. - DOI - PubMed
    1. Stokstad E. The new potato. Science. 2019;363:574–577. doi: 10.1126/science.363.6427.574. - DOI - PubMed
    1. Spooner DM, Ghislain M, Simon R, Jansky SH, Gavrilenko T. Systematics, diversity, genetics, and evolution of wild and cultivated potatoes. Bot. Rev. 2014;80:283–383. doi: 10.1007/s12229-014-9146-y. - DOI