. 2022 Jun;606(7916):937-944.
doi: 10.1038/s41586-022-04793-z. Epub 2022 Jun 8.

A preoptic neuronal population controls fever and appetite during sickness

Affiliations

A preoptic neuronal population controls fever and appetite during sickness

Jessica A Osterhout et al. Nature. 2022 Jun.

Abstract

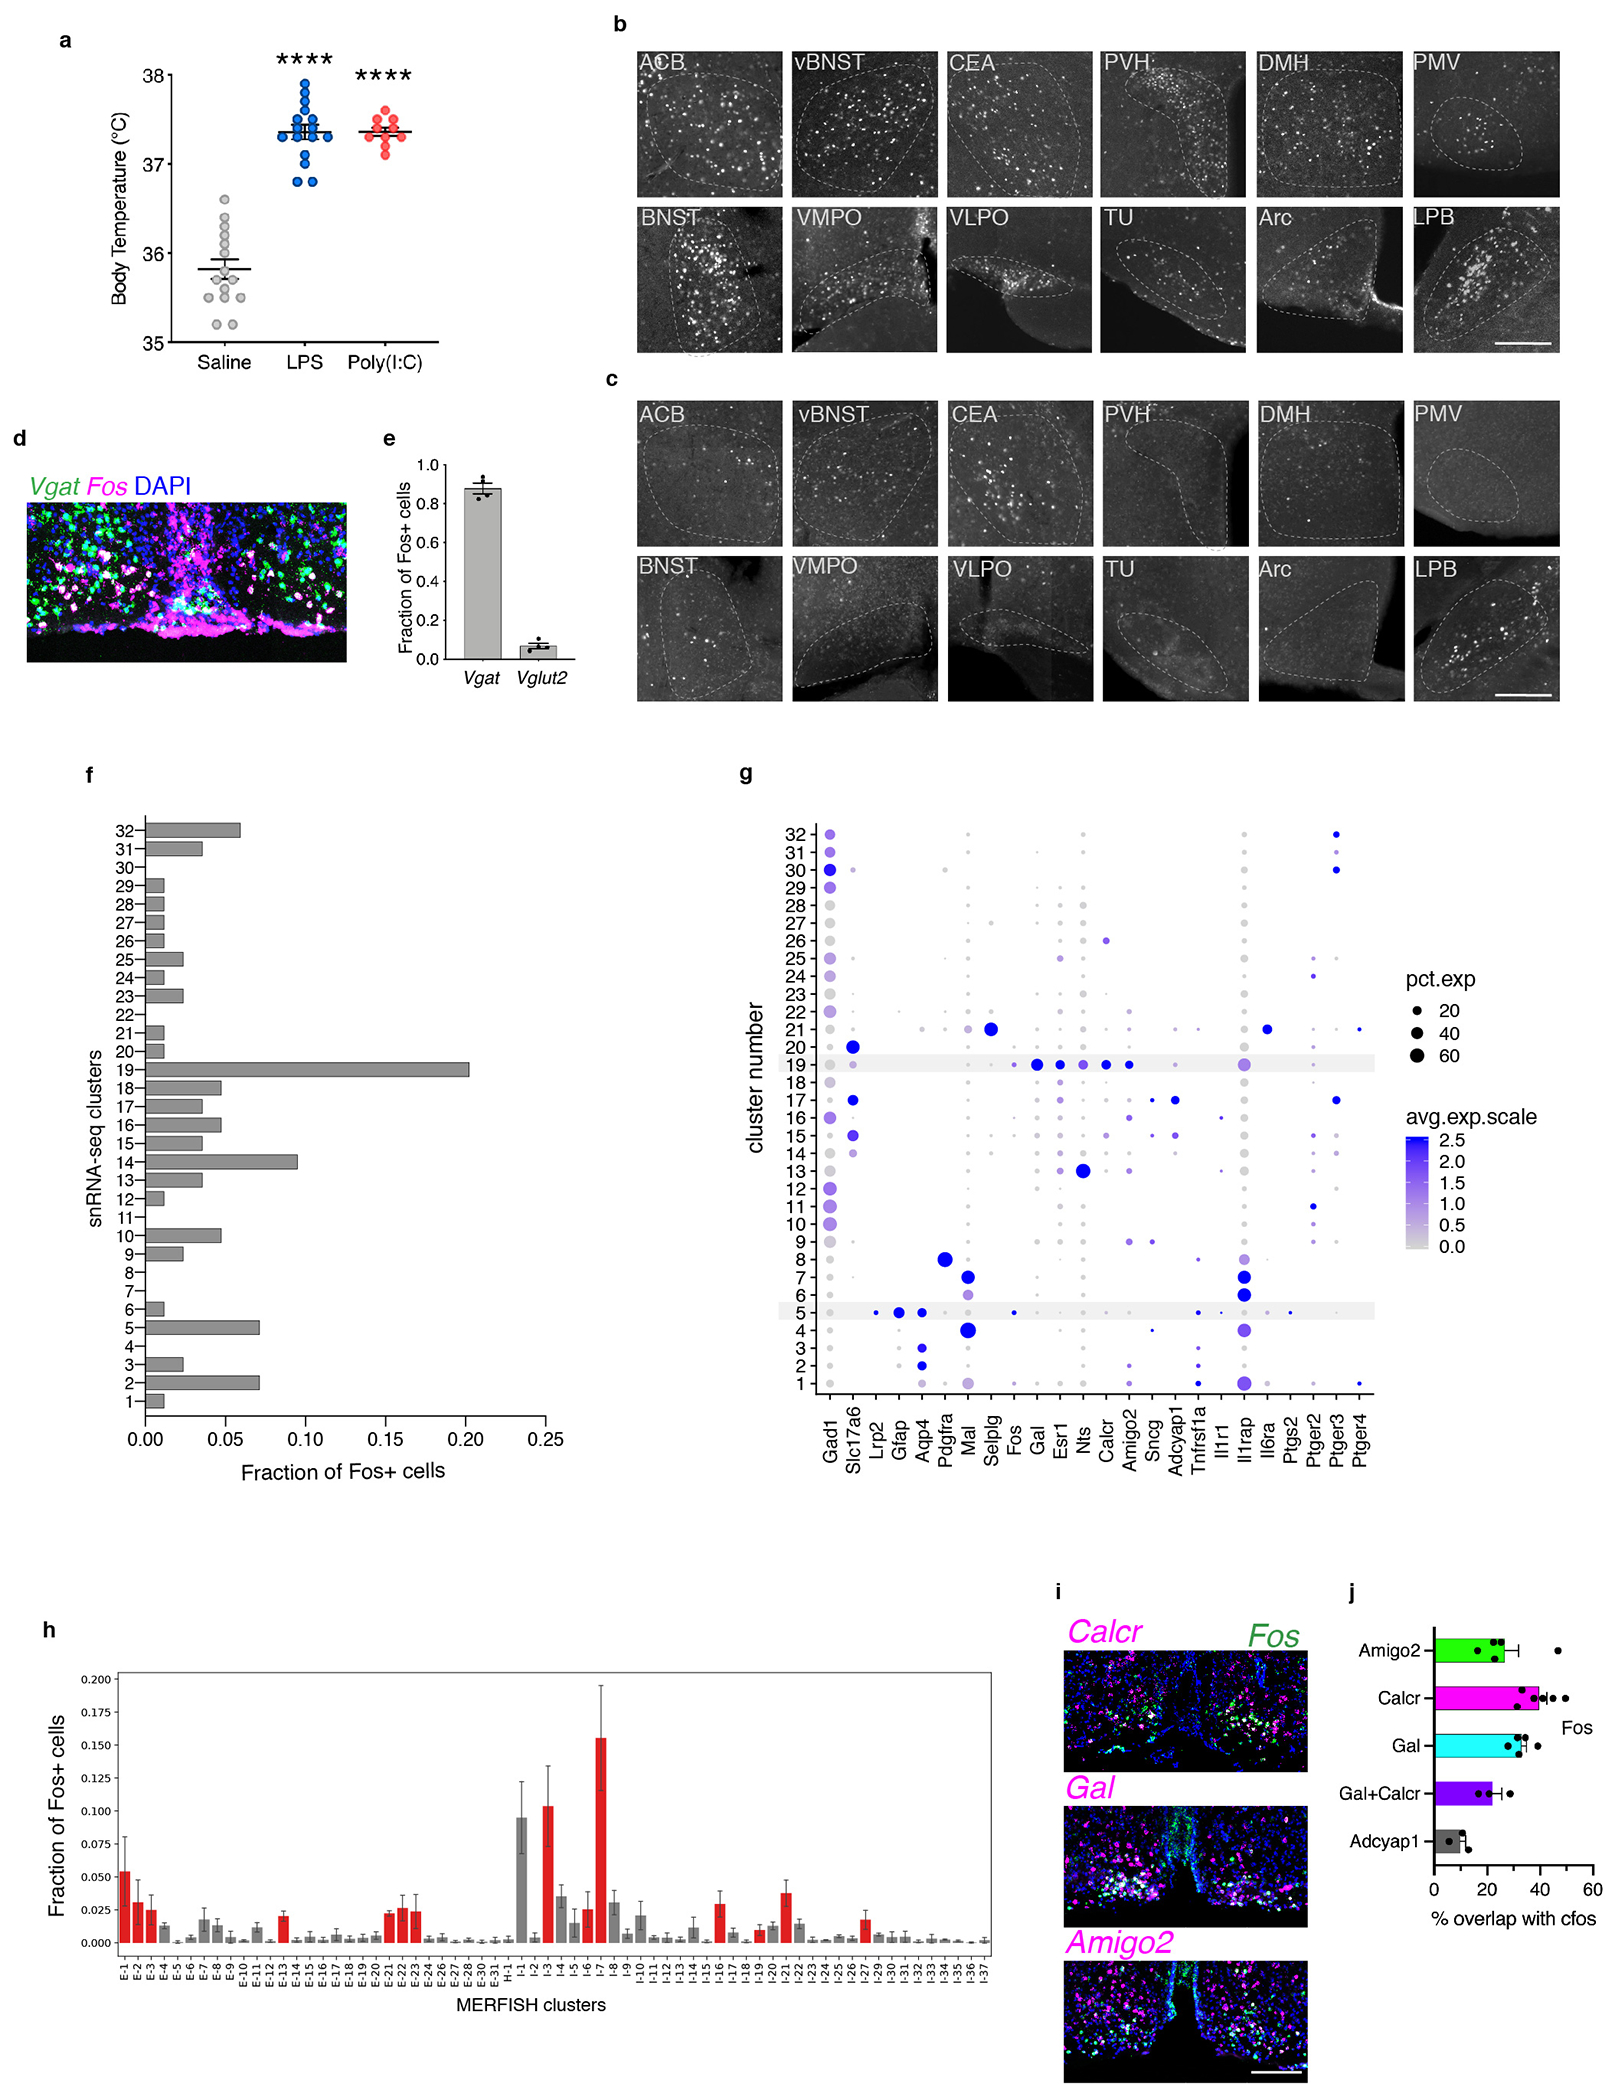
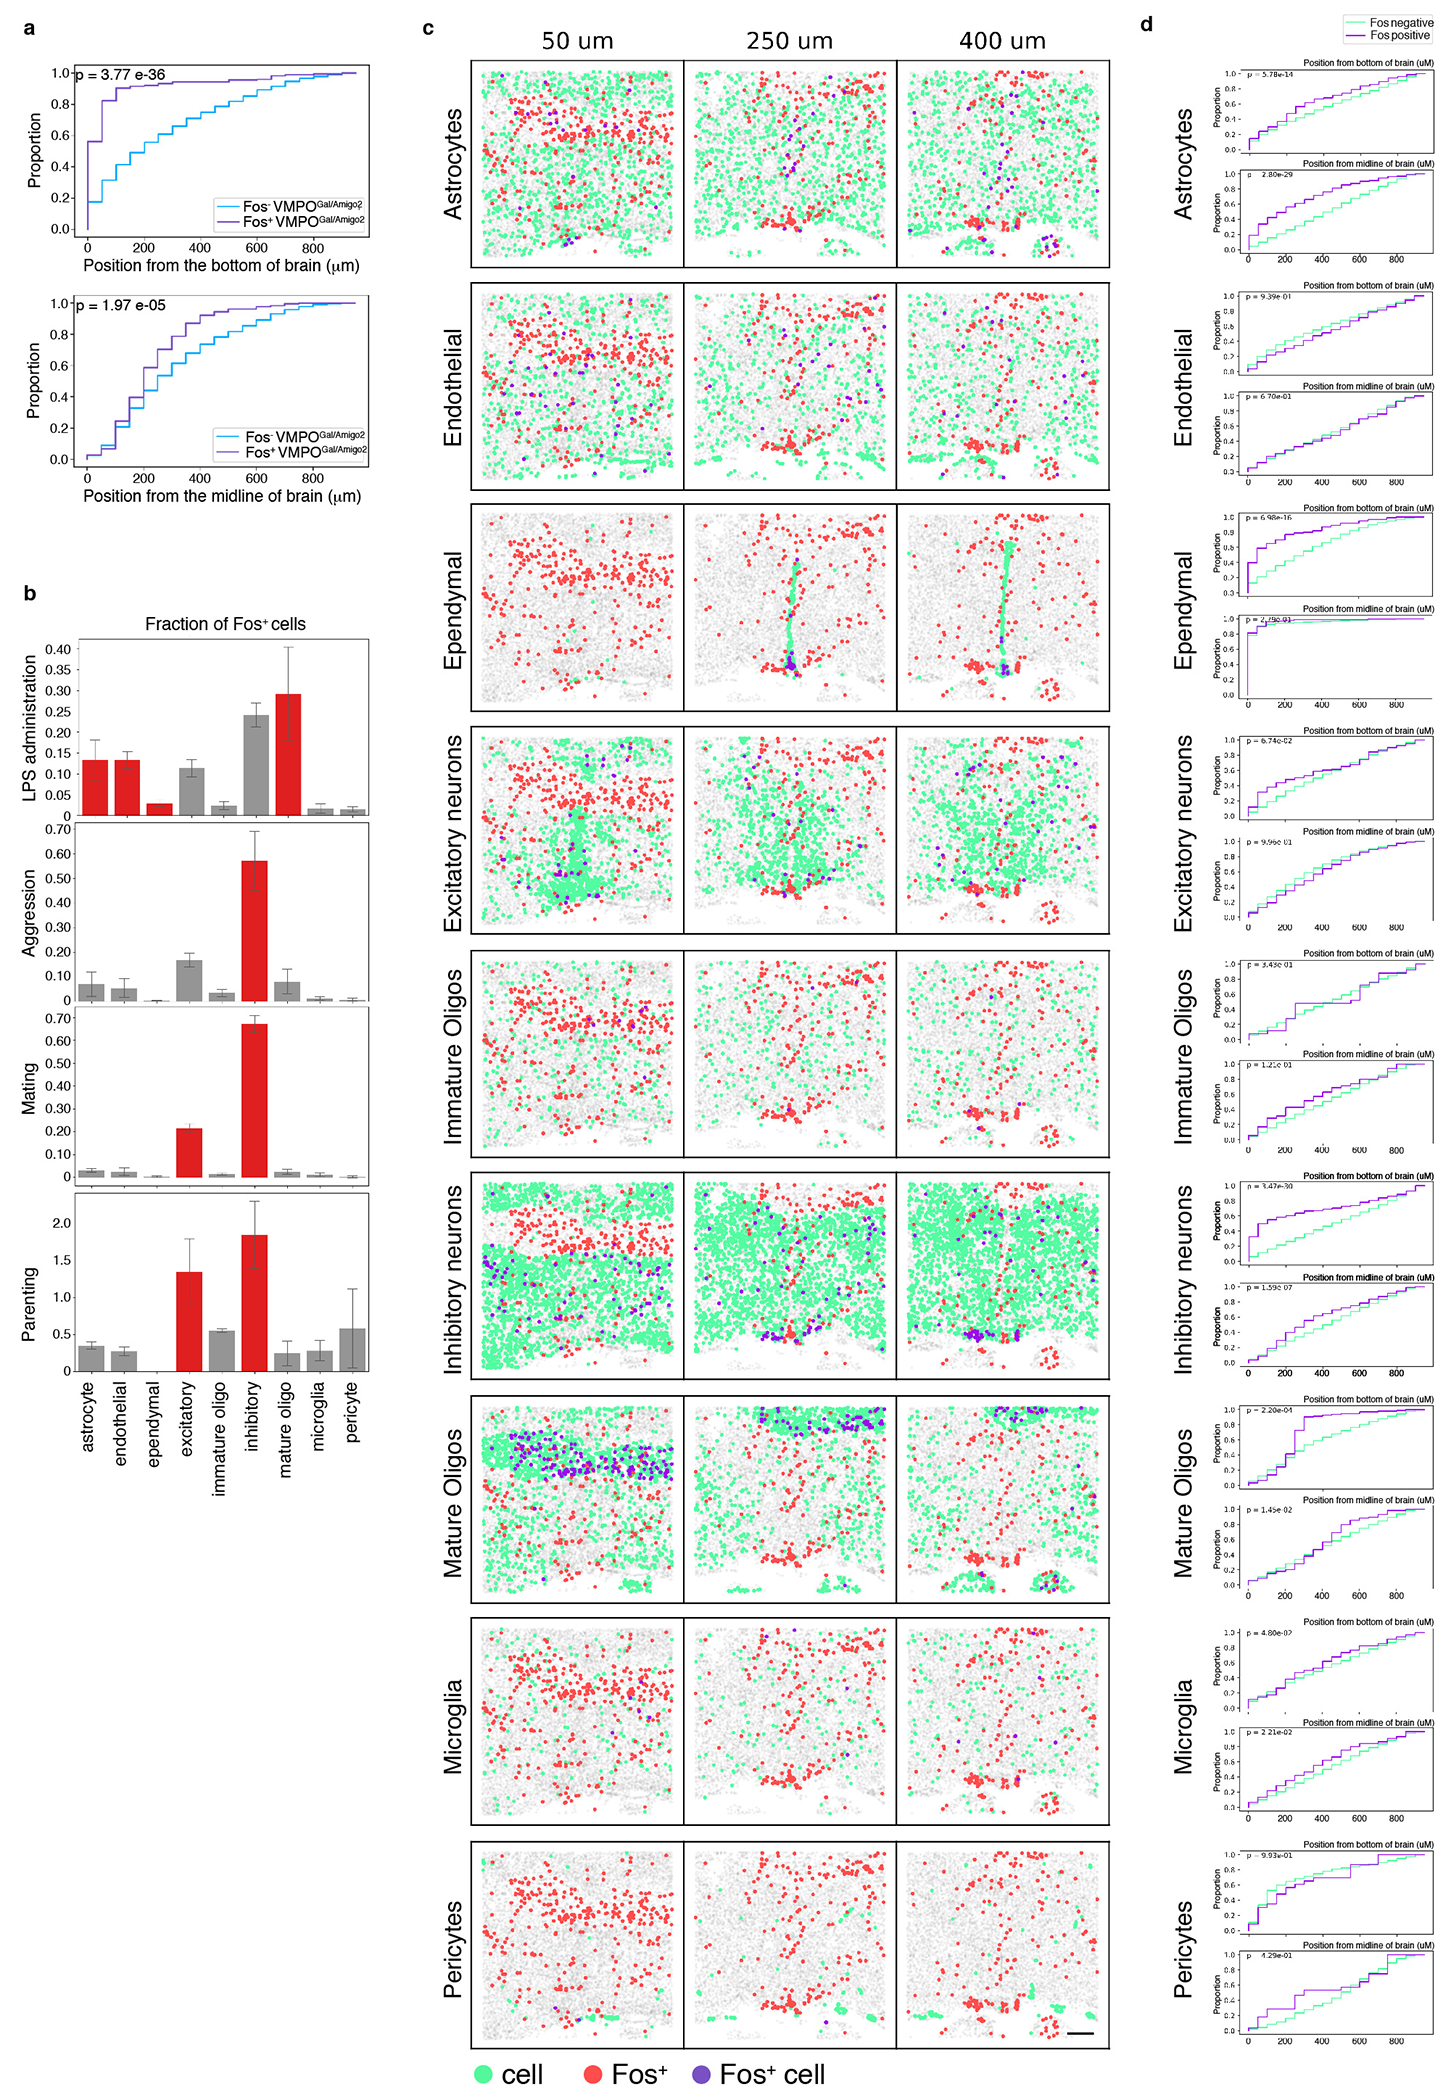
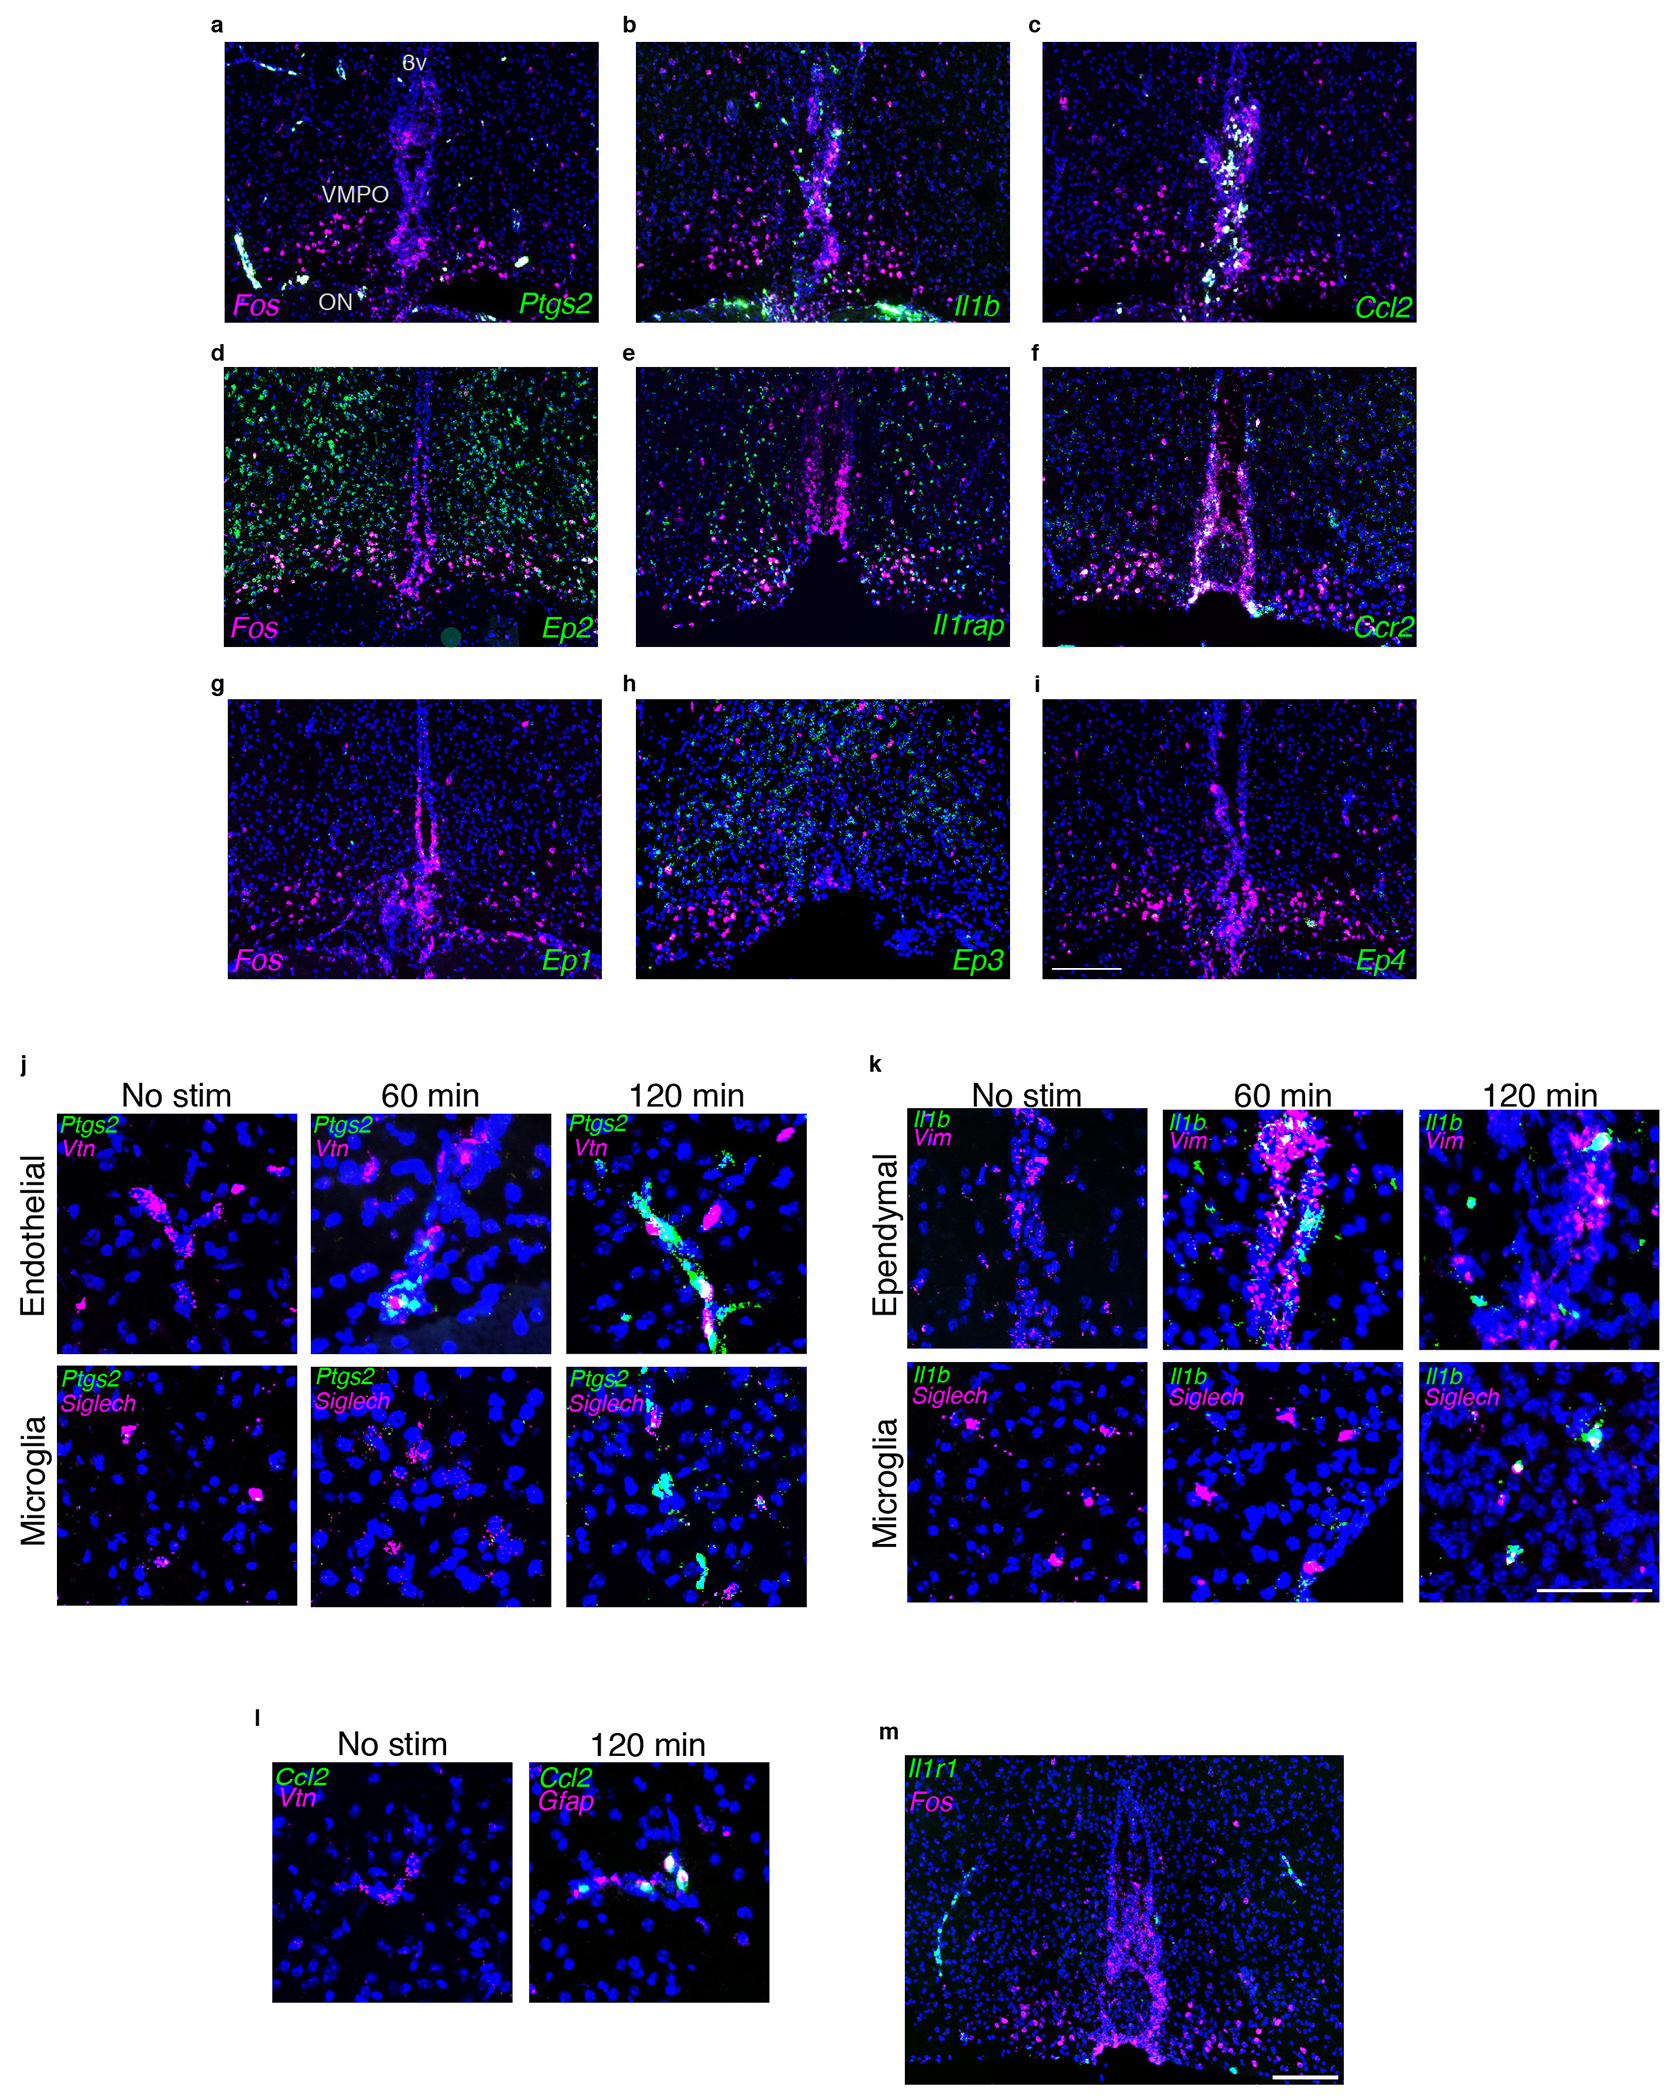
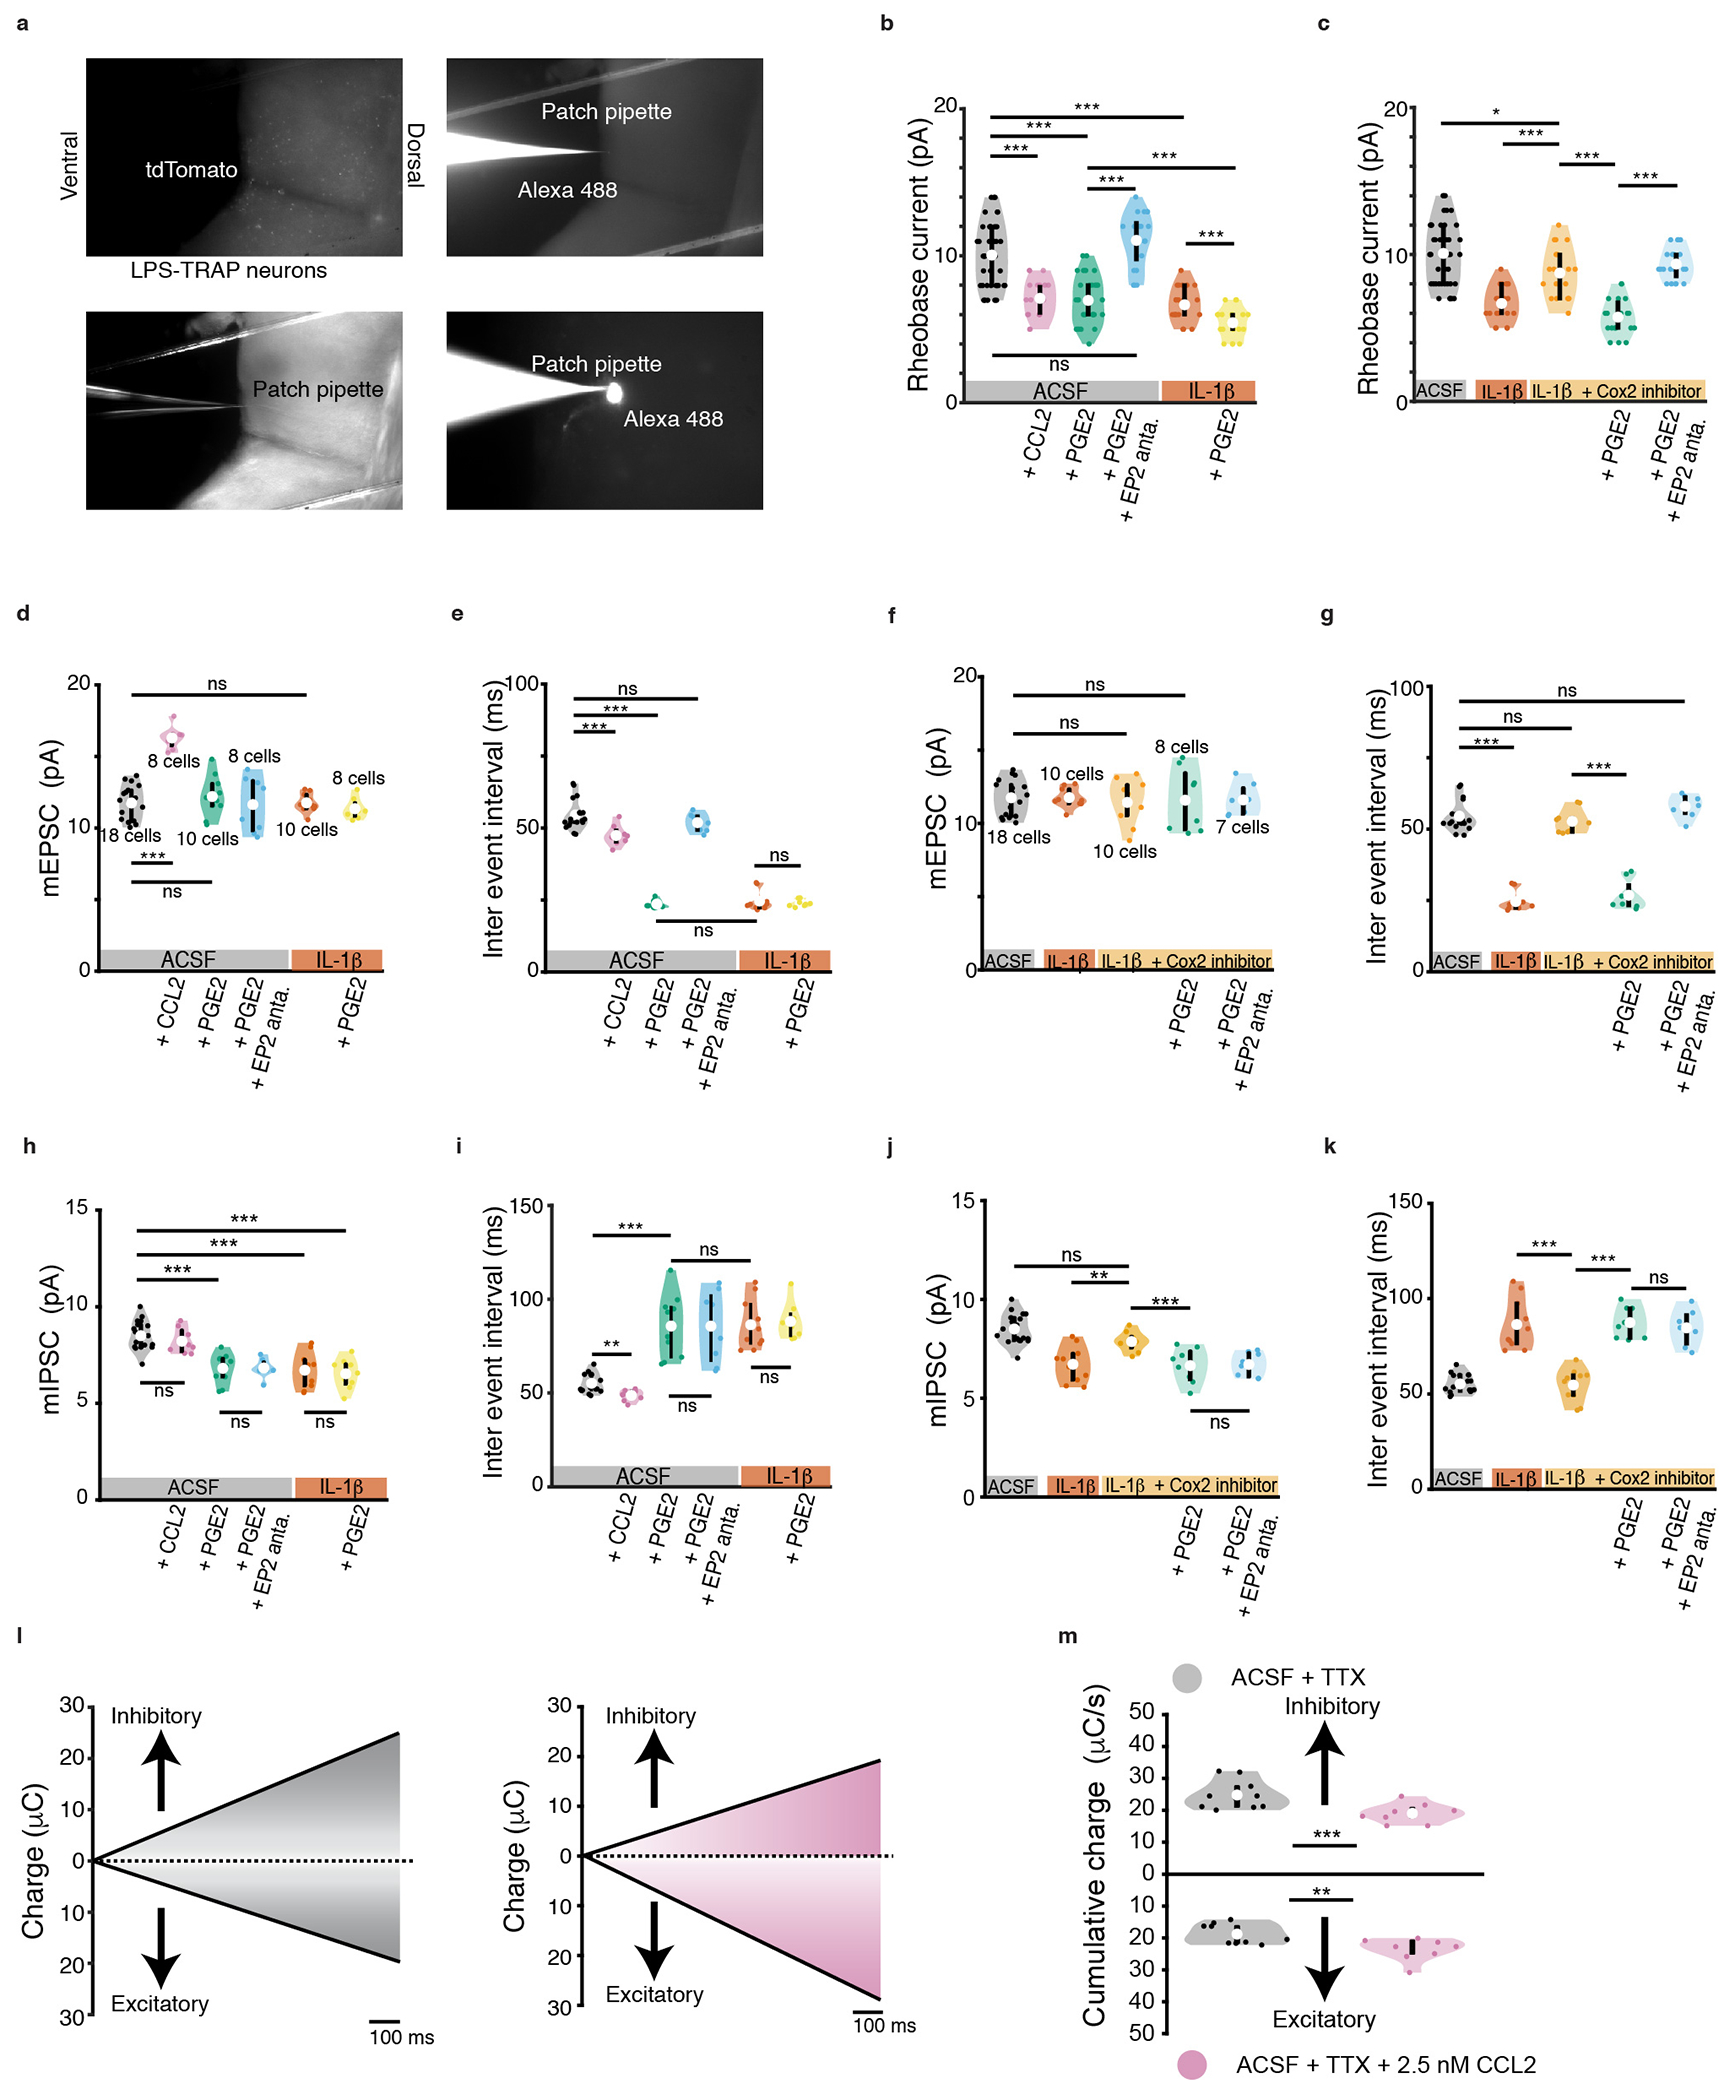
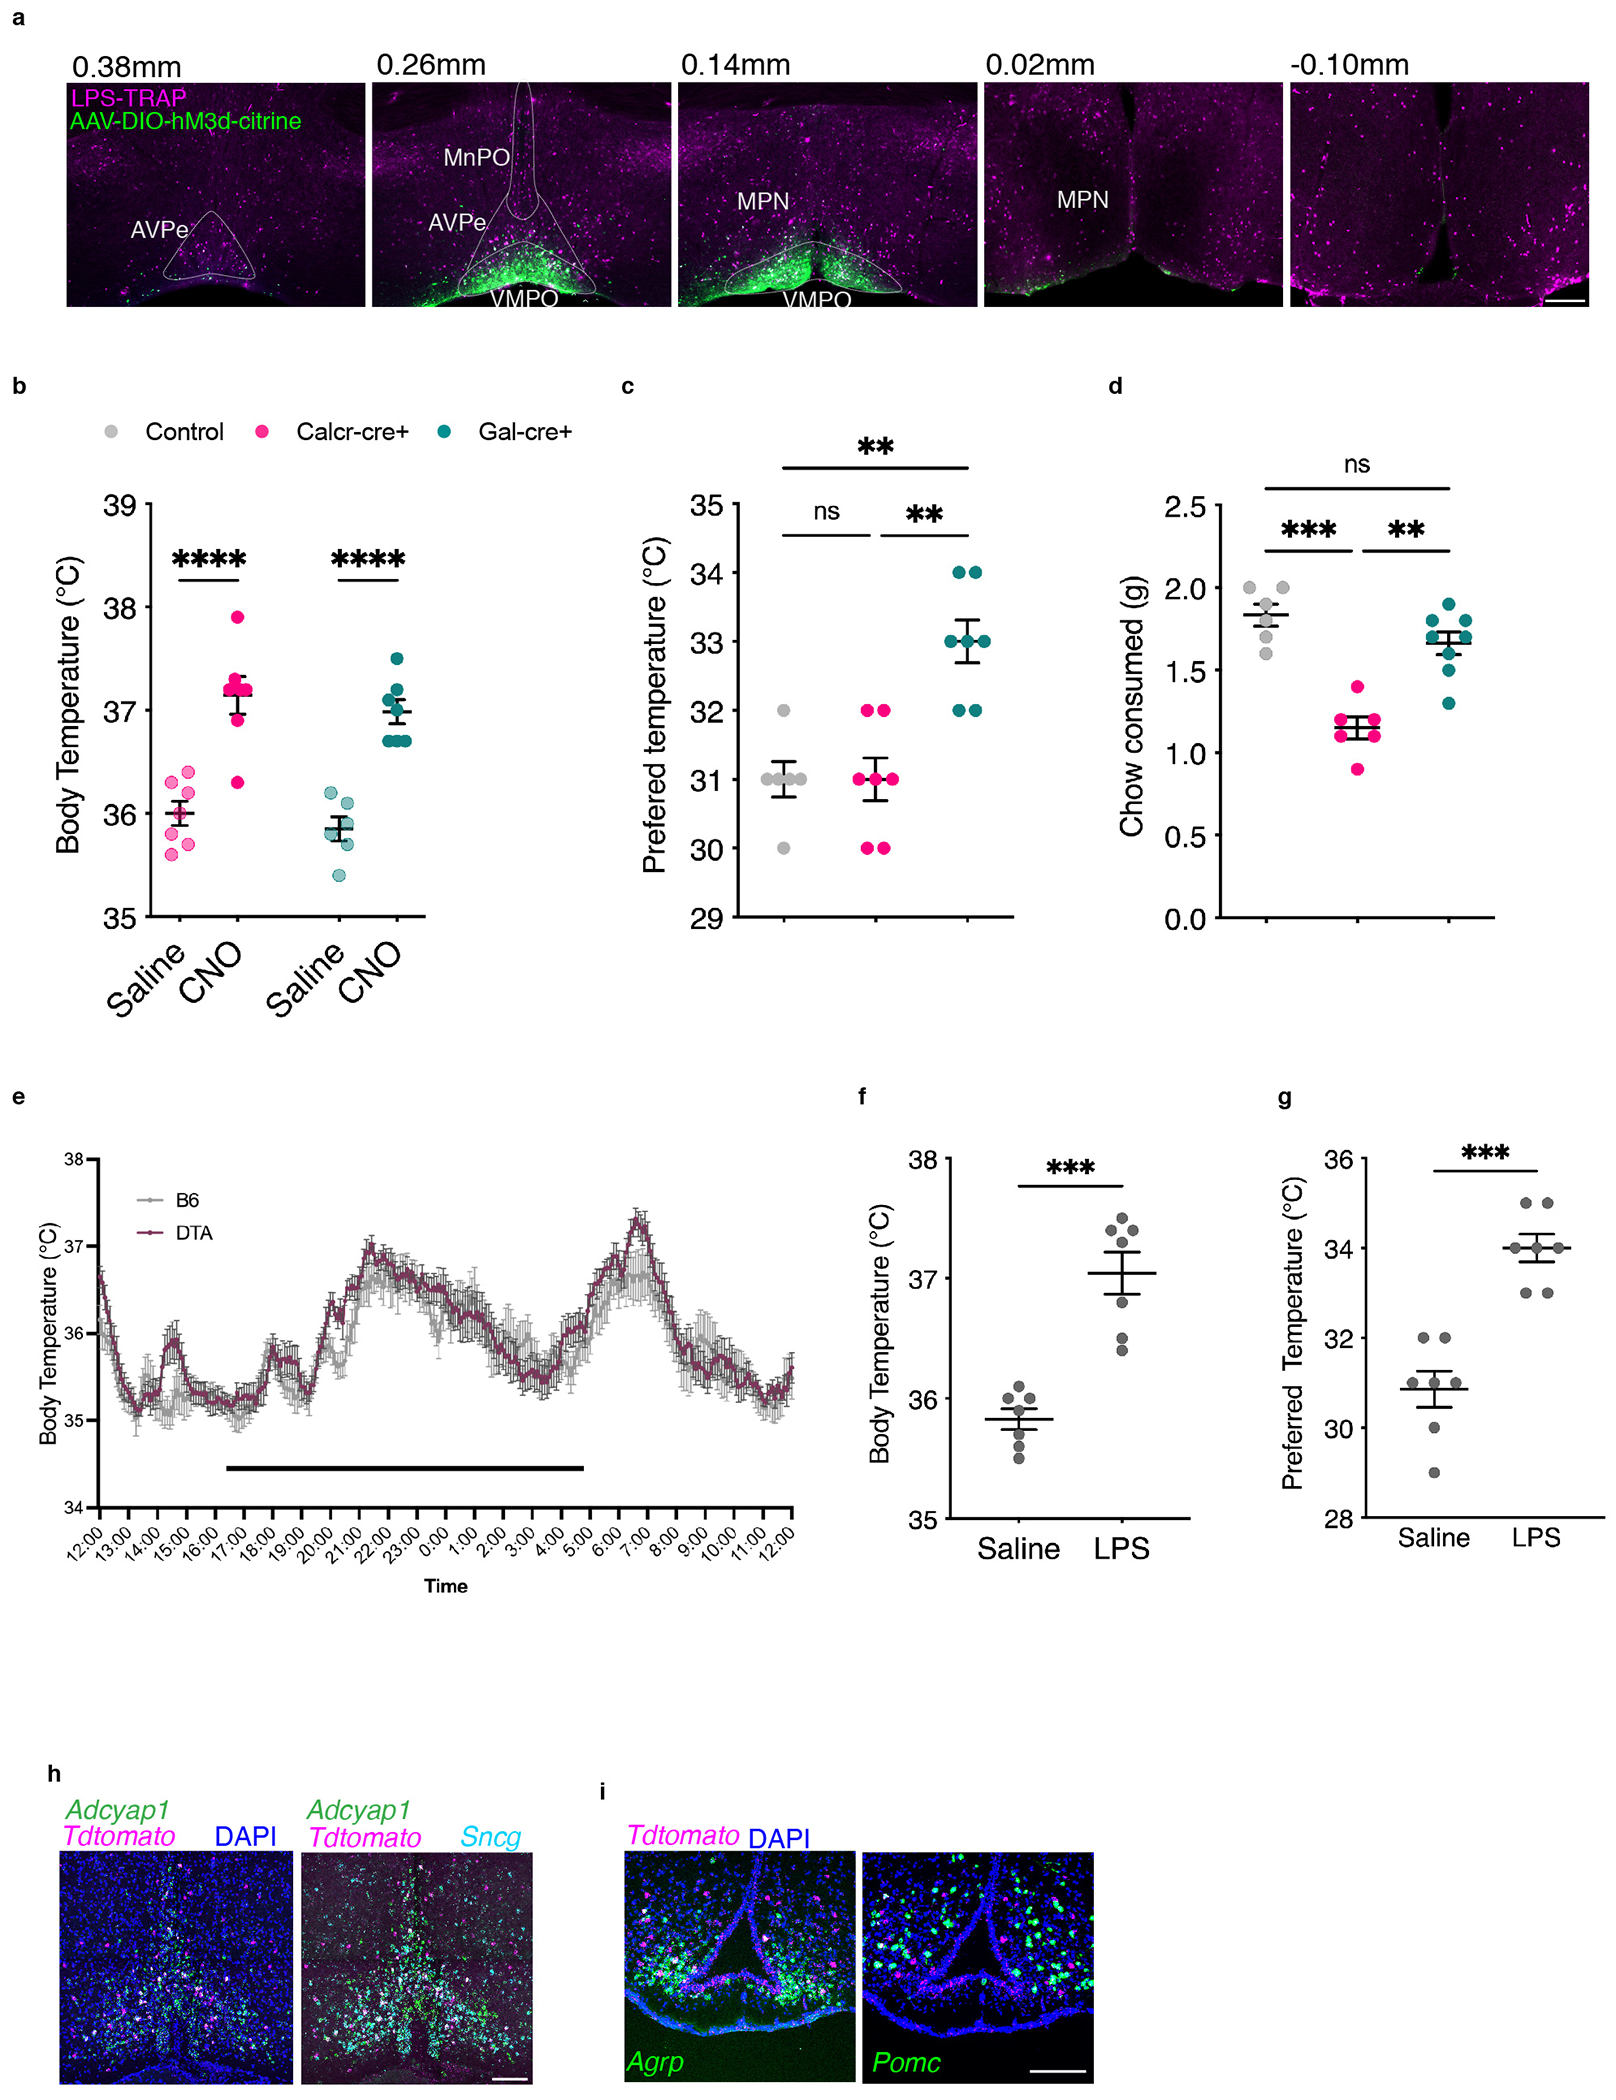
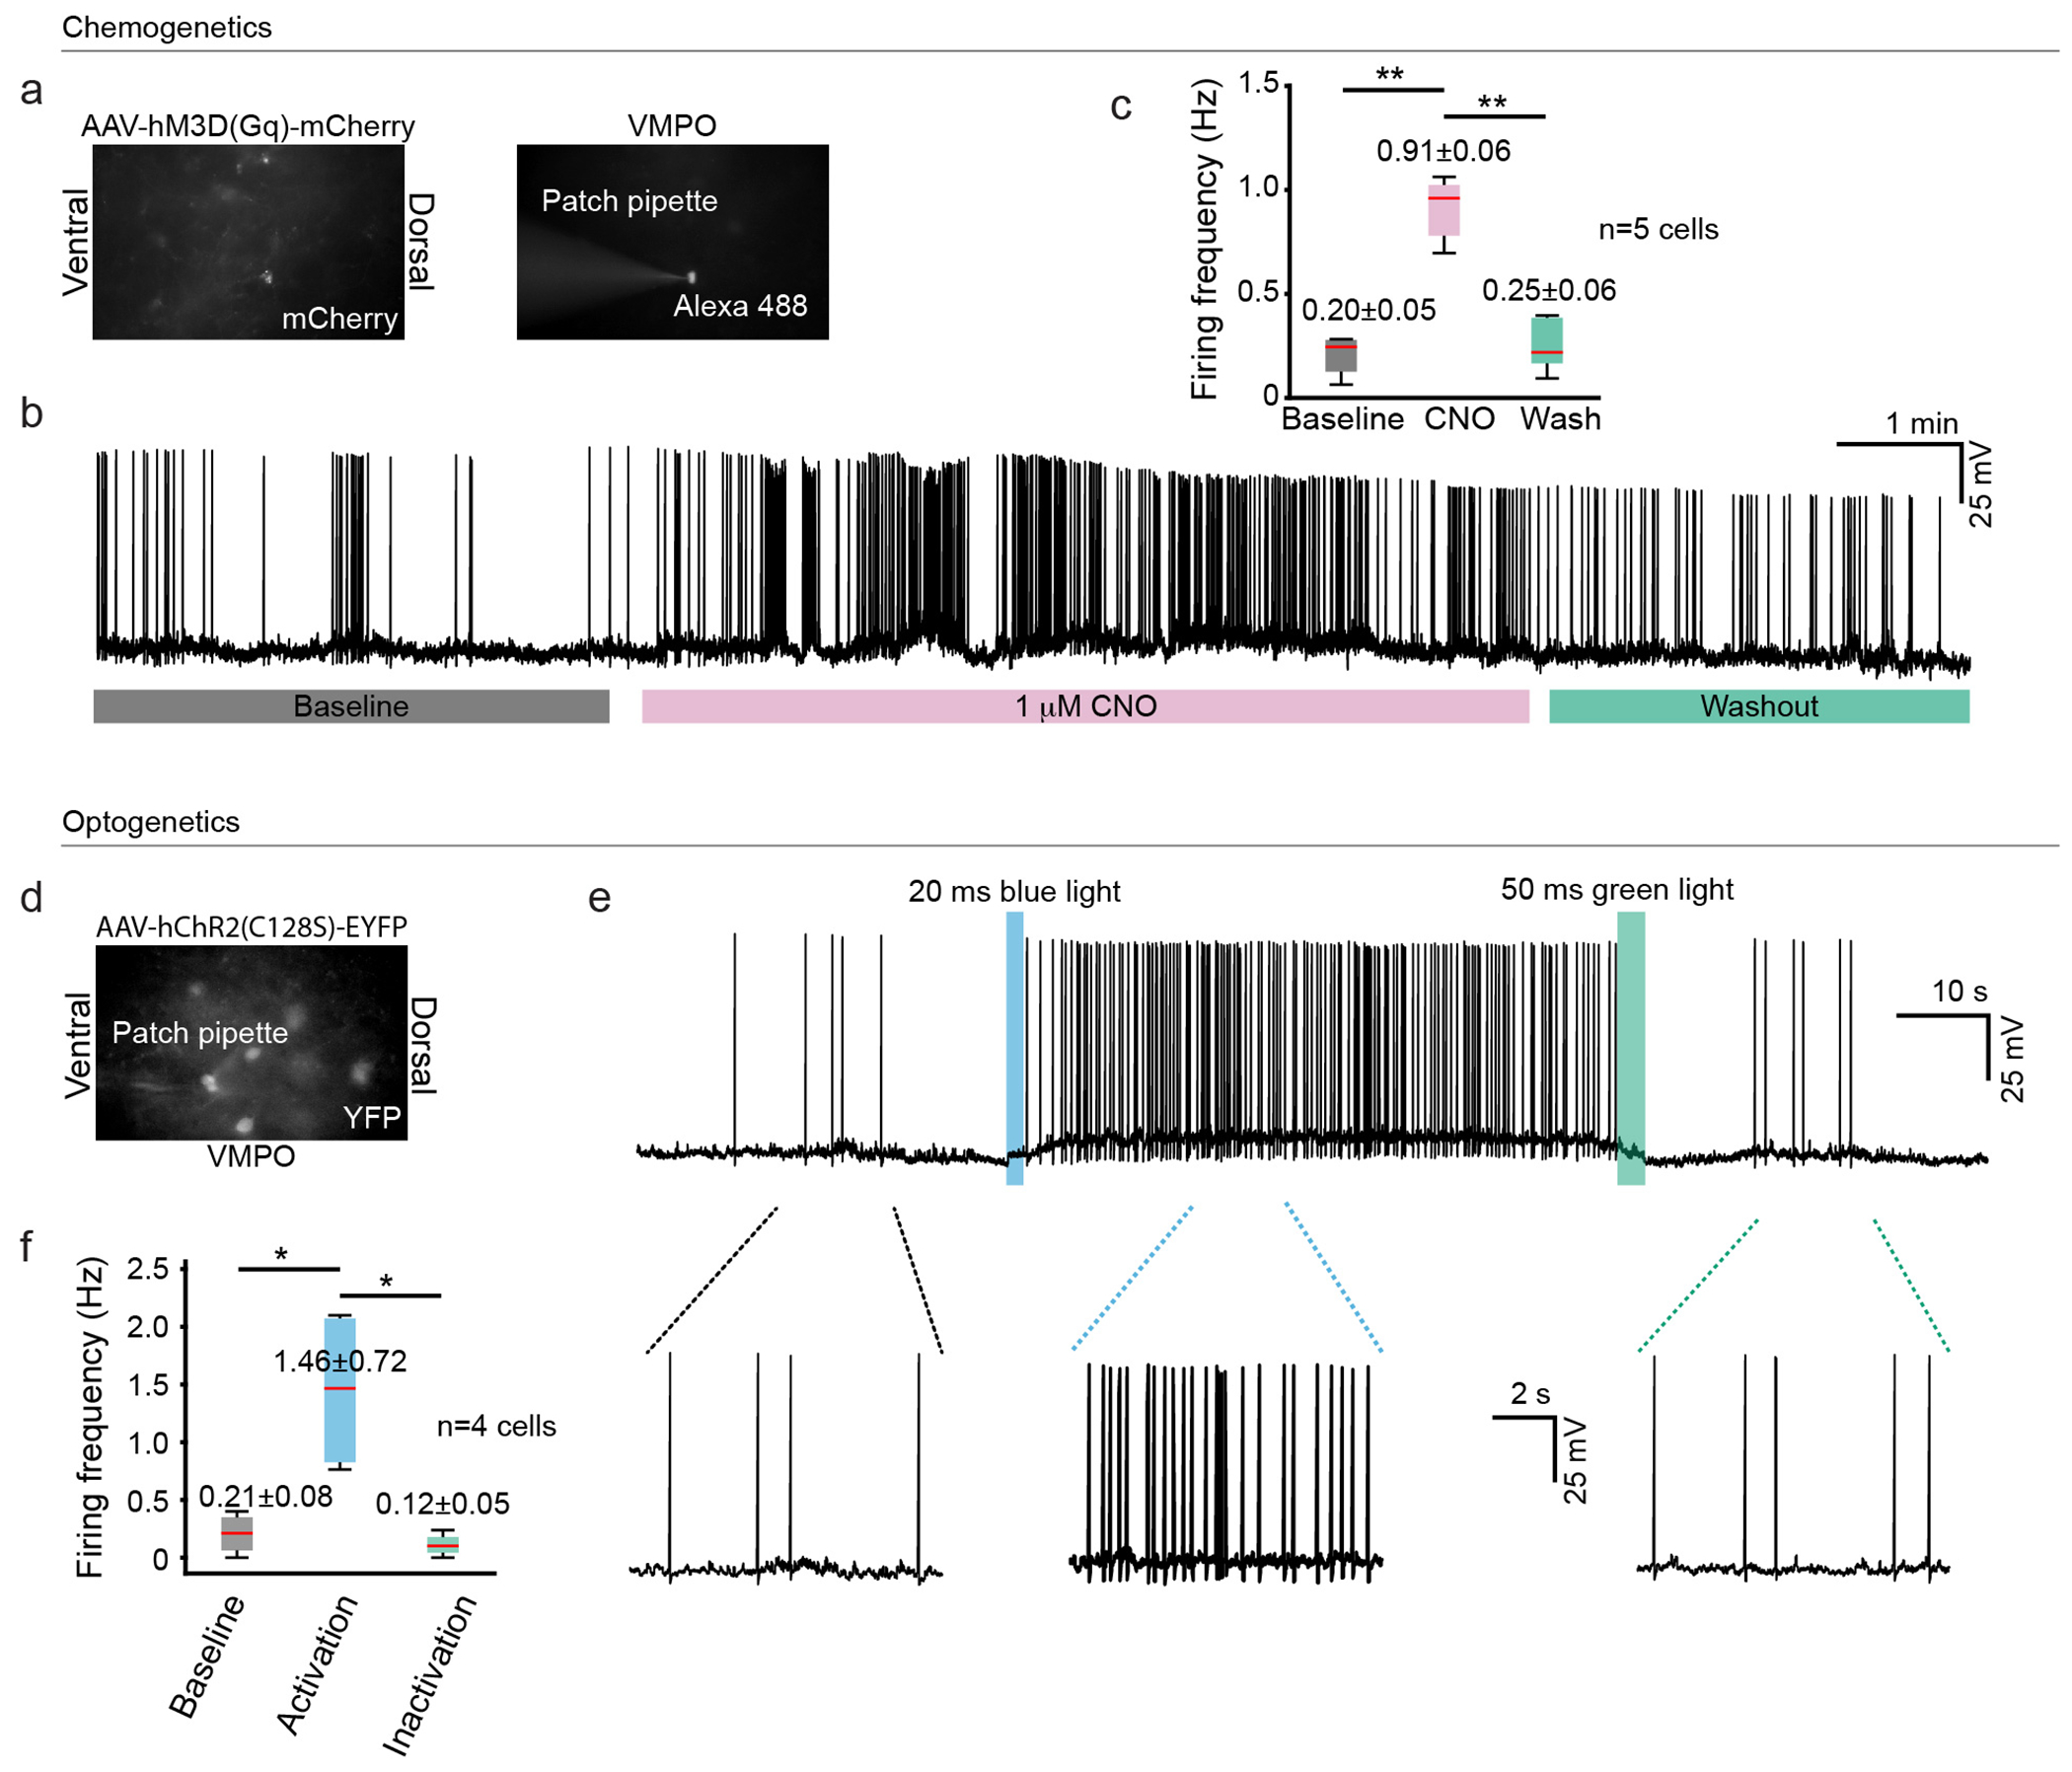
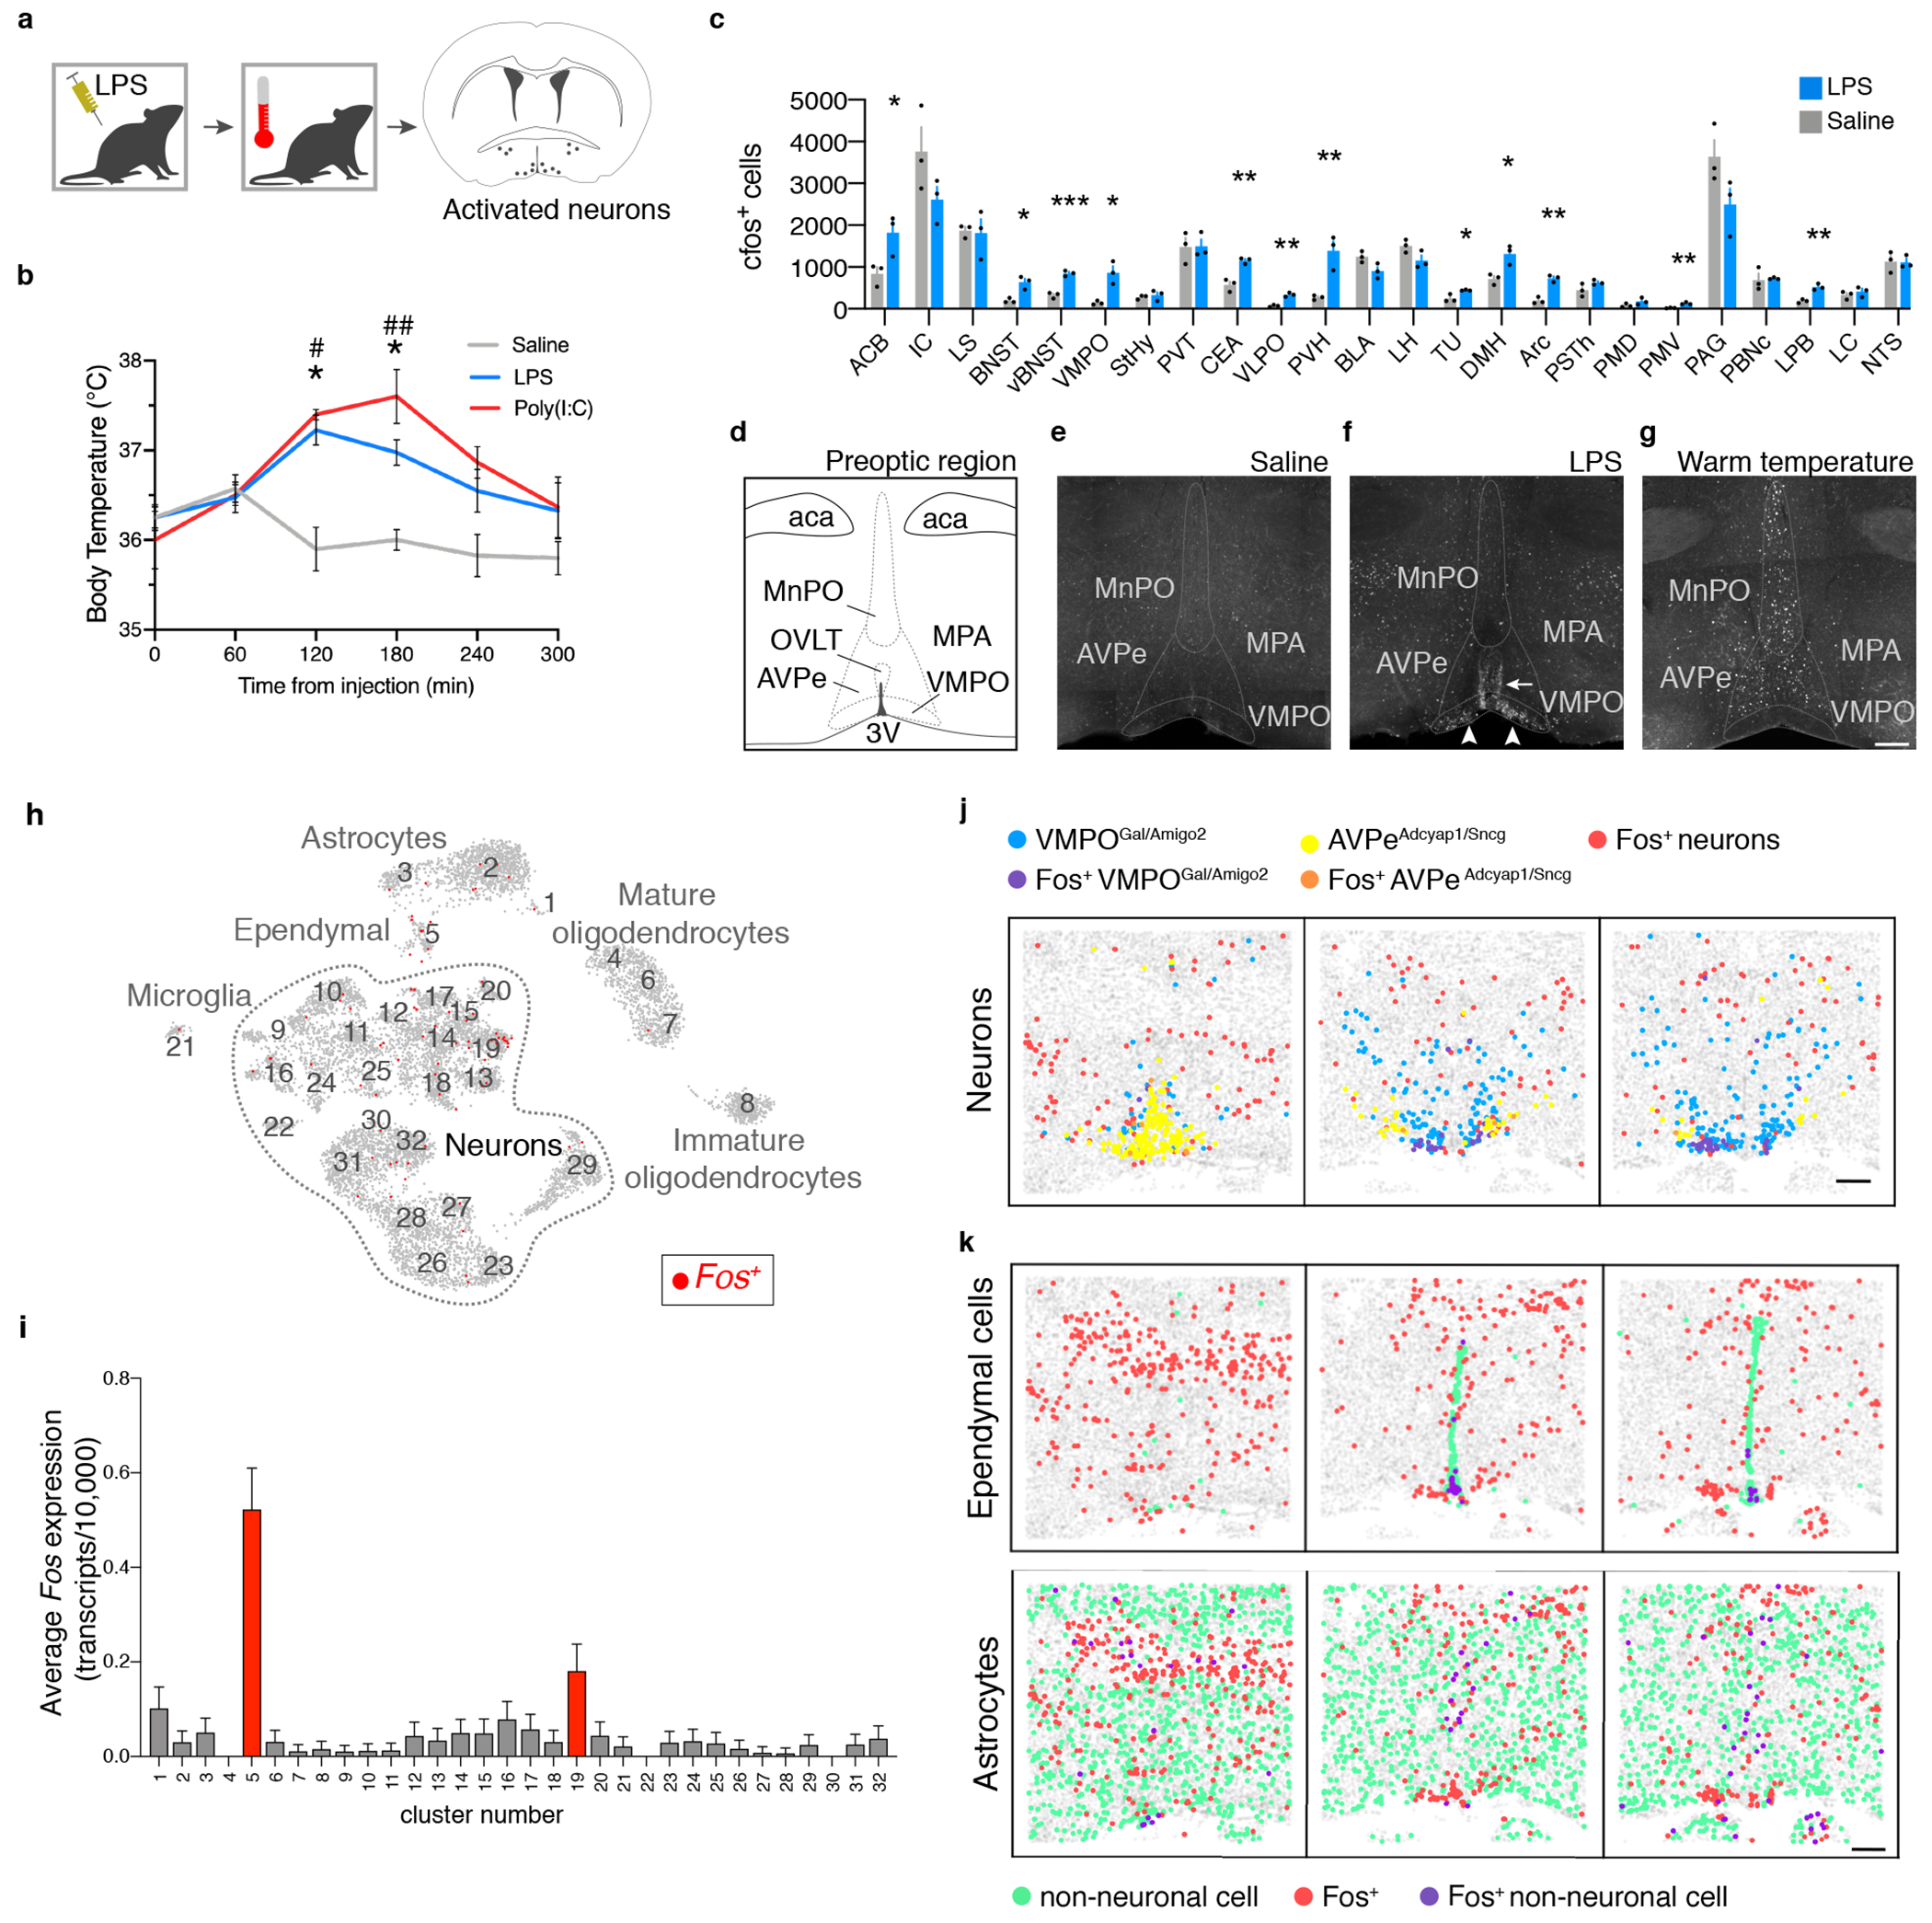
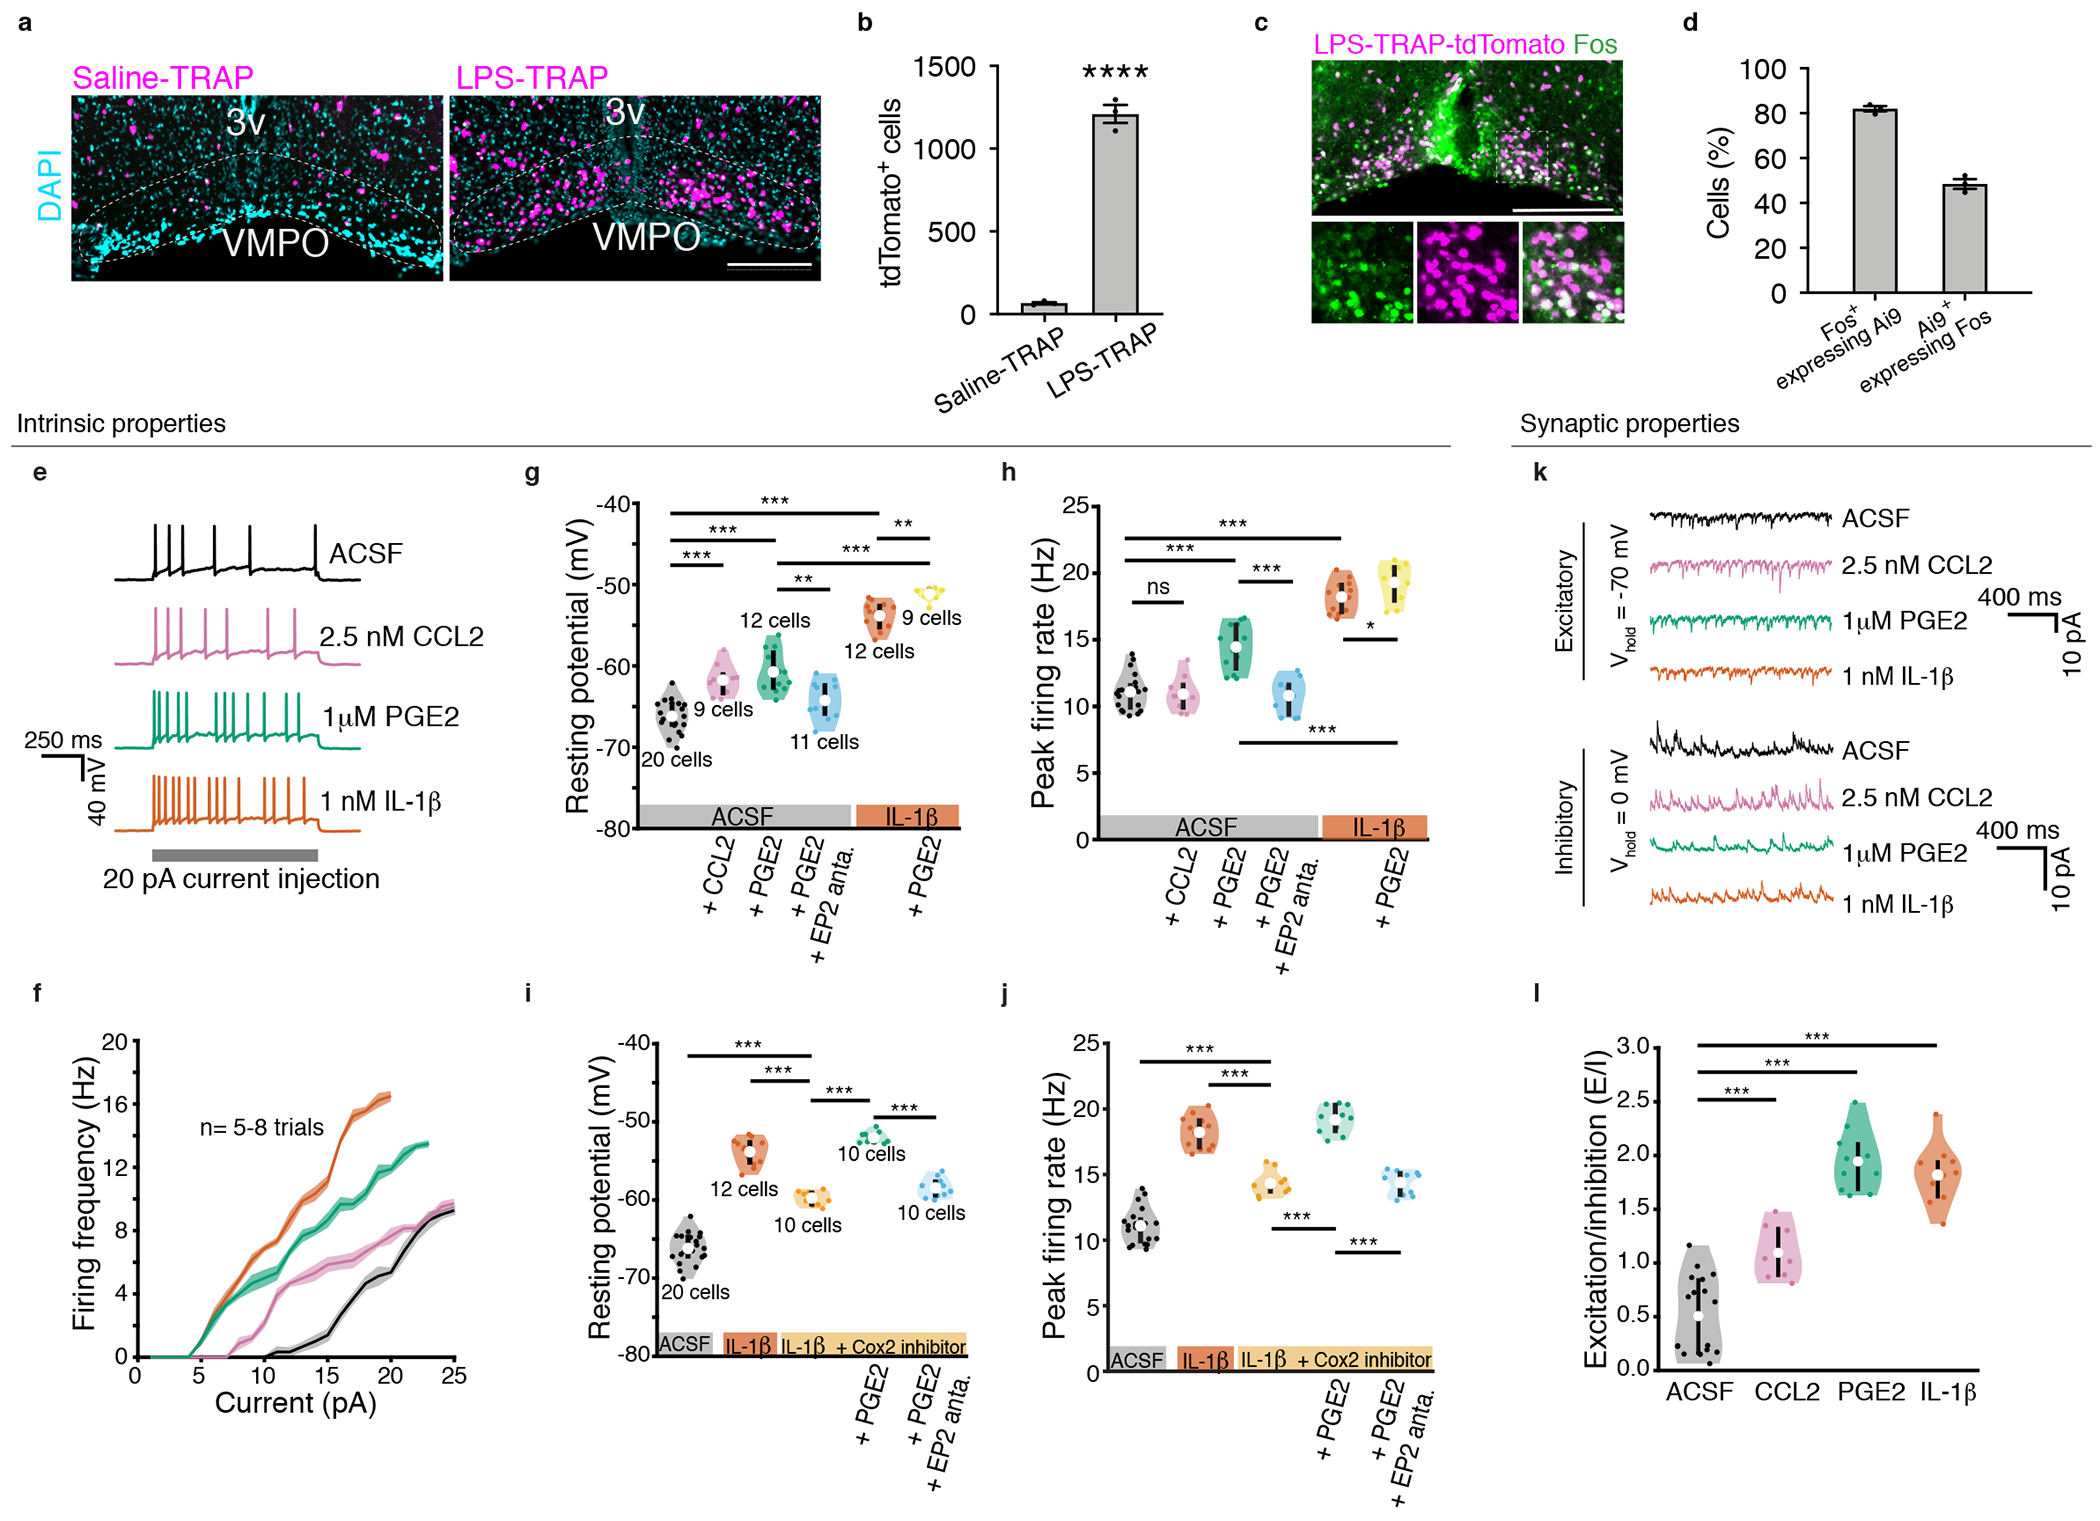
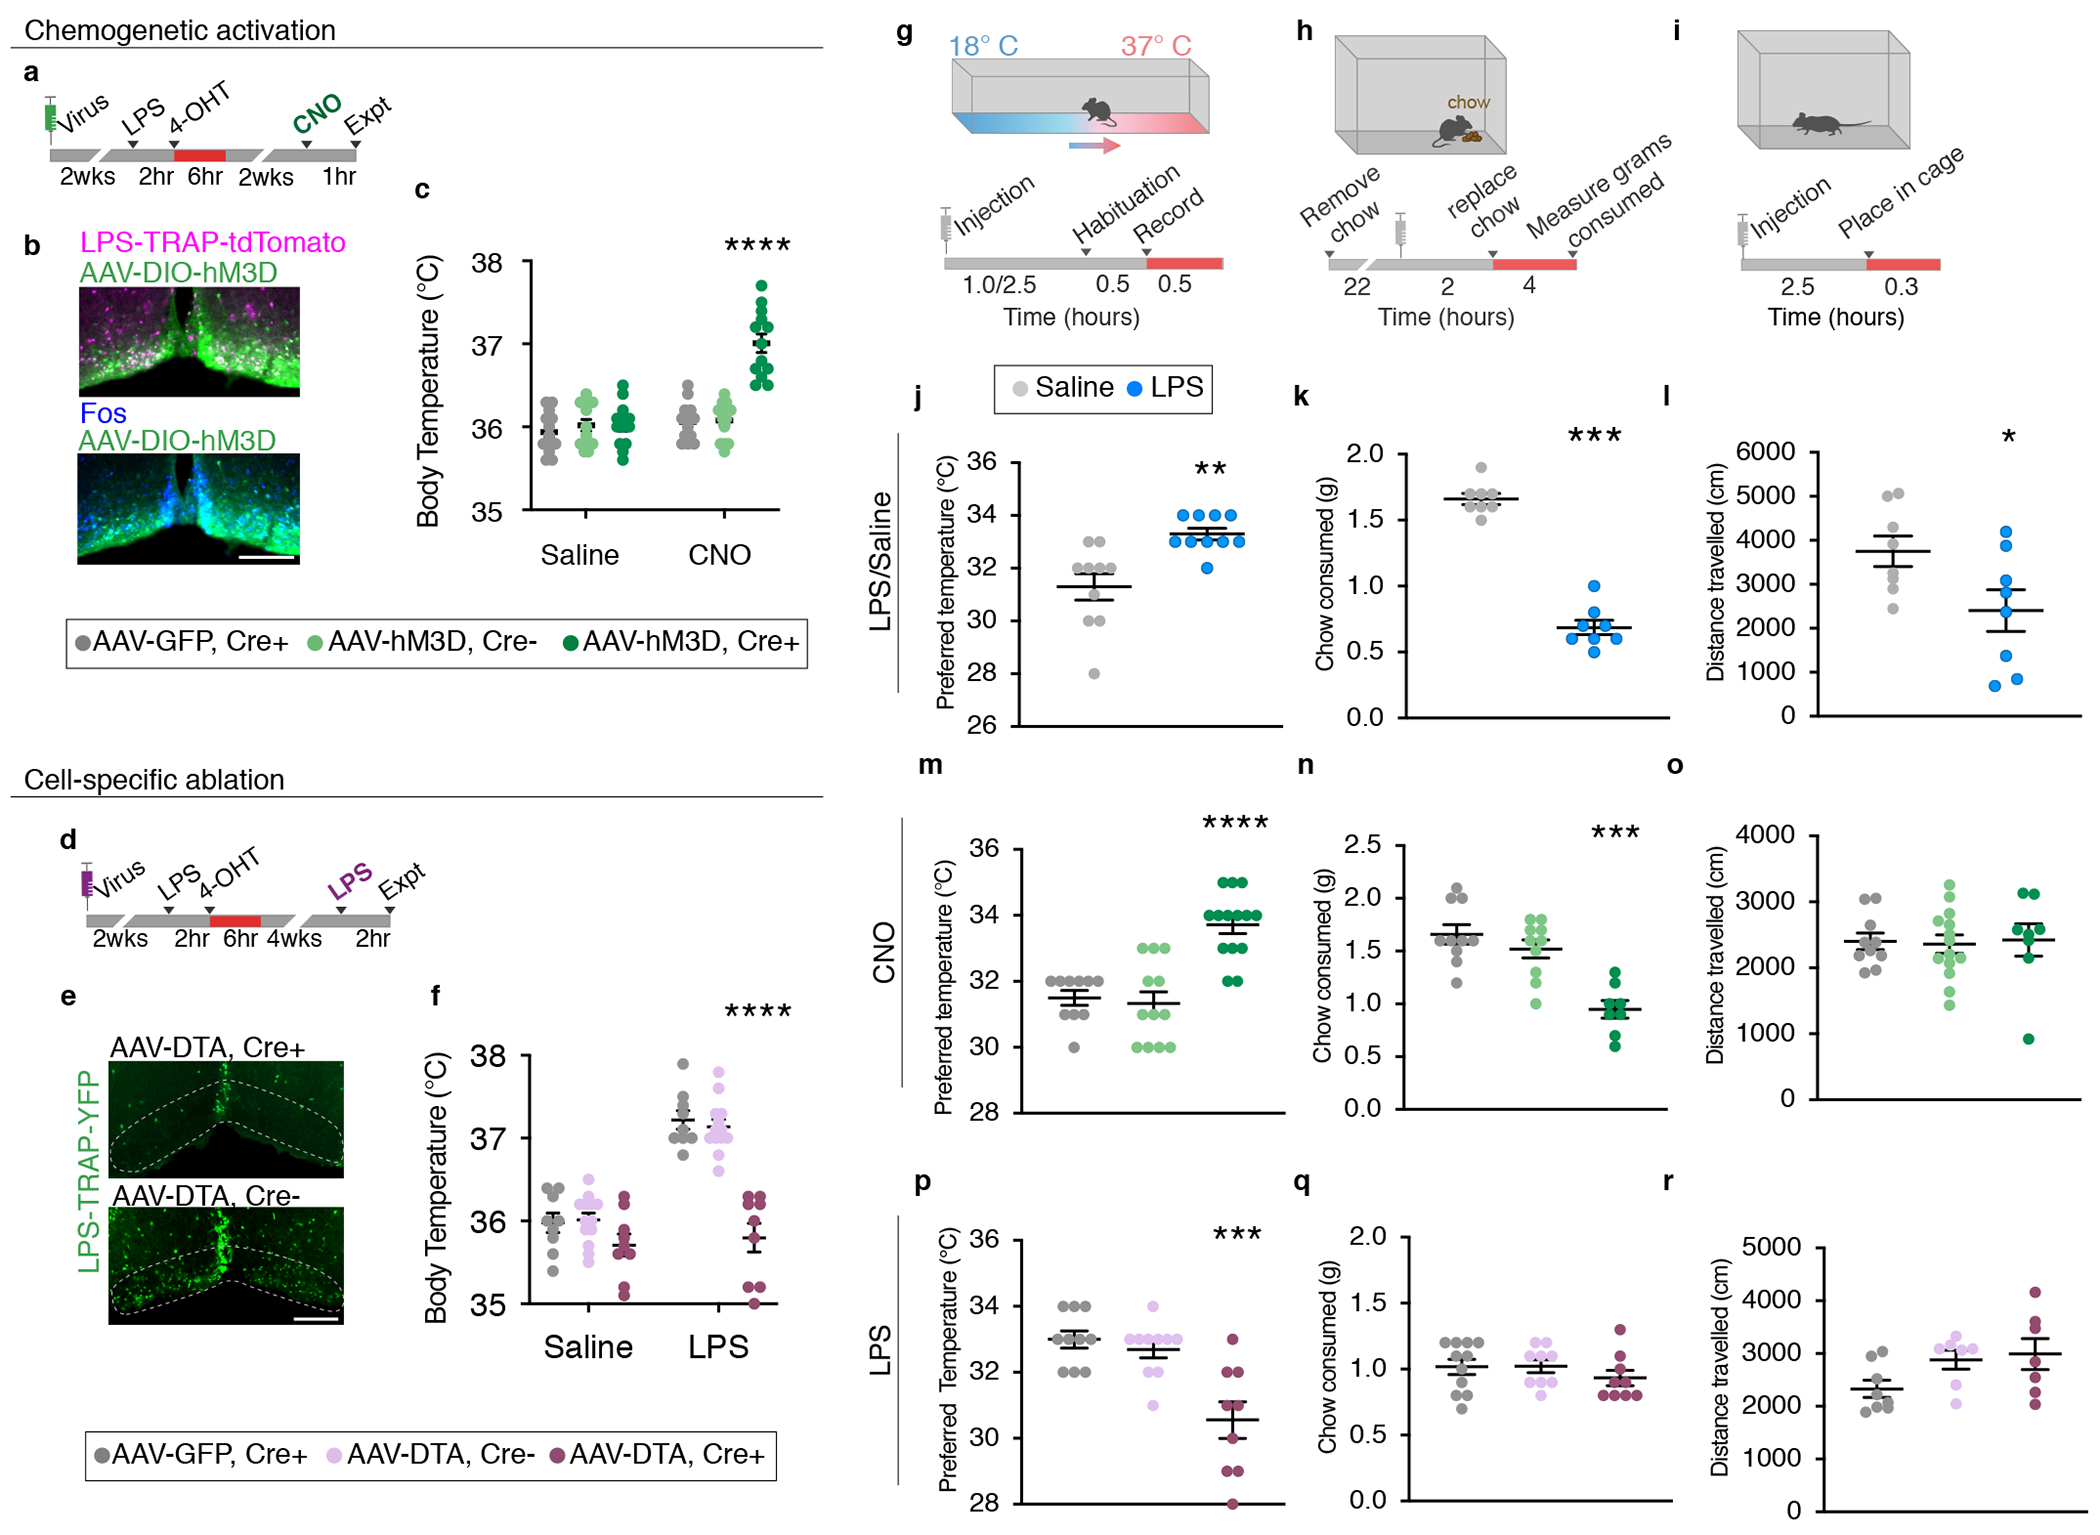
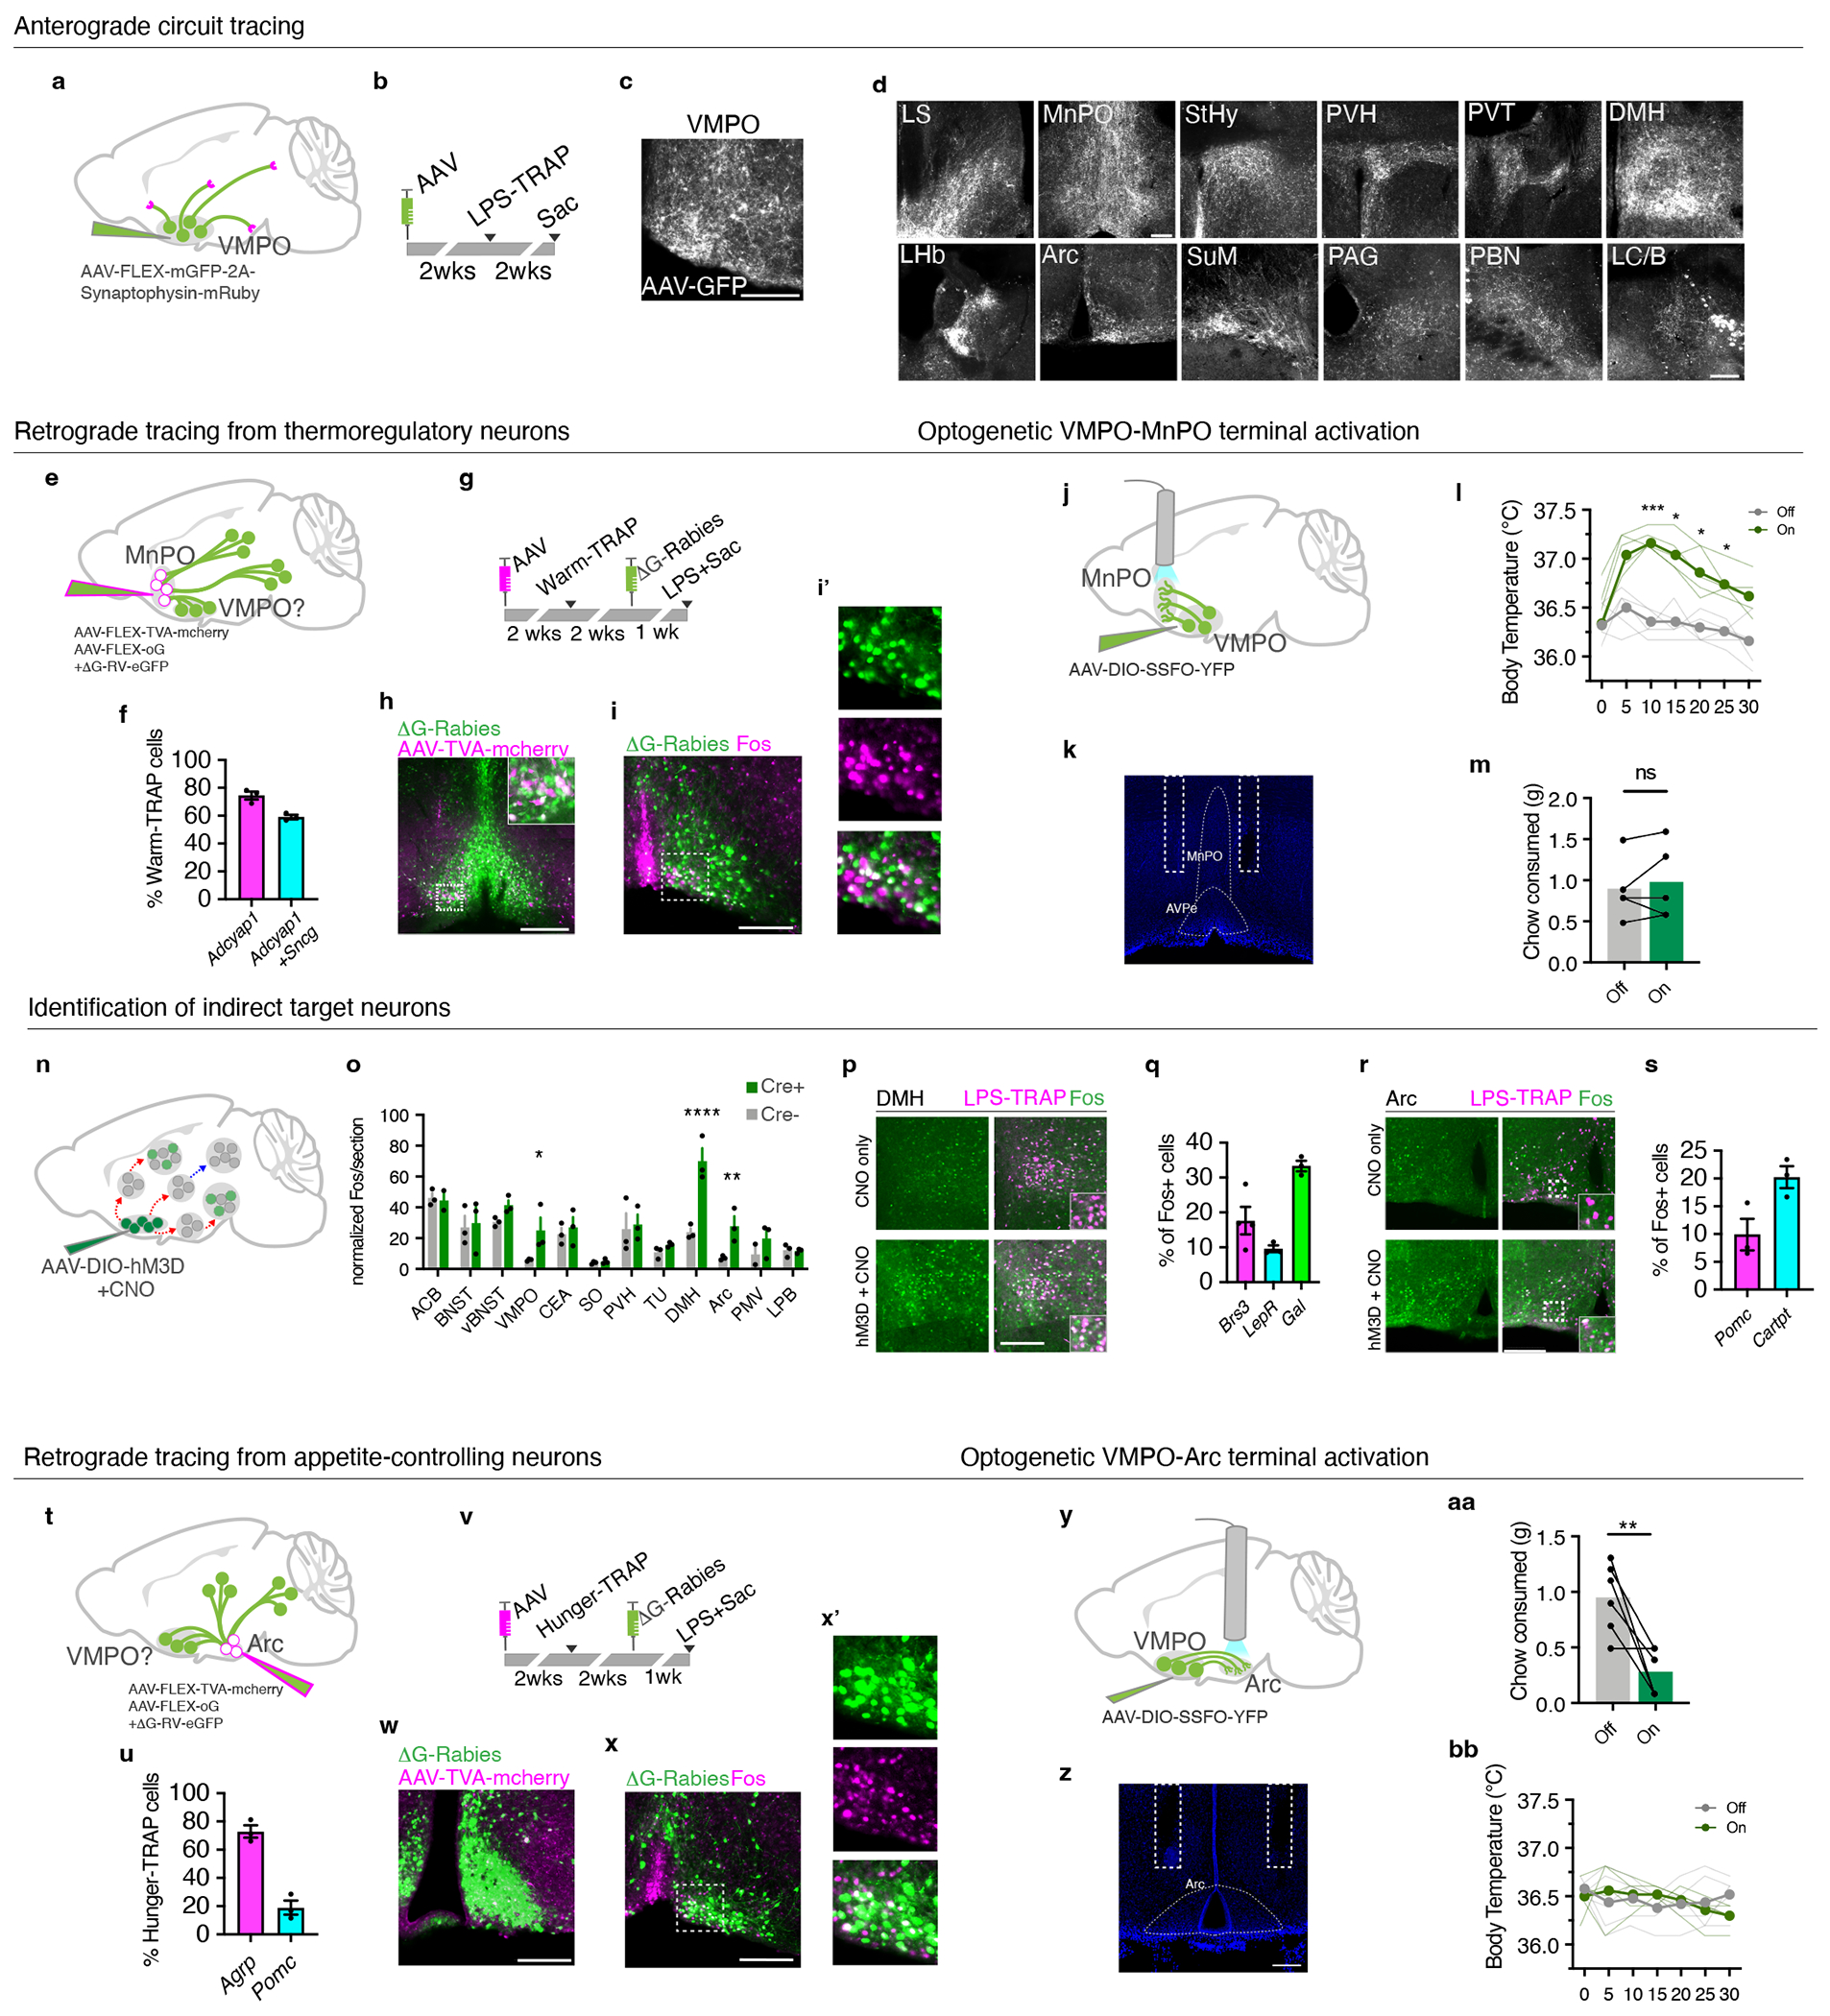
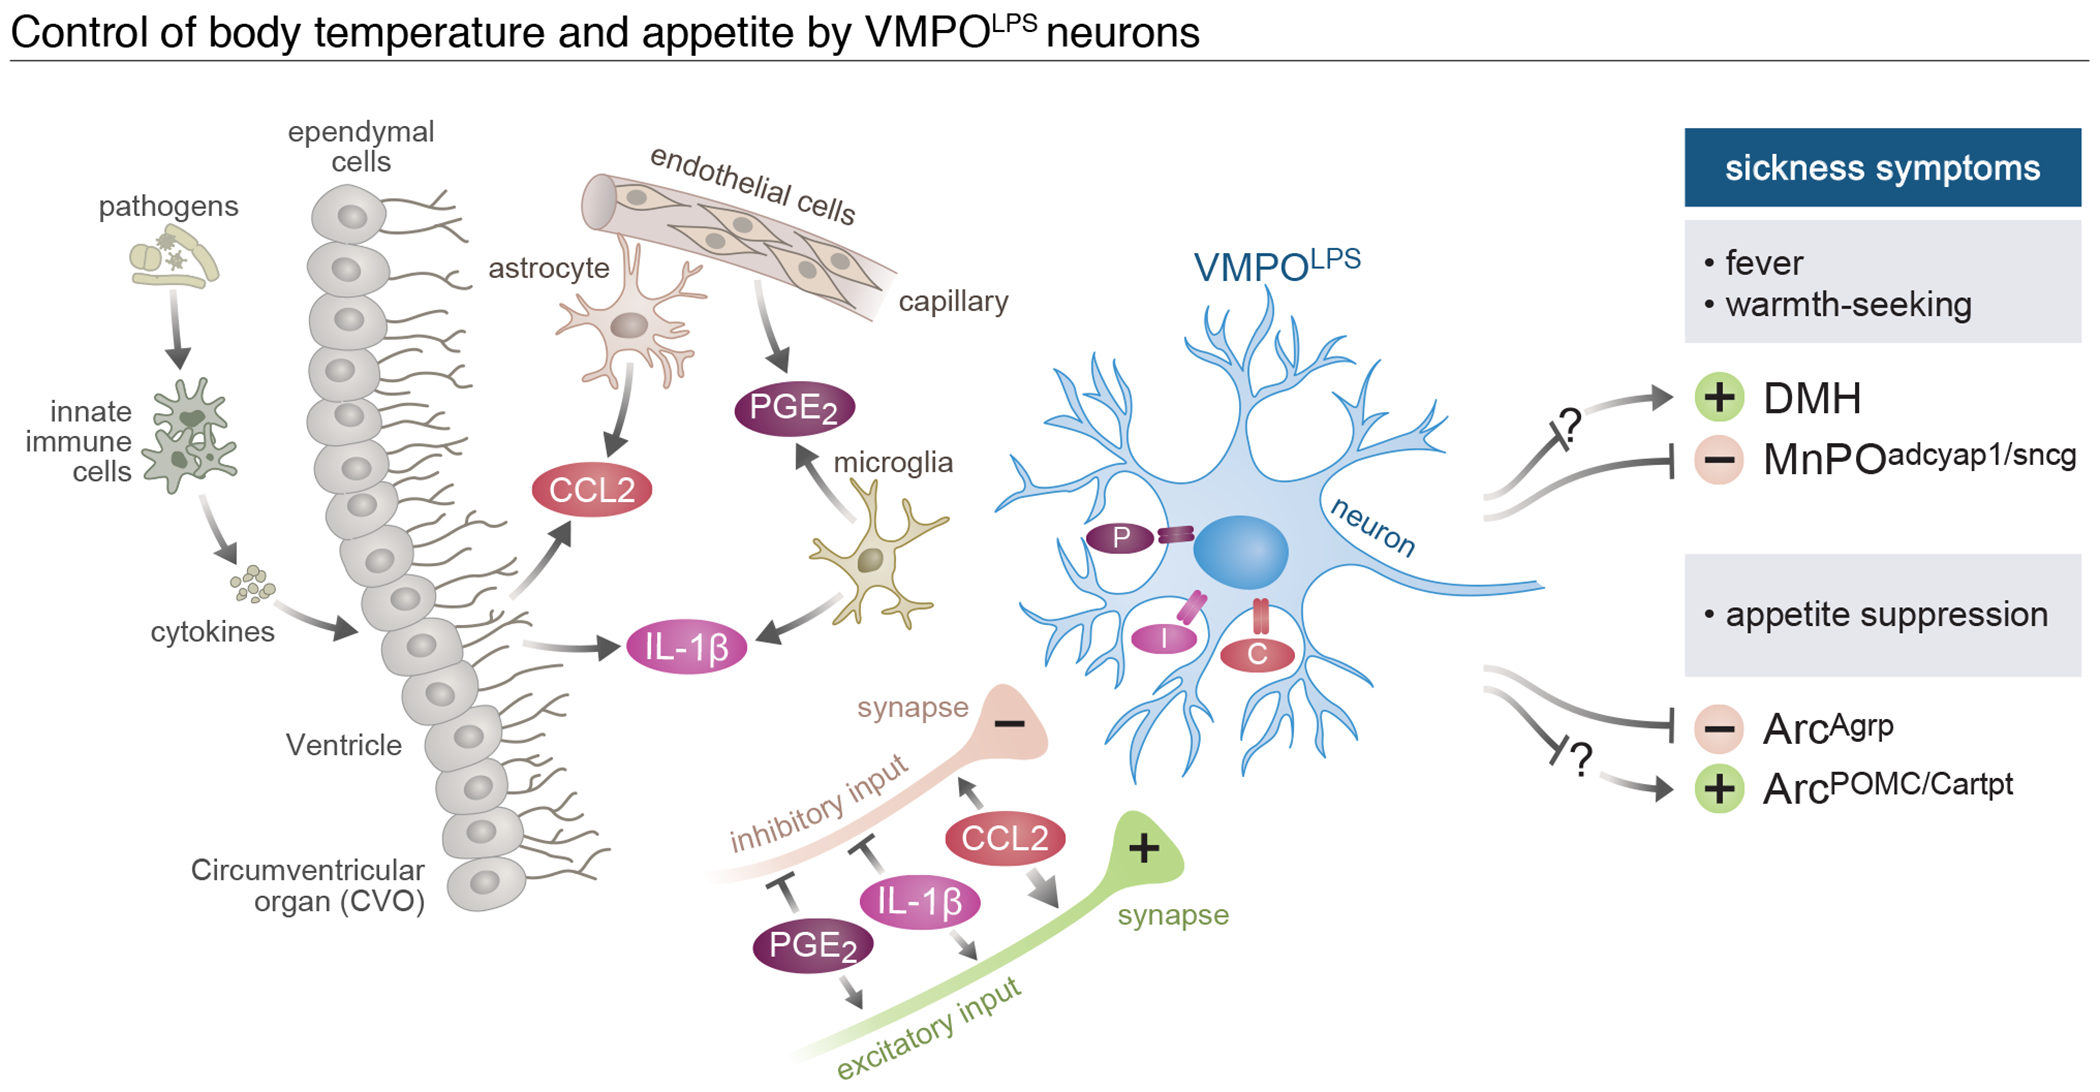
During infection, animals exhibit adaptive changes in physiology and behaviour aimed at increasing survival. Although many causes of infection exist, they trigger similar stereotyped symptoms such as fever, warmth-seeking, loss of appetite and fatigue1,2. Yet exactly how the nervous system alters body temperature and triggers sickness behaviours to coordinate responses to infection remains unknown. Here we identify a previously uncharacterized population of neurons in the ventral medial preoptic area (VMPO) of the hypothalamus that are activated after sickness induced by lipopolysaccharide (LPS) or polyinosinic:polycytidylic acid. These neurons are crucial for generating a fever response and other sickness symptoms such as warmth-seeking and loss of appetite. Single-nucleus RNA-sequencing and multiplexed error-robust fluorescence in situ hybridization uncovered the identity and distribution of LPS-activated VMPO (VMPOLPS) neurons and non-neuronal cells. Gene expression and electrophysiological measurements implicate a paracrine mechanism in which the release of immune signals by non-neuronal cells during infection activates nearby VMPOLPS neurons. Finally, we show that VMPOLPS neurons exert a broad influence on the activity of brain areas associated with behavioural and homeostatic functions and are synaptically and functionally connected to circuit nodes controlling body temperature and appetite. Together, these results uncover VMPOLPS neurons as a control hub that integrates immune signals to orchestrate multiple sickness symptoms in response to infection.


Conflict of interest statement

Competing financial interests

X.Z. is an inventor on patents applied for by Harvard University related to MERFISH.

Figures

Extended Data Figure 1.
Extended Data Figure 1.. Specificity and identity of VMPOLPS neurons during inflammation.
(a) Mean body temperature 2 hours following injection of saline (n=13), LPS (n=16) or Poly(I:C) (n=10). (b-c) Representative images of Fos expression in brain areas displaying significant increases in number of Fos+ cells following LPS administration (b) or saline (c), scale bar for all panels = 200μm. (d) mRNA expression of inhibitory neuronal marker Vgat (green) and Fos (magenta) in the VMPO after LPS injection. (e) Fraction of Fos+ cells that express Vgat or Vglut2 (n=4). (f) Quantification of the fraction of Fos+ cells within individual snRNA-seq clusters in LPS-injected sample. (g) Dotplot of average expression of marker genes and genes with immunological significance in each cluster: dot size indicates percent of cells in cluster with measurable expression and color indicates average expression levels; ependymal cluster cluster #5 and neuronal cluster #19, found significantly activated after LPS injection are highlighted in red. (h) Quantification of the fraction of Fos+ cells in individual MERFISH neuronal clusters, with statically significant enrichment for Fos+ cells indicated in red, n=3. (i) mRNA expression of markers for VMPOLPS neurons (calcR, gal and amigo2) in LPS-injected mice. (j) Mean of overlap of markers for VMPOLPS neurons and for warm-sensitive neurons (adcyap1) with LPS-mediated Fos expression in the VMPO, n=3 mice/experiment. All scale bars = 200μm. All error bars = SEM.
Extended Data Figure 2.
Extended Data Figure 2.. Spatial distribution of activated neuronal and non-neuronal cell type classes in the preoptic area during inflammation.
(a) Cumulative distribution of Fos+ (purple) and Fos− (blue) VMPOGal/Amigo neurons as a function of the distance to the bottom of the section (top) or the midline (bottom), n=3 replicates. (b) MERFISH analysis indicating the fraction of Fos+ cells in major cell type classes in samples from mice injected with LPS versus mice displaying other behaviors: aggression, mating or parenting. Significantly activated populations are indicated in red. (c) Spatial distribution of major cell type classes in MERFISH analysis, cell type (green), Fos+ cell (red), Fos+ cells in the indicated cell type (purple). (d) Cumulative distribution of Fos+ (purple) and Fos− (green) cells in major cell type classes as a function of the distance to the bottom of the section (top) or the midline (bottom), n=3 mice. All scale bars = 200μm. All error bars = SEM.
Extended Data Figure 3.
Extended Data Figure 3.. Expression of key immune molecules and their receptors in the VMPO.
(a-i) mRNA expression in the VMPO at 2hrs post LPS administration, genes of interest in green, LPS-induced Fos is in magenta. Scale bar for a-i = 200μm (a) Prostaglandin E synthase 2 (ptgs2) and its receptors ep2 (d), ep1 (g), ep3 (h), ep4 (i). (b) interleukin-1β (il1β) and its receptor il1rap (e). (c) chemokine ligand 2 (ccl2) and it’s receptor chemkine receptor 2 (ccr2) (f). (j) Expression of ptgs2 in absence of LPS stimulation and at 60min and 120min post LPS. No or weak expression is found without LPS stimulation, and expression after LPS challenge shows overlap with markers for endothelial cells and microglia. (k) Expression of il1β with no stimulation and at 60min and 120min post LPS, overlap with markers for ependymal cells and microglia. Scale bar for j-l = 50μm (l) Expression of ccl2 with no stimulation and 120 min post LPS inejction, overlap with gfap+ astrocytes. (m) Expression of il1r1 in the VMPO after LPS injection, Scale bar = 200μm.
Extended data figure 4:
Extended data figure 4:. Effects of PGE-2 and cytokines on the intrinsic properties and synaptic activity of VMPOLPS neurons.
(a) Wide field microscope images depicting tdTomato expression in the VMPO of TRAP2;Ai9 during whole cell patch clamp recording with pipette containing Alexa 488. (b) Changes in rheobase current for VMPOLPS neurons in presence of ACSF (black), CCL2 (pink), PGE2 (green), addition of EP2 antagonist in presence of PGE2 (blue), IL-1β (orange) and further addition of PGE2 (yellow), and (c) IL-1β (orange), addition of COX-2 inhibitor in the presence of IL-1β (light orange), further addition of PGE2 (light green) and further addition of EP2 antagonist (light blue). During whole cell voltage clamp recordings, changes in (d) amplitude of miniature EPSCs, (e) inter event interval for miniature EPSCs, (f) amplitude of miniature IPSCs and (g) inter event interval for miniature IPSCs for VMPOLPS neurons in presence of ACSF (black), CCL2 (pink), PGE2 (green), addition of EP2 antagonist in presence of PGE2 (blue), IL-1β (orange) and further addition of PGE2 (yellow). Changes in (h) amplitude of miniature EPSCs, (i) inter event interval for miniature EPSCs, (j) amplitude of miniature IPSCs and (k) inter event interval for miniature IPSCs for VMPOLPS neurons in the presence of IL-1β and COX-2 inhibitor (light orange), further addition of PGE2 (light green) and further addition of EP2 antagonist (light blue). (l) Cumulative plots showing total charge transferred over 1s for inhibitory events and excitatory events for control (black) and CCL2 (pink). (m, top) Cumulative charge transferred by IPSCs for control (mean value of 24.81 ± 0.14 μC/s) and CCL2 (mean value of 19.06 ± 0.09 μC/s p = 2.0 * 10−03 for). (m, bottom) Cumulative charge transferred by miniature EPSCs for control (mean value of 18.81 ± 0.09 μC/s) and CCL2 (mean value of 23.37 ± 0.11 μC/s p = 9.0 * 10−03 ). All other values and statistical tests are catalogued in extended data table 2. For violin plots, central white circle depicts the mean value and thick black line depicts the interquartile range. All p values shown are for two-sided Wilcoxon rank sum test with * = p<0.05, ** = p<0, *** = p<0.005 and ns = p>0.05. All error bars = SEM. See Statistics and Reproducibility section for exact n values.
Extended Data Figure 5.
Extended Data Figure 5.. Specificity of viral injections and cell type identity.
(a) Example of viral injection specificity that qualified for inclusion in the study. Note viral expression in the VMPO and absence in surrounding brain areas. Injections found to be more broadly dispersed were not included in analysis. (b-d) Chemogenetic activation of Calcr+ and Gal+ neurons in the VMPO. (b) CNO injection elicited strong increase in body temperature in both genetic backgrounds (n=6 mice/group). (c) Activation of Gal-Cre but not Calcr-Cre increased preferred temperature (n=7mice/group). (d) Activation of Calcr-Cre (n=6 mice) but not Gal-Cre (n=8) decreased chow consumed (saline n=6 mice). (e) DTA-mediated Ablation of VMPOLPS neurons had no effect on circadian temperatures, dark bar indicates dark phase, WT mice were used as controls. (f-g) Effect of DTA-mediated ablation of VMPO neurons in Saline-TRAP mice had no effect on body temperature or preferred temperature following LPS injection (n=7 mice/group). (h) Overlap of warm-TRAP reporter expression with markers of warm-sensitive neurons adcyap1 and sncg. (i) Overlap of hunger-TRAP-mediated reporter expression (magenta) with markers of appetite-increasing neurons, agrp, or appetite-decreasing neurons, pomc, (green). Scale bars = 200μm. All error bars = SEM. For all graphs * =p<0.05, ** =p<0.01, *** =p<0.001
Extended data figure 6:
Extended data figure 6:. Chemogenetic and optogenetic activation of VMPOLPS neurons.
(a) Widefield microscope images of VMPOLPS neurons in the VMPO of TRAP2 injected with AAV8-hSyn-DIO-hM3D(Gq)-mCherry. (b) Whole cell current clamp recording of a VMPOLPS neuron showing the effects of bath application of 1mM CNO (baseline: black, CNO: pink and washout: green). (c) Effects of CNO application on the firing rate of VMPOLPS neurons; black (n= 5 cells with mean values of 0.20± 0.05 Hz for baseline), pink (0.91 ± 0.06 Hz for CNO application and p = 7.0 * 10−03 compared to baseline), green (0.25 ± 0.06 Hz for washout and p = 6.9 * 10−03 compared to CNO application), boxes represent the 25th and 75th percentile, whiskers extend to the minimum and maximum data points (d) Widefield microscope images of VMPOLPS neurons in the VMPO of TRAP2 injected with AAV5-EF1a-DIO-hChR2(C128S/D156A)-EYFP. (e) Whole cell current clamp recording of a VMPOLPS neuron showing activation of hChR2(C128S/D156A) by 20 ms blue light (460 ±10 nm) light pulse and inactivation by 50 ms green light (525±9 nm) pulse. (f) Firing rate of VMPOLPS neurons (n=4 cells) in response to activation of hChR2(C128S/D156A), baseline (black, mean firing frequency of 0.21±0.08 Hz), following blue light activation (blue, mean firing frequency of 1.46±0.72 Hz and p = 2.1 * 10−02 ) and following green light mediated inactivation of hChR2(C128S/D156A) (green, mean firing frequency of 0.12±0.05 Hz and p = 2.0 * 10−02 ), boxes represent the 25th and 75th percentile, whiskers extend to the minimum and maximum data points. All p values shown are for two-sided Wilcoxon rank sum test with * = p<0.05, ** = p<0, *** = p<0.005 and ns = p>0.05.
Figure 1.
Figure 1.. Activation of a specific VMPO neuronal population after LPS administration.
(a) Mice given an intraperitoneal injection of LPS or Poly(I:C) were monitored for changes in body temperature and brain Fos expression. (b) Mean body temperature following injection of saline, LPS or Poly(I:C), time zero is prior to injection, n=10/group. (c) Mean number of Fos+ cells per brain nucleus, n=3/group, Two-way ANOVA, for all graphs * =p<0.05, ** =p<0.01, *** =p<0.001. (d) Nuclei within the anterior preoptic region, see Extended Data Table 1 for brain area abreviations. (e-g) Fos expression after injection of saline (e), LPS (f) or warm temperature challenge (g), scale bar = 200μm, arrowheads: LPS-activated cells in the VMPO, arrow: LPS-activated cells lining the ventricle. (h) UMAP representation of 32 cell clusters identified by snRNA-sequencing. (i) Mean expression of Fos in snRNA-seq clusters, 16,430 total nuclei, 5 pooled mice, red bars indicate statistical significance, two-sided Mann-Whitney test, (p<0.05). (j) Representative spatial distribution of selected cell populations identified by MERFISH at approximately bregma +0.2mm, +0.0mm, −0.2mm. (k) Representative spatial distribution of ependymal cells (top) and astrocytes (bottom) identified by MERFISH in the preoptic region. Scale bars = 200μm. All error bars = SEM.
Figure 2.
Figure 2.. Effect of CCL1, PGE2 and IL-1β on intrinsic and synaptic properties of VMPOLPS neurons.
(a) Reporter expression in the VMPO following Saline-TRAP or LPS-TRAP. 3v= 3rd ventricle. (b) Average tdTomato+ cells in the VMPO, n=3/group, students t-test, p=<0.0001. (c) Overlap of LPS-TRAP neurons and subsequent LPS-induced Fos expression. (d) Mean percent of signal overlap in (c), n=3/group. All scale bars = 200μm (e) Examples of current clamp recordings of VMPOLPS neurons, control (black), 2.5nM CCL2 (pink), 1μM PGE2 (green) and 1nM IL-1β (orange). (f) Firing rate as a function of current injection; control n=8 trails, CCL2 n=5 trials, PGE2 n=5 trials, IL-1β n=7 trials. (g) Membrane resting potential and (h) peak firing rate of VMPOLPS neurons, control (black), CCL2 (pink), PGE2 (green), and addition of EP2 antagonist (blue) in presence of PGE2, IL-1β (orange) and IL-1β with additional PGE2 (yellow). (i) Resting membrane potential and (j) peak firing rate of VMPOLPS neurons after IL-1β (orange), addition of COX-2 inhibitor (light orange), addition of PGE2 (light green) and addition of EP2 antagonist (light blue). (k) Voltage clamp recordings, control (black), CCL2 (pink), PGE2 (green) and IL-1β (orange) showing mEPSCs (top) and mIPSCs (bottom). (l) Changes in excitatory to inhibitory charge transfer for control (black), CCL2 (pink, mean=1.10 ± 0.06, p = 2.20 * 10−04), PGE2 (green, mean=1.95 ± 0.09, p = 1.77 * 10−05) and IL-1β (orange, mean=1.82 ± 0.08, p = 1.83 * 10−05). See Extended Data Table 1 for all values and statistical tests. For violin plots: mean = central white circle, black line = interquartile range. All error bars = SEM. P values = two-sided Wilcoxon rank sum test with * = p<0.05, ** = p<0, *** = p<0.005 and ns = p>0.05. See Statistics and Reproducibility section for n’s.
Figure 3.
Figure 3.. VMPOLPS neurons drive LPS-induced generation of fever, warmth-seeking behavior and appetite suppression
(a) Experimental procedure for VMPOLPS chemogenetic activation. (b) Expression of chemogenetic activating receptor hM3D (green) in LPS-TRAP cells in the VMPO (magenta) and CNO-induced Fos expression (blue). (c) Mean body temperature post- saline or CNO injection in Cre+ mice expressing hM3D (dark green), Cre− mice expressing hM3D (light green) or Cre+ mice expressing GFP (grey) controls, Two-way ANOVA, p=<0.0001. (d) Experimental procedure for VMPOLPS cell ablation by diphtheria toxin (DTA). (e) LPS-TRAP cells (green) in the VMPO after cell ablation (top panel) compared to control (bottom panel). (f) Mean body temperature following saline or LPS injection in DTA-ablated mice (dark purple) and Cre− mice injected with AAV-DTA (light purple) and Cre+ mice expressing GFP (grey) controls, Two-way ANOVA, p=<0.0001. (g-i) Procedures to test sickness behaviors: temperature preference (g), change in appetite (h), change in locomotion (i). (j-l) Quantification of behavioral changes in wildtype mice following saline (grey) or LPS (blue) injection; (j) Median preferred external temperature, p=0.0016, (k) mean appetite, p=<0.0001, (l) mean locomotion, p=0.0372, n=8/group, two-tailed t-test. (m-o) Quantification of behavioral changes following CNO injection in mice with activated VMPOLPS neurons and controls; (m) preferred median temperature, p=<0.0001, (n) mean appetite, p=0.0007, (o) mean locomotion, Kruskal-Wallis Test with Dunn’s multiple comparison. (p-r) Quantification of behavioral changes in mice with ablation of VMPOLPS neurons and controls; (p) preferred median temperature, p=0.0002, (q) mean appetite, (r) mean locomotion, Kruskal-Wallis Test with Dunn’s multiple comparison. All scale bars = 200μm. See Statistics and Reproducibility section for precise n values. in All error bars = SEM.
Figure 4.
Figure 4.. VMPOLPS neurons regulate body temperature and appetite through direct and indirect synaptic connections.
(a,b) Anterograde tracing from LPS-TRAP neurons in the VMPO(c). (d) Expression of GFP-labeled VMPOLPS axonal fibers, n=6 mice. (e) Retrograde tracing from warm-sensitive neurons in AVPe/MnPO (warm-TRAP). (f) Percent overlap of warm-TRAP neurons with adcyap1 and sncg, n=3. (g) Experimental timeline for retrograde tracing. (h) Starter cells in the AVPe/MnPO, green=g-deleted rabies, magenta=AAV-TVA-mcherry. (i) Overlap of rabies-infected input cells (green) and LPS-induced Fos (magenta). (i’) magnification of boxed region in (i). (j) Optogenetic activation of projections from VMPOLPS neurons to AVPe/MnPO. (k) Fiber placement. (l) Body temperature, stimulation (green) or no stimulation (grey) of VMPOLPS-AVPe/MnPO projections, light lines = individual mice, dark lines = mean, n=5, two-way ANOVA, * = p<0.05, ** = p<0.01, *** =p<0.001 (m) Chow consumed, n=5, ns=not significant, two-way Mann-Whitney test (n) Identification of downstream targets. (o) Mean Fos expression following CNO, n=3/group, two-way ANOVA, p=<0.0001 (p) Fos expression in LPS-TRAP neurons, control (top), VMPO activated (bottom). (q) Mean marker expression in DMH LPS-TRAP neurons, n=3 mice. (r) Fos expression following CNO. (s) Mean marker expression in LPS-TRAP neurons in the Arc, n=3 mice. (t) Retrograde tracing from appetite-controlling neurons in Arc. (u) Overlap of agrp and pomc in hunger-TRAP neurons, n=3/group. (v) Timeline of retrograde tracing. (w) Starter cells in the Arc. (x) Overlap of rabies-infected input neurons (green) and LPS-induced Fos (magenta). (x’) high magnification of (x). (y) Activation of VMPOLPS projections to Arc. (z) Fiber placement. (aa) Mean chow consumed following stimulation (on) or no stimulation (off) of VMPOLPS-Arc projections. dot-lines=individuals, n=6, p=0.0065, two-way Mann-Whitney test. (bb) Body temperature after VMPOLPS-Arc stimulation, (n=6). All scale bars = 200μm. All error bars = SEM.
Figure 5.
Figure 5.. Model of the control of body temperature and appetite by VMPOLPS neurons.
Activation of the immune system in periphery leads to circulating immune signals. These signals activate ependymal and endothelial cells lining the blood brain barrier, which react by secreting additional signals including IL-1b, PGE2 and CCL2, which are further amplified by local glial cells. VMPOLPS neurons are activated by these signals through their expression of the corresponding receptors as well as through activation of local synaptic inputs. In response, VMPOLPS neurons induce fever, warmth seeking and loss of appetite through direct and indirect connections to homeostatic brain circuits.

Comment in

References

    1. Konsman JP, Parnet P & Dantzer R Cytokine-induced sickness behaviour: mechanisms and implications. Trends Neurosci 25, 154–159, (2002). - PubMed
    1. McCusker RH & Kelley KW Immune-neural connections: how the immune system’s response to infectious agents influences behavior. J Exp Biol 216, 84–98, (2013). - PMC - PubMed
    1. Evans SS, Repasky EA & Fisher DT Fever and the thermal regulation of immunity: the immune system feels the heat. Nat Rev Immunol 15, 335–349, (2015). - PMC - PubMed
    1. Quan N & Banks WA Brain-immune communication pathways. Brain Behav Immun 21, 727–735, (2007). - PubMed
    1. Nakamori T et al. Organum vasculosum laminae terminalis (OVLT) is a brain site to produce interleukin-1 beta during fever. Brain Res 618, 155–159, (1993). - PubMed