. 2022 Jul;607(7918):360-365.
doi: 10.1038/s41586-022-04801-2. Epub 2022 Jun 8.

Potentiating adoptive cell therapy using synthetic IL-9 receptors

Affiliations

Potentiating adoptive cell therapy using synthetic IL-9 receptors

Anusha Kalbasi et al. Nature. 2022 Jul.

Erratum in

  • Publisher Correction: Potentiating adoptive cell therapy using synthetic IL-9 receptors.
    Kalbasi A, Siurala M, Su LL, Tariveranmoshabad M, Picton LK, Ravikumar P, Li P, Lin JX, Escuin-Ordinas H, Da T, Kremer SV, Sun AL, Castelli S, Agarwal S, Scholler J, Song D, Rommel PC, Radaelli E, Young RM, Leonard WJ, Ribas A, June CH, Garcia KC. Kalbasi A, et al. Nature. 2022 Dec;612(7938):E10. doi: 10.1038/s41586-022-05548-6. Nature. 2022. PMID: 36380037 Free PMC article. No abstract available.

Abstract

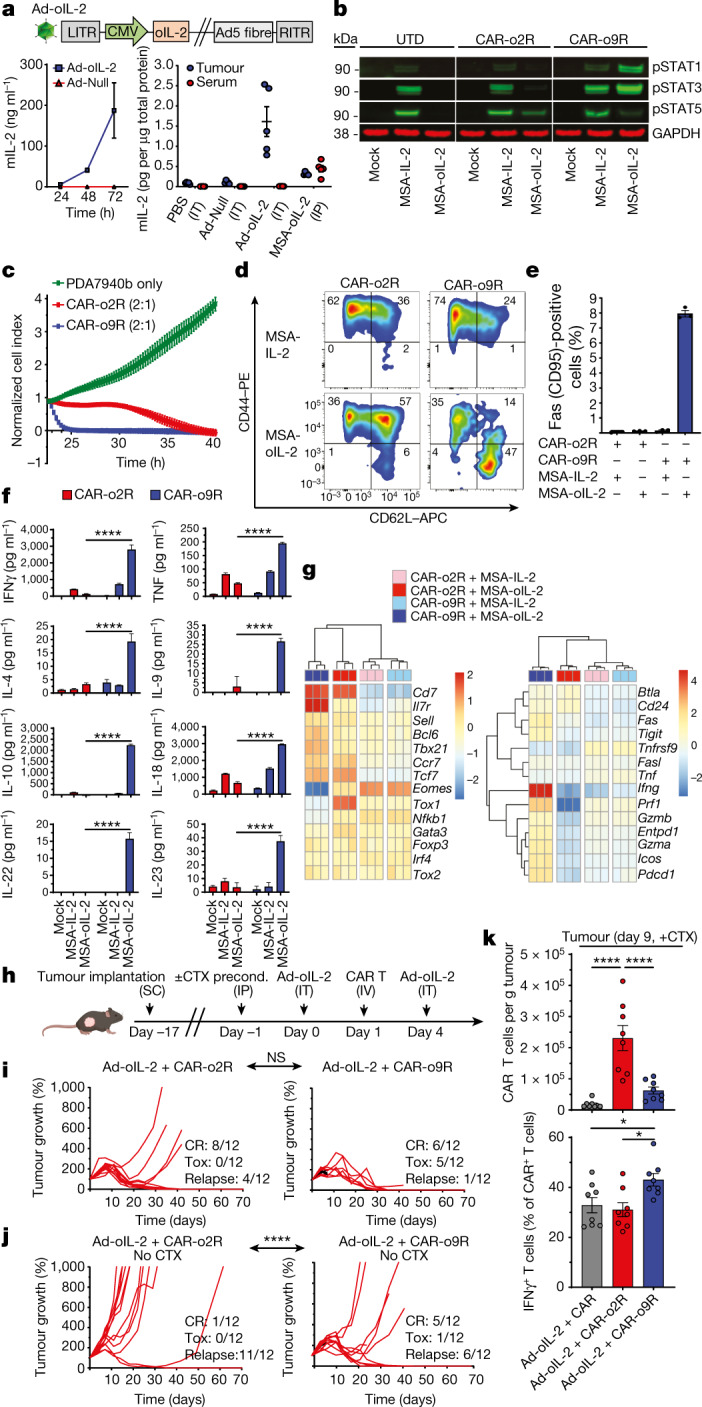
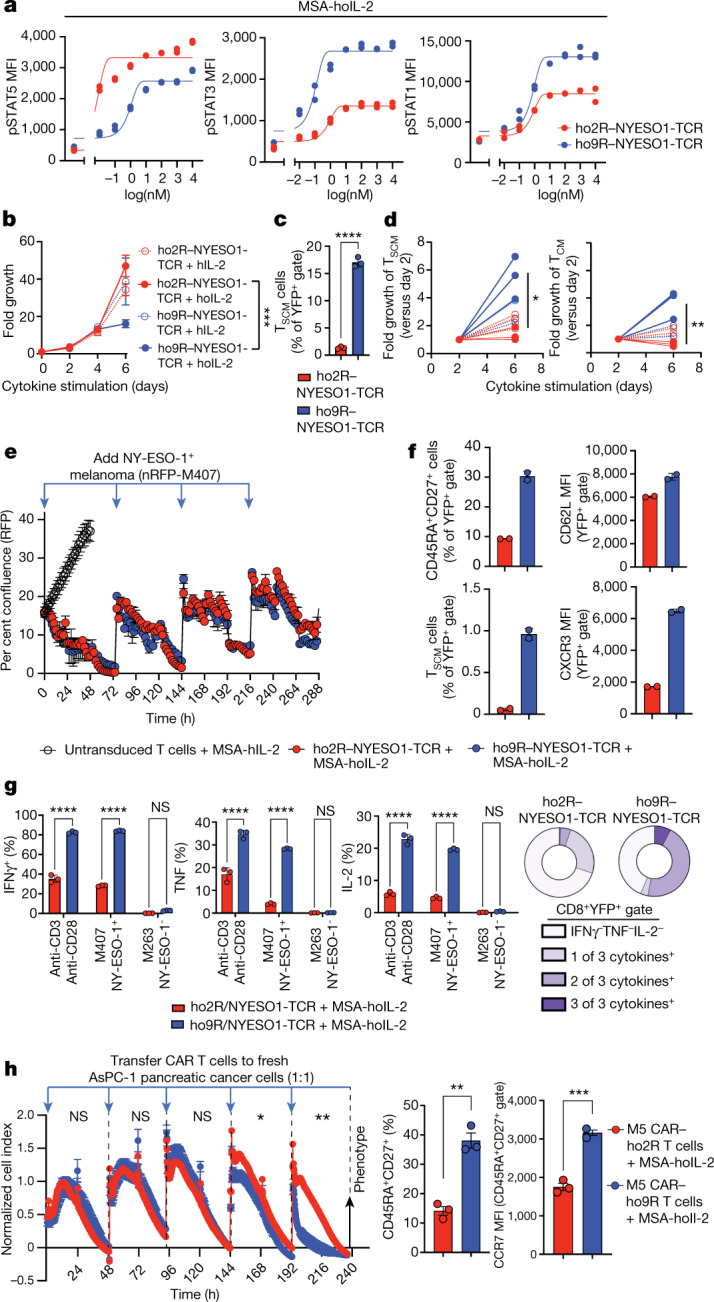
Synthetic receptor signalling has the potential to endow adoptively transferred T cells with new functions that overcome major barriers in the treatment of solid tumours, including the need for conditioning chemotherapy1,2. Here we designed chimeric receptors that have an orthogonal IL-2 receptor extracellular domain (ECD) fused with the intracellular domain (ICD) of receptors for common γ-chain (γc) cytokines IL-4, IL-7, IL-9 and IL-21 such that the orthogonal IL-2 cytokine elicits the corresponding γc cytokine signal. Of these, T cells that signal through the chimeric orthogonal IL-2Rβ-ECD-IL-9R-ICD (o9R) are distinguished by the concomitant activation of STAT1, STAT3 and STAT5 and assume characteristics of stem cell memory and effector T cells. Compared to o2R T cells, o9R T cells have superior anti-tumour efficacy in two recalcitrant syngeneic mouse solid tumour models of melanoma and pancreatic cancer and are effective even in the absence of conditioning lymphodepletion. Therefore, by repurposing IL-9R signalling using a chimeric orthogonal cytokine receptor, T cells gain new functions, and this results in improved anti-tumour activity for hard-to-treat solid tumours.


Conflict of interest statement

A.K. serves on the advisory board of T-Cure Therapeutics and Certis Oncology, holds stock in Certis Oncology, and receives research funding from Highlight Therapeutics. K.C.G., L.L.S., and L.K.P. are inventors on patent application PCT/US2020/050232 on the ortho-9 technology and are shareholders in Synthekine Therapeutics. K.C.G. is the founder of Synthekine Therapeutics. A.R. has received honoraria for consulting with Amgen, Bristol-Myers Squibb, Chugai, Genentech, Merck, Novartis, Roche and Sanofi, is or has been a member of the scientific advisory board and holds stock in Advaxis, Arcus Biosciences, Highlight Therapeutics, Compugen, CytomX, Five Prime, FLX Bio, ImaginAb, IsoPlexis, Gilead Kite, Lutris Pharma, Merus, PACT Pharma, Rgenix and Tango Therapeutics. C.H.J. has received honoraria for consulting with, is a member of the board of directors for AC Immune, is a member of the scientific advisory board and holds stock in Bluesphere Bio, Cabaletta Bio, Carisma Therapeutics, Cellares, Celldex, DeCART Therapeutics, Kiadis Pharma, Tmunity Therapeutics, WIRB-Copernicus Group and Ziopharm Oncology, and receives royalties for intellectual property licensed to Novartis and Tmunity.

Figures

Fig. 1
Fig. 1. A chimeric orthogonal IL-2 receptor reveals properties of IL-9R signalling in T cells.
a, Schematic of wild-type IL-2Rβ, orthogonal IL-2Rβ or γc family chimeric orthogonal receptor complexes (created with Biorender.com). b, Representative histogram and quantification of pSTAT signalling in chimeric-orthogonal-receptor-expressing (YFP+) or untransduced (UTD) T cells stimulated with MSA-IL-2 (100 nM) (unfilled colour) or MSA-oIL-2 (5 μM) (filled colour) for 20 min. Data are shown as mean fluorescence intensity (MFI). c, Dose–response curves of pSTAT signalling in YFP+ o2R (red) or o9R (blue) transduced T cells stimulated with MSA-oIL-2, MSA-IL-2 or IL-9 for 20 min. df, Surface marker levels of CD62L (c), Fas (CD95) (e) and Sca-1 (f) of chimeric-orthogonal-receptor-expressing T cells cultured with MSA-IL-2 (100 nM) or MSA-oIL-2 (5 μM) for two days. NS, not significant; *P < 0.05, ***P < 0.001, ****P < 0.0001 (ANOVA). g, Dose–response curves of YFP+ o2R or o9R cells that have undergone at least one division after four days of culture in MSA-oIL-2 or MSA-IL-2. Data are shown as the percentage divided. Data are mean ± s.e.m. with n = 3 biological replicates, unless stated otherwise. Source data
Fig. 2
Fig. 2. o9R signalling endows pmel T cells with anti-tumour efficacy in the absence of lymphodepletion.
a, Schematic. B16-F10 melanoma-bearing mice underwent ACT and treatment with MSA-IL-2 or MSA-oIL-2 (2.5 × 104 units per day, intraperitoneal) for 5 days. Mice were not lymphodepleted unless noted. TBI, total body irradiation. b, Peripheral blood quantification of pmel T cells seven days after ACT (n = 6 mice per group, except where noted in the Methods). **P < 0.01 (unpaired t-test). c,d, Tumour growth (mean ± s.e.m., n = 6 mice per group, except where noted in the Methods) after treatment with ACT and MSA-IL-2 or MSA-oIL-2. **P < 0.01 (ANOVA). e, Survival of mice treated with pmel T cells and MSA-IL-2 or MSA-oIL-2 for the indicated times. NS, not significant; **P < 0.01 (log-rank test). f, Quantification of tumour-infiltrating o2R or o9R pmel T cells five days after ACT in mice treated with MSA-oIL-2 (n = 5 mice per group). *P < 0.05 (unpaired t-test). g, In vitro growth of nRFP+ B16-F10 tumour cells cocultured with pmel T cells (2:1 effector: target (E:T) ratio) pretreated with MSA-oIL-2 (5 μM). **P < 0.01 (ANOVA). h, opt-SNE clustering of o2R and o9R pmel T cells treated with MSA-oIL-2 (5 μM) for 48 h in vitro (left), with separate plots by group showing differentially abundant clusters (middle), and an annotated volcano plot (right). i, Heat maps of manually curated genes associated with T cell stemness and dysfunction (left) and activation and effector function (right), and differentially expressed between o2R and o9R pmel T cells (from Fig. 3h) treated with MSA-oIL-2 (5 μM). MSA-IL-2-treated groups (50 nM) are also shown. j, Plot of the normalized enrichment score (NES) (left) of transcription factor gene sets comparing o2R and o9R pmel T cells treated with MSA-oIL-2 (from Fig. 3h). Significant enrichment in red (adjusted P < 0.05, two-sided Fisher’s test with hypergeometric formula). Right, ratio of Jun to Fos expression. **P < 0.01 (unpaired t-test). Data are mean ± s.d. with n = 3 biological replicates, unless stated otherwise. Source data
Fig. 3
Fig. 3. Tumour-restricted o9R signalling improves the potency of CAR T cells.
a, Top, schematic of an adenoviral vector encoding oIL-2 (Ad-oIL-2) under the cytomegalovirus (CMV) promoter. LITR, left inverted terminal repeat; RITR, right inverted terminal repeat. Bottom left, in vitro expression of oIL-2 through Ad-oIL-2 in cell culture supernatants. mIL-2, mouse IL-2. Bottom right, quantification of oIL-2 in tumour homogenates and sera 72 h after intratumoral (IT) injection of 109 viral particles (VP) of Ad-oIL-2, or daily intraperitoneal (IP) injection of 2.5 × 104 units MSA-oIL-2 (n = 5 mice per group). b, Representative western blot analysis of pSTAT1, pSTAT3 and pSTAT5 expression in T cells 30 min after stimulation with MSA-IL-2 (100 nM) or MSA-oIL-2 (5 μM). For gel source data, see Supplementary Fig. 1. c, In vitro T cell killing of mesothelin-positive PDA7940b (2:1 E:T ratio) pre-incubated with MSA-oIL-2 (5 μM) (mean ± s.d., n = 4 per group). df, Representative surface expression of CD44 and CD62L (d), expression of Fas (CD95) (e), and secreted cytokines (f) in CAR-o2R or CAR-o9R T cell cultures after four days of stimulation with MSA-IL-2 (100 nM) or MSA-oIL-2 (5 μM). ****P < 0.0001 (ANOVA). g, Heat maps of genes associated with T cell stemness and dysfunction (left) and activation and effector function (right), and differentially expressed between o2R and o9R CAR T cells treated with MSA-oIL-2. h, Schematic of the syngeneic ACT model using PDA7940b tumours (created with Biorender.com). Ad-oIL-2 dose, 109 VP. CAR T cell dose, 5 × 106 cells. Cyclophosphamide (CTX) dose, 120 mg kg−1. IV, intravenous; precond., preconditioning; SC, subcutaneous. i,j, Individual growth curves of PDA7940b tumours (n = 12 mice per group), with (i) and without (j) conditioning CTX. Black lines indicate deaths due to ICANS. n = 12 mice per group. CR, complete response; Tox, deaths due to neurotoxicity. NS, not significant; ****P < 0.0001 (ANOVA). k, Quantification of tumour-infiltrating CAR T cells (top) and frequency of IFNγ-positive tumour-infiltrating CAR T cells (bottom) on day 9 in mice treated with CTX. *P < 0.05, ****P < 0.0001 (ANOVA). Data are mean ± s.e.m. with n = 3 biological replicates, unless stated otherwise. Source data
Fig. 4
Fig. 4. Human chimeric orthogonal IL-2Rβ-ECD–IL-9R-ICD drives stemness and a superior effector capacity in TCR- and CAR-engineered T cells.
a, pSTAT signalling in human NY-ESO-1 TCR T cells co-expressing ho2R or ho9R and stimulated with MSA-hoIL-2 for 20 min. b, Fold expansion of T cells treated with MSA-hoIL-2 (1 μM) or MSA-hIL-2 (0.1 μM) (mean ± s.d.; n = 3 per group). ***P < 0.001 (unpaired t-test at day 6). c, Percentage of CD45RA+CD27+CD95+CCR7+ TSCM cells after six days in culture with MSA-hoIL-2 (1 μM)(mean ± s.d.; n = 3 per group). ****P < 0.0001 (unpaired t-test). d, Fold expansion of TSCM and TCM cells with MSA-hoIL-2 (1 μM) or MSA-hIL-2 (0.1 μM), relative to day 2. *P < 0.05, **P < 0.01 (unpaired t-test); n = 3 per group. e, T cells were cocultured at a 1:1 E:T ratio with the HLA*0201+ NY-ESO-1+ melanoma cell line (nRFP-M407) and MSA-hoIL-2 (1 μM). Tumour cells (105) were reintroduced every 72 h (blue arrows) in the presence of MSA-hoIL-2 (1 μM). Shown is the percentage tumour confluence (mean ± s.d.; n = 3 per group). f, Percentage of CD45RA+CD27+ and TSCM cells, alongside CD62L and CXCR3 MFI (YFP+ gate) after the fourth tumour challenge (from e). g, T cells after the fourth tumour challenge (from e) were restimulated with anti-CD3 or anti-CD28 antibodies, M407 (HLA*0201+NY-ESO-1+) or M263 (HLA*0201NY-ESO-1). IFNγ, TNF and IL-2 were quantified among CD8+YFP+ T cells by intracellular cytokine staining (ICS) (mean ± s.d.; n = 3 per group). NS, not significant; ****P < 0.0001 (two-way ANOVA). Donut charts indicate the proportion of CD8+YFP+ T cells in each group expressing 0/3, 1/3, 2/3 or 3/3 cytokines. h, Sorted T cells co-expressing either ho2R or ho9R and anti-mesothelin M5 CAR were cocultured at a 1:1 E:T ratio with AsPC-1 PDA cells in the presence of MSA-hoIL-2 (1 μM) every 48 h. Left, tumour viability measured as normalized cell index (mean ± s.e.m.; n = 3 per group). Right, after the last tumour challenge, T cell surface markers were characterized. *P < 0.05, **P < 0.01, ***P < 0.001; NS, not significant (two-way ANOVA for tumour cell killing; unpaired t-test for phenotypic analysis). Source data
Extended Data Fig. 1
Extended Data Fig. 1. Mechanisms of o9R signalling.
a, pSTAT-1, -3, -5 and -6 signalling dose response curves of orthoIL-2Rβ ICD chimeric receptor expressing T cells stimulated with MSA-oIL2 for 20’. b, pSTAT-1, -3, and -5 signalling dose response of untransduced or o2R or o9R expressing T cells stimulated with MSA-oIL2 or MSA-IL2 for 20’. c,d, IL-9R expression on mock transduced or IL-9R transduced T cells from C57BL6 (c) or pmel TCR transgenic mice (d). e, Dose–response curves of STAT1, STAT3 and STAT5 phosphorylation in pmel T cells transduced with native IL-9R (pmel-IL-9R), o9R (pmel-o9R), or mock transduced (pmel) and stimulated with IL-9, MSA-IL2, or MSA-oIL2. Data are shown as mean fluorescence ± SEM, n = 3 biological replicates unless otherwise stated. Source data
Extended Data Fig. 2
Extended Data Fig. 2. Competition between o9R and wild-type IL-2 signalling.
ac, pSTAT5 (a), pSTAT3 (b), and pSTAT1 (c) signalling in o9R expressing C57BL/6 T cells treated with 10-fold dose titration of MSA-IL2 (starting at 100nM) in the absence (open) or presence of MSA-oIL2 [5 μM] (filled) for 20’. Data shown as mean fluorescence ± SEM, n = 3 biological replicates, YFP(+) gated. Source data
Extended Data Fig. 3
Extended Data Fig. 3. Proliferative effects of chimeric orthogonal receptors.
a, Dose titration in vitro proliferation curves of o2R and orthogonal chimeric receptor (o4R, o7R, o9R, o21R) expressing T cells cultured for four days in MSA-IL2 (open symbol) or MSA-orthoIL2 (filled symbol). Data represent total live CD8+YFP(+) cells normalized to the maximal growth of each different chimeric receptor expressing cell cultured in MSA-IL2. Data represents mean of n = 2 biological replicates. b, In vitro proliferation of CTV-labelled T cells transduced with o2R (red) or o9R (blue) cultured for four days in MSA-oIL2 (filled curves) or MSA-IL2 (unfilled curves). YFP(+) gated; one of three representative plots shown. Source data
Extended Data Fig. 4
Extended Data Fig. 4. Signalling and proliferation of o2R and o9R pmel T cells.
a, STAT1, STAT3 and STAT5 phosphorylation in o2R versus o9R pmel T cells after 30’ stimulation with MSA-oIL2 (5μM). Shown are MFI of individual biological duplicates, gated on YFP+ cells. **, p < 0.01; ****, p < 0.0001 (ANOVA). b, Shown are seven replicate experiments measuring in vitro proliferation (measured by fold growth) of o2R or o9R pmel T cells over 48 h in culture with MSA-oIL2, (each data point represents mean ± SD, n = 3). *, p < 0.05 (ratio paired t-test, two-sided).
Extended Data Fig. 5
Extended Data Fig. 5. Anti-tumour efficacy, tumour infiltration, phenotype and function of o2R and o9R pmel T cells.
a,b, Survival of B16-F10 tumour-bearing mice treated with (a) o2R or (b) o9R pmel T cells and MSA-IL2 or MSA-oIL2. BL/6 T cells treated with MSA-IL2 were used as an off-target T cell control. Untransduced pmel T cells plus mIL-2 in tumour-bearing lymphodepleted and non-lymphodepleted mice served as controls. c, Effect of o9R pmel T cells in a lymphodepleted host. Tumour growth (mean ±SEM, left panel) of B16-F10 tumours in lymphodepleted C57BL/6 mice treated with o9R pmel T cells and MSA-IL2, MSA-oIL2, or no IL2. d, Individual B16-F10 tumour growth curves related to survival curves shown in Fig. 2e. All mice were non-lymphodepleted except one group (in purple) which received total body irradiation (5Gy). CR, complete regression. *, p < 0.05; **p < 0.01; ****, p < 0.0001 (ANOVA). e, opt-SNE clustering of CD45+ tumour-infiltrating leukocytes seven days after adoptive transfer of o2R (left) and o9R (middle) pmel T cells (n = 4 mice/group; mice were treated without lymphodepletion and treated MSA-oIL2 2.5x10⁴ units/day for five days starting with ACT). Volcano plot of differentially abundant clusters in tumours from mice treated with o9R versus o2R pmel T cells (right panel). f, opt-SNE clustering of the subset of tumour infiltrating o9R and o2R pmel T cells in non-lymphodepleted hosts treated with MSA-oIL2 (n = 4 mice/group, left panel), with separate plots for each treatment group illustrating only differentially abundant clusters (middle panel), and a volcano plot of differentially abundant clusters annotated with distinguishing features (right panel). g, Tumour-infiltration of CD3+CD8+ T cells and CD8+PD1+ T cells in non-lymphodepleted hosts treated with either o2R and MSA-oIL2 or o9R pmel T cells and MSA-oIL2 by multiplex IHC (red = CD3, orange = CD8, yellow = PD1, green = CD4, teal = FOXP3). Images are representative of tumours from n = 3 mice/group and of one independent experiment (conclusions verified in three independent experiments by flow and mass cytometry). Quantifications (mean ± SD) shown to the right (n = 3 biological replicates/group). h, In vitro growth (mean ± SD, n = 3 biological replicates/group) of nRFP+ B16-F10 tumour cells cocultured with o2R or o9R pmel T cells (2:1 E:T ratio) pretreated with MSA-IL2 (50nM). i, IFNγ secretion by oIL-2R and oIL-9R pmel T cells cocultured with B16-F10 melanoma in vitro for 24 h. T cells were pretreated with MSA-oIL2 (5 µM) for 48 h in vitro prior to coculture (mean ± SD, n = 3 biological replicates/group). *, p < 0.05; unpaired t-test, two-sided. Source data
Extended Data Fig. 6
Extended Data Fig. 6. o9R signalling in vitro and in vivo drives a TSCM phenotype in pmel T cells.
a, Surface expression of CD62L, Fas (CD95) and CD44 as percentage of CD8+Thy1.1+ sorted o9R pmel T cells, o2R pmel T cells, or pmel T cells transduced with wild-type IL-9R (pmel-IL-9R) and treated with MSA-IL2 (0.05 μM), MSA-oIL2 (5 μM), or IL-9 (.05 μM) for 48 h in vitro. Shown are mean ±SD, n = 3 biological replicates/group. ns, not significant; ****, p < 0.0001; unpaired t-tests, two-sided. b, unsupervised transcriptomic analysis (RNA-seq) of sorted pmel-o2R (n = 3) and pmel-o9R (n = 3) T cells 48 h after exposure to MSA-oIL2 or MSA-IL2 in vitro. Heat map of genes differentially expressed between o2R and o9R pmel T cells treated with MSA-oIL2 (5 μM)(left panel). MSA-IL2 treated groups (50nM) also shown. On principal component analysis (PC1 v PC2, top right panel), samples separate by treatment group. Samples cluster by treatment group when arranged by sample-sample distances in a heat map (bottom right panel), with o9R pmel T cells treated with oIL-2 most distinct among the four groups. c, Frequency of CD62L+ o2R or o9R pmel T cells (Thy1.1+YFP+) from tumour draining lymph nodes (DLN), spleen or tumours of mice treated with MSA-oIL2 (without prior lymphodepletion). Tissues were collected one or five days after adoptive transfer. Shown are mean ±SD with individual data points (n = 3-5 mice per group). **, p < 0.01; ***, p < 0.001; ****, <0.0001; unpaired t-test, two-sided.
Extended Data Fig. 7
Extended Data Fig. 7. o2R and o9R signalling in T cells engineered with an anti-mesothelin CAR.
a, Schematic of primary mouse CD3+ T cells expressing anti-mesothelin CAR and o2R (CAR-o2R) or o9R (CAR-o9R). b, Representative mesothelin CAR expression (top panel), IL-2Rβ expression (middle panel) and CAR/IL-2Rβ co-expression (bottom panel) in untransduced (UTD) or retrovirally transduced CAR-o2R and CAR-o9R T cells as determined by flow cytometry. Middle panel inset, mean fluorescence intensity (MFI) of IL-2Rβ in untransduced and transduced T cell. c,d, Expansion and phenotype of o2R and o9R CAR T cells. c, In vitro CAR T cell expansion. CAR-o2R and CAR-o9R cells were incubated in the presence of MSA-IL2 (100nM) or MSA-oIL2 (5 μM). An aliquot of cells was removed from the plate and stained with Calcein AM viability dye and counted on the Celigo Image Cytometer daily. Mean ±SEM, n = 3 replicate wells/group. d, CD44 and CD62L co-expression on CAR T cells. Full data of representative flow plots in Fig 3d. CAR-o2R and CAR-o9R cells were incubated for four days in the presence of MSA-IL2 (100nM) or MSA-oIL2 (5 μM). CD44 and CD62L surface co-expression was determined by flow cytometry on live CAR+ cells. Mean ±SEM, n = 3/group. ns, not significant. ****P < 0.0001 (ANOVA). e, Individual growth curves of PDA7940b tumours by treatment group; control groups corresponding to Fig. 3i,j Source data
Extended Data Fig. 8
Extended Data Fig. 8. RNA ISH and serum markers of toxicity on day 11.
a,b, Representative images of brain and meningeal sections stained with fluorescent probes specific for mouse CAR (red, Cy3), mouse mesothelin (green, FITC) and counterstained with DAPI (blue). CAR-positive cells (white arrows) and mesothelin-positive meningeal cells (purple arrows) indicated in the pia-arachnoid layer of the meninges. Scale bars, 50 μm. c,d, Semi-quantification of CAR T cells and mesothelin-positive cells in stained brain sections. Mean ±SEM, two sections/mouse, three mice/group. *P < 0.05 (two-sided t test with Welch’s correction). e, Serum levels of calcium, phosphorus, potassium, uric acid, and f, cytokine release syndrome (CRS)-associated cytokines on day 11 of treatment. Mean ± SEM, n = 3 mice/group. g, Representative photomicrographs from 3 mice (160 days post-treatment) cured of PDA7940b tumours showing histologically normal leptomeninges, without immune/inflammatory cell infiltrates, covering the temporoparietal region of the cerebral hemispheres. H&E, scale bar: 100 μm.
Extended Data Fig. 9
Extended Data Fig. 9. Anti-tumour efficacy of mesothelin-specific o2R and o9R CAR T cells combined with intratumoral delivery of Ad-oIL2.
a, Survival differences between mice treated with CAR-o2R + Ad-oIL2 and CAR-o9R T cells + Ad-oIL2 with or without conditioning chemotherapy. Kaplan-Meier survival curves of treatment groups in Fig. 3i–k. **P < 0.01, ****P < 0.0001 (Log rank Mantel-Cox test). b,c, Anti-tumour efficacy of Ad-oIL2 with control CAR T cells or Ad-Null and CAR-o2R T cells. b, Anti-tumour efficacy in mice treated with Ad-oIL2 and CAR T cells (without orthogonal cytokine receptor). Established subcutaneous PDA7940b tumours were treated with Ad-oIL2 on days 0 and 4 (1x10⁹ VP/tumour) and with CAR T cells on day 0 (5x10⁶). Mean ± SEM, n = 5 mice/group. ns, not significant (ANOVA). c, Anti-tumour efficacy in mice treated with Ad-Null (no transgene) and CAR-o2R T cells. Established subcutaneous PDA7940b tumours were treated with Ad-Null on days 0 and 4 (1x10⁹ VP/tumour) and with CAR-o2R T cells on day 0 (5x10⁶). Mean ± SEM, n = 5 mice/group. ns, not significant (ANOVA). d, Tumour volumes (mean ±SEM) of cured mice (from Fig. 3j) rechallenged with PDA7940b compared to age-matched naïve mice (n = 10, 8 and 6 mice for naïve, Ad-oIL2 + CAR-o2R and Ad-oIL2 + CAR-o9R groups, respectively). *P < 0.05; **P < 0.01; ns, not significant (ANOVA). e, Quantification of CD45.1+ lymphocytes in peripheral blood of rechallenged mice (mean ±SEM, n = 10, 8 and 6 mice for naïve, Ad-oIL2 + CAR-o2R and Ad-oIL2 + CAR-o9R groups, respectively). ns, not significant (ANOVA). Source data
Extended Data Fig. 10
Extended Data Fig. 10. Human chimeric orthogonal IL-2Rβ-ECD–IL-9R-ICD drives a stem-like phenotype and polyfunctionality in T cells even after repetitive antigen-specific tumour challenge.
a, Flow plots of normal healthy donor T cells co-transduced with either ho2R and NYESO1-TCR (left) or ho9R and NYESO1-TCR (right), as detected by anti-human Vβ13.1 antibody that recognizes the β chain of the NYESO1-TCR clone 1G4 and YFP (internal marker of the o2R or o9R vectors). Co-transduction efficiencies are shown. b, pSTAT signalling dose response of untransduced or ho2R (red) or ho9R (purple) or untransduced (UTD; grey) expressing activated human T cells (donor 651) stimulated with MSA-hoIL2 (top panel) or MSA-hIL2 (bottom panel) for 20’. Data are shown as mean fluorescence ± SEM, n = 2. c, Gating strategy for immunophenotyping of YFP+ population of ho2R–NYESO1-TCR and ho9R–NYESO1-TCR T cells shown in Fig. 4c. d, Immunophenotype of ho2R–NYESO1-TCR and ho9R–NYESO1-TCR engineered human T cells after six days in culture with MSA-hoIL2 (1 μM). Shown are representative plots of CD45RA and CD27 expression gated on YFP+ T cells (top row), and CD95 and CCR7 expression gated on the CD45RA+CD27+ population (indicated by arrow and dotted line) corresponding to bar plot in Fig. 4c. e, Immunophenotype of ho2R–NYESO1 TCR and ho9R–NYESO1 TCR engineered human T cells after two days in culture with MSA-hoIL2 (1 μM). Shown is bar plot quantification of TSCM cells as a percentage of the YFP+ population (mean ±SD, n = 3 biological replicates/group). **, p < 0.01 (unpaired t-test, two-sided). f, T cells from Fig. 4e were collected and restimulated with either αCD3/αCD28 dynabeads, melanoma cell line M407 (HLA*0201+NY-ESO-1+) or M263 (HLA*0201+NY-ESO-1). IFNγ, TNF and IL-2 were quantified among YFP+ CD4 T cells (CD8-) by ICS (mean ±SD, n = 3 biological replicates/group). g, Gating strategy for flow sorting of healthy donor T cells co-transduced with lentiviruses expressing anti-mesothelin CAR (M5) and ho2R-GFP/ho9R-GFP (left plots). Right plots indicate MFI of orthogonal IL-2Rβ in double-positive cells. Source data

Comment in

References

    1. Rosenberg SA, Restifo NP. Adoptive cell transfer as personalized immunotherapy for human cancer. Science. 2015;348:62–68. doi: 10.1126/science.aaa4967. - DOI - PMC - PubMed
    1. Dudley ME, et al. Adoptive cell therapy for patients with metastatic melanoma: evaluation of intensive myeloablative chemoradiation preparative regimens. J. Clin. Oncol. 2008;26:5233–5239. doi: 10.1200/JCO.2008.16.5449. - DOI - PMC - PubMed
    1. Philip M, et al. Chromatin states define tumour-specific T cell dysfunction and reprogramming. Nature. 2017;545:452–456. doi: 10.1038/nature22367. - DOI - PMC - PubMed
    1. Schietinger A, et al. Tumor-specific T cell dysfunction is a dynamic antigen-driven differentiation program initiated early during tumorigenesis. Immunity. 2016;45:389–401. doi: 10.1016/j.immuni.2016.07.011. - DOI - PMC - PubMed
    1. Gattinoni L, Klebanoff CA, Restifo NP. Paths to stemness: building the ultimate antitumour T cell. Nat. Rev. Cancer. 2012;12:671–684. doi: 10.1038/nrc3322. - DOI - PMC - PubMed

Publication types

MeSH terms

Substances