. 2022 Jun 8;12(1):9484.
doi: 10.1038/s41598-022-13245-7.

Three-dimensional analysis of interstitial cells in the lamina propria of the murine vas deferens by confocal laser scanning microscopy and FIB/SEM

Affiliations

Three-dimensional analysis of interstitial cells in the lamina propria of the murine vas deferens by confocal laser scanning microscopy and FIB/SEM

Tasuku Hiroshige et al. Sci Rep. .

Abstract

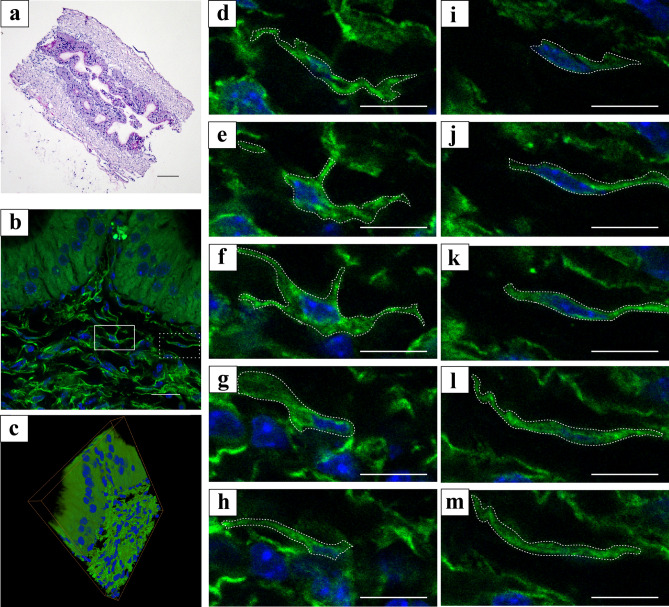
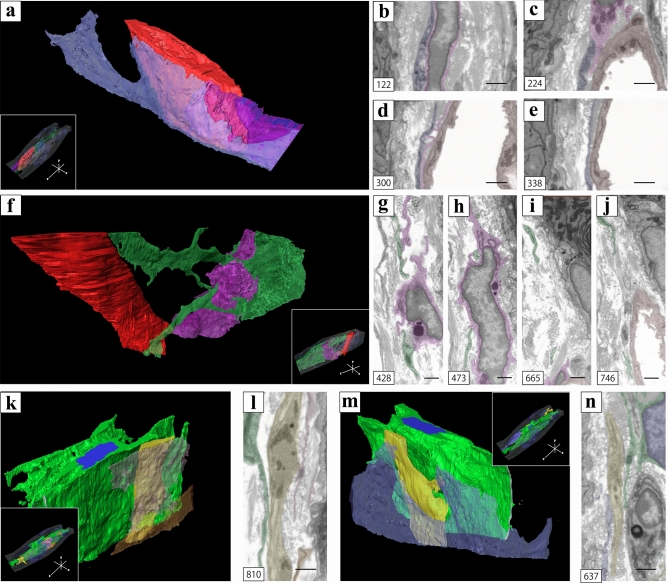
The present study aimed to explore the three-dimensional (3D) ultrastructure of interstitial cells (ICs) within the lamina propria of the murine vas deferens and the spatial relationships between epithelial cells and surrounding cells. Focused ion beam scanning electron microscopy and confocal laser scanning microscopy were performed. ICs within the lamina propria had a flat, sheet-like structure of cytoplasm with multiple cellular processes. In addition, two types of 3D structures that comprised cell processes of flat, sheet-like ICs were observed: one was an accordion fold-like structure and the other was a rod-shaped structure. ICs were located parallel to the epithelium and were connected to each other via gap junctions or adherens junctions. Moreover, multiple sphere-shaped extracellular vesicle-like structures were frequently observed around the ICs. The ICs formed a complex 3D network comprising sheet-like cytoplasm and multiple cell processes with different 3D structures. From this morphological study, we noted that ICs within the lamina propria of murine vas deferens may be involved in signal transmission between the epithelium and smooth muscle cells by physical interaction and by exchanging extracellular vesicles.


Conflict of interest statement

The authors declare no competing interests.

Figures

Figure 1
Figure 1
(a) Hematoxylin and Eosin-stained sagittal section of the murine vas deferens. (b) 2D digital slice extracted from the sequential immunofluorescence images for platelet-derived growth factor α (PDGFRα) (green). (c) Oblique view of reconstructed sequential 3D immunofluorescence images of PDGFRα (green). (dh) Sequential high-magnification immunofluorescence images of white line square area in (b). (im) Sequential high-magnification immunofluorescence images of white dot square area in (b). PDGFRα-immunoreactive areas were shown by white dotted line box. Nuclei were counterstained in blue with 4′,6-diamidino-2-phenylindole (bm). The images underwent deconvolution and 3D reconstruction using the Avizo software (version 9.1.1). Scale bar: 200 µm (a), 20 µm (dm).
Figure 2
Figure 2
(a) 2D digital slice extracted from the sequential immunofluorescence images for platelet-derived growth factor α (PDGFRα) (green) and connexin 43 (red). (b) Reconstructed sequential 2D digital slice immunofluorescence images for connexin 43 (red). (ch) Sequential high-magnification immunofluorescence images of frozen sections for PDGFRα (green) and connexin 43 (red). Connexin43 immunoreactive areas were shown by white arrows and PDGFRα-immunoreactive areas including connexin43 immunoreactive areas were shown by white dotted line box. Nuclei were counterstained in blue with 4′,6-diamidino-2-phenylindole (a, ch). The images underwent deconvolution and 3D reconstruction using the Avizo software (version 9.1.1). Scale bar: 20 µm (ch).
Figure 3
Figure 3
(a) Surface observation of the murine vas deferens using focused ion beam/scanning electron microscopy (FIB/SEM). The high magnification area in the lamina propria after a series of sequential images were acquired using FIB/SEM [lower left inset of (a), upper right inset of (a)]. (b) 3D-reconstruction of interstitial cells (ICs) surrounding tissue and cells within the lamina propria in lower left inset of (a). Tissue block reconstructed from 1,500 FIB/SEM images with 50 nm spacing in the longitudinal muscle layer at a pixel size of 14.5703 × 14.5703 nm2 [lower right inset of (b)]. (c) 3D-reconstruction of ICs surrounding tissue and cells within the lamina propria in upper right inset of (a). Tissue block reconstructed from 1,100 FIB/SEM images with 50 nm spacing in the orbital muscle layer at a pixel size of 9.10645 × 9.10645 × 50 nm2 [lower right inset of (c)]. (d) 3D-reconstruction of ICs extracted from (b). (e) 3D-reconstruction of ICs extracted from (c). The images underwent deconvolution and 3D reconstruction using the Avizo software (version 9.1.1).
Figure 4
Figure 4
(a) Stereoscopic 3D reconstructed image of the flattened, sheet-like interstitial cell (IC). (b) A flattened, sheet-like shape of the IC. High magnification of the whole 3D reconstruction images [white line square area of inset of (b)]. (c) An elongated rod-like shape of the IC; high magnification of the whole 3D reconstruction images [white line square area of inset of (c)]. (bd) 3D digital slices extracted from the sequential images of the IC along the XY direction. (e, f) 2D digital slices are extracted from the sequential images of the IC along the XZ direction. (g, h) 2D digital slices extracted from the sequential images of the IC along the YZ direction. The spatial relationship between 3D reconstructed image of the IC and 2D digital slices [inset of (b–h)]; E indicates the epithelium and epithelial basement membrane was shown by white dotted line box. For better visualization, the object surfaces are color-coded; IC, transparent green; nuclei, transparent blue. The images underwent deconvolution and 3D reconstruction using the Avizo software (version 9.1.1). Scale bar: 2 µm (bh).
Figure 5
Figure 5
3D reconstruction of the proximity areas between interstitial cells (ICs) [black arrows of (a, e)]; high magnification of the whole 3D reconstruction images [white line square area of inset of (a, e)]. 2D digital slices including the area indicated by black arrows in (a) extracted from the sequential images. (bd) 2D digital slices including the area indicated by black arrows in (e) extracted from the sequential images. (f–h) High-electron density was observed in the area indicated by black arrows in (a, e) [black arrows of (bd, f–h)]. For better visualization, the object surfaces are color-coded; ICs, pink, yellow, light green, and purple. The images underwent deconvolution and 3D reconstruction using the Avizo software (version 9.1.1). Scale bar: 500 nm (bd), 2 µm (fh).
Figure 6
Figure 6
(a) 3D reconstruction of multiple extracellular vesicles (EV)-like structures and the interstitial cells (ICs). High magnification of the white square area of (a) [inset of (a)]; 2D digital slices extracted from the sequential images of the area reconstructed in (a). (be) Loop-like structures around the ICs [black arrows of (be)]; 3D reconstruction of the proximity areas between ICs and epithelium. (f, h, j) The spatial relationship between (f, h, j) and the whole 3D reconstruction images [inset of (f, h, j)]; 2D digital slices extracted from the sequential images of the area reconstructed in (f, h, j) (g, i, k); The proximity areas between ICs and epithelium [black arrows of (g, i, k)]. E indicates the epithelium (be, g, i, k). For better visualization, the object surfaces are color-coded; ICs, pink, green and indigo blue; EV-like structures, white; epithelium, gray. The images underwent deconvolution and 3D reconstruction using the Avizo software (version 9.1.1). Scale bar: 500 nm (be, g, i, k).
Figure 7
Figure 7
(a, f) 3D reconstruction of the proximity areas among ICs, macrophages, and vessels. The spatial relationship between (a, f) and the whole 3D reconstruction images [inset of (a, f)]. (be, gj) 2D digital slices extracted from the sequential images of the area reconstructed in (a, f). (k, m) 3D reconstruction of the proximity areas between ICs and nerves. The spatial relationship between (k, m) and the whole 3D reconstruction images [inset of (k, m)]. (l, n) 2D digital slices extracted from the sequential images of the area reconstructed in (k, m). For better visualization, the object surfaces are color-coded; ICs, indigo blue, green, light green, beige, ocher; macrophages, purple; vessels, red; nerves, yellow; nuclear, blue. The images underwent deconvolution and 3D reconstruction using the Avizo software (version 9.1.1). Scale bar: 500 nm (be, gj, l, m).

Similar articles

Cited by

References

    1. Koslov DS, Andersson KE. Physiological and pharmacological aspects of the vas deferens-an update. Front. Pharmacol. 2013;4:101. doi: 10.3389/fphar.2013.00101. - DOI - PMC - PubMed
    1. Marberger H. The mechanisms of ejaculation. Basic Life Sci. 1974;4:99–110. - PubMed
    1. Berridge MJ. Smooth muscle cell calcium activation mechanisms. J. Physiol. 2008;586:5047–5061. doi: 10.1113/jphysiol.2008.160440. - DOI - PMC - PubMed
    1. Zhao L, et al. Regulation of smooth muscle contractility by the epithelium in rat tracheas: Role of prostaglandin E2 induced by the neurotransmitter acetylcholine. Ann. Transl. Med. 2021;9:313. doi: 10.21037/atm-20-5500. - DOI - PMC - PubMed
    1. Ruan YC, Zhou W, Chan HC. Regulation of smooth muscle contraction by the epithelium: Role of prostaglandins. Physiology. 2011;26:156–170. doi: 10.1152/physiol.00036.2010. - DOI - PubMed

Publication types