. 2022 Jun 8;12(1):9476.
doi: 10.1038/s41598-022-13620-4.

Jaw1/LRMP increases Ca2+ influx upon GPCR stimulation with heterogeneous effect on the activity of each ITPR subtype

Affiliations

Jaw1/LRMP increases Ca2+ influx upon GPCR stimulation with heterogeneous effect on the activity of each ITPR subtype

Wataru Okumura et al. Sci Rep. .

Abstract

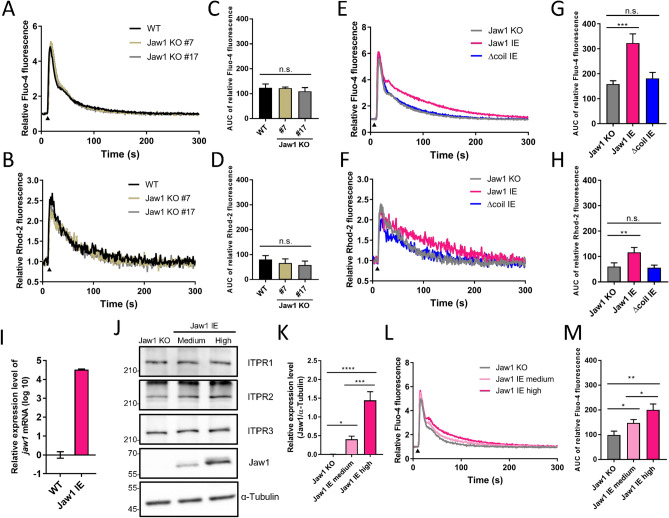
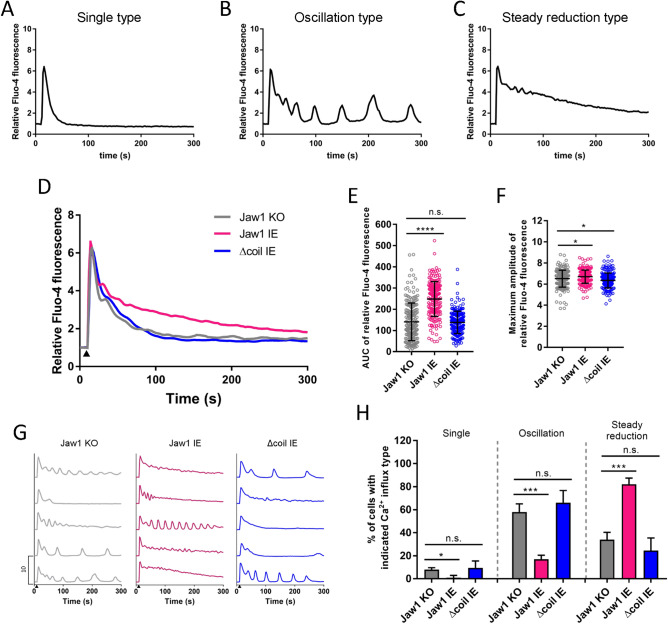
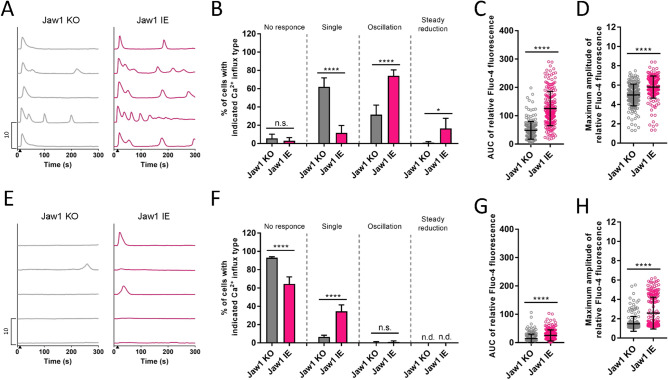
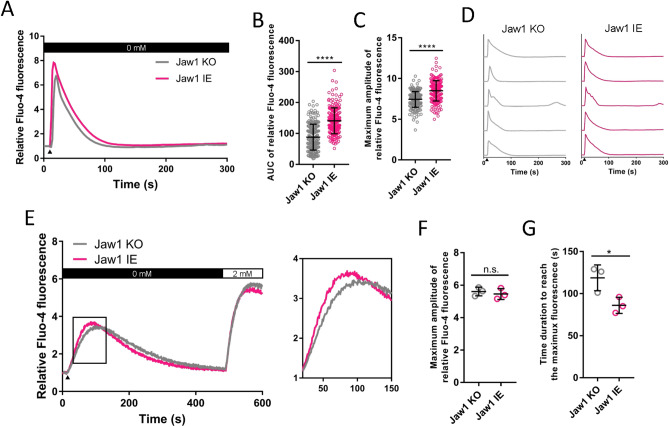
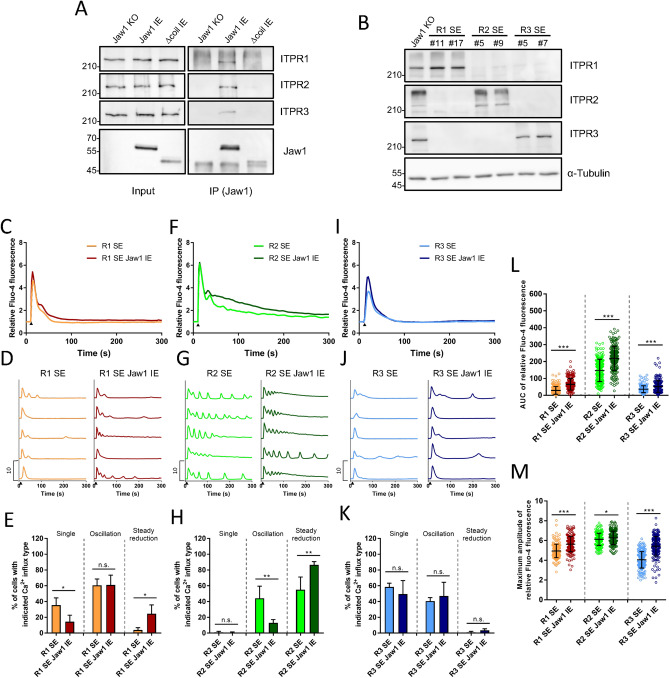
Ca2+ influx upon G protein-coupled receptor (GPCR) stimulation is observed as a cytosolic Ca2+ concentration oscillation crucial to initiating downstream responses including cell proliferation, differentiation, and cell-cell communication. Although Jaw1 is known to interact with inositol 1,4,5-triphosphate receptor (ITPRs), Ca2+ channels on the endoplasmic reticulum, the function of Jaw1 in the Ca2+ dynamics with physiological stimulation remains unclear. In this study, using inducible Jaw1-expressing HEK293 cells, we showed that Jaw1 increases Ca2+ influx by GPCR stimulation via changing the Ca2+ influx oscillation pattern. Furthermore, we showed that Jaw1 increases the Ca2+ release activity of all ITPR subtypes in a subtly different manner. It is well known that the Ca2+ influx oscillation pattern varies from cell type to cell type, therefore these findings provide an insight into the relationship between the heterogeneous Ca2+ dynamics and the specific ITPR and Jaw1 expression patterns.


Conflict of interest statement

The authors declare no competing interests.

Figures

Figure 1
Figure 1
Jaw1 increases the Ca2+ influx depending on its own expression level. (A,B,E,F,L) Mean curves of relative Fluo-4 (A,E,L) or Rhod-2 (B,F) intensity upon 100 µM ATP stimulation measured using a plate reader. WT, Jaw1 KO #7, and Jaw1 KO #17 cells (A,B); Jaw1 KO, Jaw1 IE, and Δcoil IE cells (E,F); or Jaw1 KO, Jaw1 IE medium, and Jaw1 IE high cells (L). The closed triangles indicate the time point of 100 µM ATP solution supplementation. (C,D,G,H,M) AUC in (A), (B), (E), (F), and (L) are shown in (C), (D), (G), (H), and (M), respectively. n = 3. (I) Relative expression level of jaw1 mRNA to gapdh in WT and Jaw1 IE cells measured by RT-qPCR. N = 3. (J) Jaw1 KO and Jaw1 IE cells treated with 0.25 or 200 ng/mL of Dox and subjected to western blotting. Images used for western blots are shown in Supplementary Fig. S4 online. (K) The relative protein expression level of Jaw1 with α-Tubulin in (J). n = 3. The error bar shows ± S.D.; n.s., non-significant; *p < 0.05; **p < 0.01; ***p < 0.001; ****p < 0.0001, Tukey–Kramer’s t-test.
Figure 2
Figure 2
Jaw1 increases Ca2+ influx by changing the Ca2+ influx pattern. (A,B,C) Representative relative intensity traces upon 100 µM ATP stimulation: (A) single, (B) oscillation, and (C) steady reduction types. (D,G) Mean (D) or five representative (G) curves of the relative intensity in Jaw1 KO, Jaw1 IE, and Δcoil IE cells. The closed triangles indicate the time point of 100 µM ATP solution supplementation. n = 200. (E,F) AUC (E) and maximum amplitude (F) of the relative intensity from (D). (H) Ca2+ influx type classification in Jaw1 KO, Jaw1 IE, and Δcoil cells. Four independent experiments (n = 50). The error bars show ± S.D.; n.s., non-significant; *p < 0.05; ***p < 0.001; ****p < 0.0001, Tukey–Kramer’s t-test.
Figure 3
Figure 3
The Jaw1 augmentative effect on the Ca2+ influx is maintained even under weak GPCR stimulation. (A,E) Five representative relative Fluo-4 fluorescence intensity responses to the stimulation with 1 µM (A) or 0.3 µM (E) ATP out of 200 cells. The closed triangles show the time point of ATP stimulation. (B,F) Ca2+ influx type classification in each cell line upon stimulation with 1 µM (B) or 0.3 µM (F) ATP. The ratios were calculated based on the average of four independent wells. (C,D,G,H) Graph representing the AUC (C,G) and maximum amplitude (D,H) of the relative Fluo-4 fluorescence intensity in each cell line upon stimulation with 1 µM (C,D) or 0.3 µM (G,H) ATP in 200 cells. The error bar shows ± S.D.; ****p < 0.0001. Student’s t-test.
Figure 4
Figure 4
Jaw1 accelerates Ca2+ efflux from ER. (A,D) Mean (A) or five representative (D) curves of the relative intensity upon 100 µM ATP stimulation under extracellular Ca2+ free condition in Jaw1 KO and Jaw1 IE cells. n = 200. The closed triangle shows the time point of 100 µM ATP solution supplementation. (B,C) AUC (B) or maximum amplitude (C) of the relative intensity from (A). (E) Mean curves of the relative intensity upon Ca2+ depletion in the ER by 2 µM thapsigargin supplementation in 0 mM Ca2+ and replenishment with 2 mM Ca2+. The closed triangle shows the time point of 2 µM thapsigargin solution supplementation. The area surrounded with a black box is enlarged in the right. n = 3. (F,G) Maximum amplitude in SOCE (F) and time duration to reach the maximum amplitude in the Ca2+ leakage (G) from (E). The error bar shows ± S.D.; n.s., non-significant; *p < 0.05; ****p < 0.0001, Student’s t-test.
Figure 5
Figure 5
Jaw1 increases the activity of all ITPR subtypes with subtle differences. (A) Jaw1 KO, Jaw1 IE, and Δcoil IE cell lysates were subjected to co-immunoprecipitation followed by western blotting. (B) Jaw1 KO, R1 SE #11 or #17, R2 SE #5 or #9, and R3 SE #5 or #7 cells were subjected to western blotting. Images used for western blots of (A) and (B) are shown in Supplementary Fig. S5, S6 online. (C,D,F,G,I,J) Mean (C,F,I) or five representative (D,G,J) curves of the relative intensity in R1 SE, R2 SE, and R3 SE with or without Jaw1 IE cells. Closed triangles indicate the time point of 100 µM ATP solution supplementation. n = 200. (E,H,K) Classification of the Ca2+ influx type in each cell line. Four independent experiments (n = 50). (L,M) AUC (L) or maximum amplitude (M) of the relative intensity from (C), (F), and (I). The error bar shows ± S.D.; n.s., non-significant; *p < 0.05; **p < 0.01; ***p < 0.001.
Figure 6
Figure 6
A model of the Jaw1 function as a regulator of the ITPRs activity upon GPCR stimulation. (A) Jaw1 promotes Ca2+ release activity of ITPRs and increases Ca2+ influx into cytoplasm and mitochondria upon GPCR stimulation. Jaw1 changes the Ca2+ influx pattern from oscillated response to continuous response in high GPCR stimulation, and from weak response to strong response in low GPCR stimulation.

Similar articles

Cited by

References

    1. Medler KF. Calcium signaling in taste cells. Biochim. Biophys. Acta. 2015;1853:2025–2032. doi: 10.1016/j.bbamcr.2014.11.013. - DOI - PMC - PubMed
    1. Pinto MC, et al. Calcium signaling and cell proliferation. Cell. Signal. 2015;27:2139–2149. doi: 10.1016/j.cellsig.2015.08.006. - DOI - PubMed
    1. Trebak M, Kinet JP. Calcium signalling in T cells. Nat. Rev. Immunol. 2019;19:154–169. doi: 10.1038/s41577-018-0110-7. - DOI - PMC - PubMed
    1. Bagur R, Hajnóczky G. Intracellular Ca2+ sensing: Its role in calcium homeostasis and signaling. Mol. Cell. 2017;66:780–788. doi: 10.1016/j.molcel.2017.05.028. - DOI - PMC - PubMed
    1. Putney JW, Tomita T. Phospholipase C signaling and calcium influx. Adv. Biol. Regul. 2012;52:152–164. doi: 10.1016/j.advenzreg.2011.09.005. - DOI - PMC - PubMed

Publication types

MeSH terms